

Warning Shots
Midweek Market Update March 15, 2023

Are bank stocks a warning shot?
Silvergate Bank is gone. SIVB
Signature Bank is gone. SBNY
Numerous regional bank stocks have been cut in half, or worse. The Regional Banking ETF KRE recently traded down -35% from its YTD high.
Sometimes risk shows up like that; quickly and seemingly unannounced.
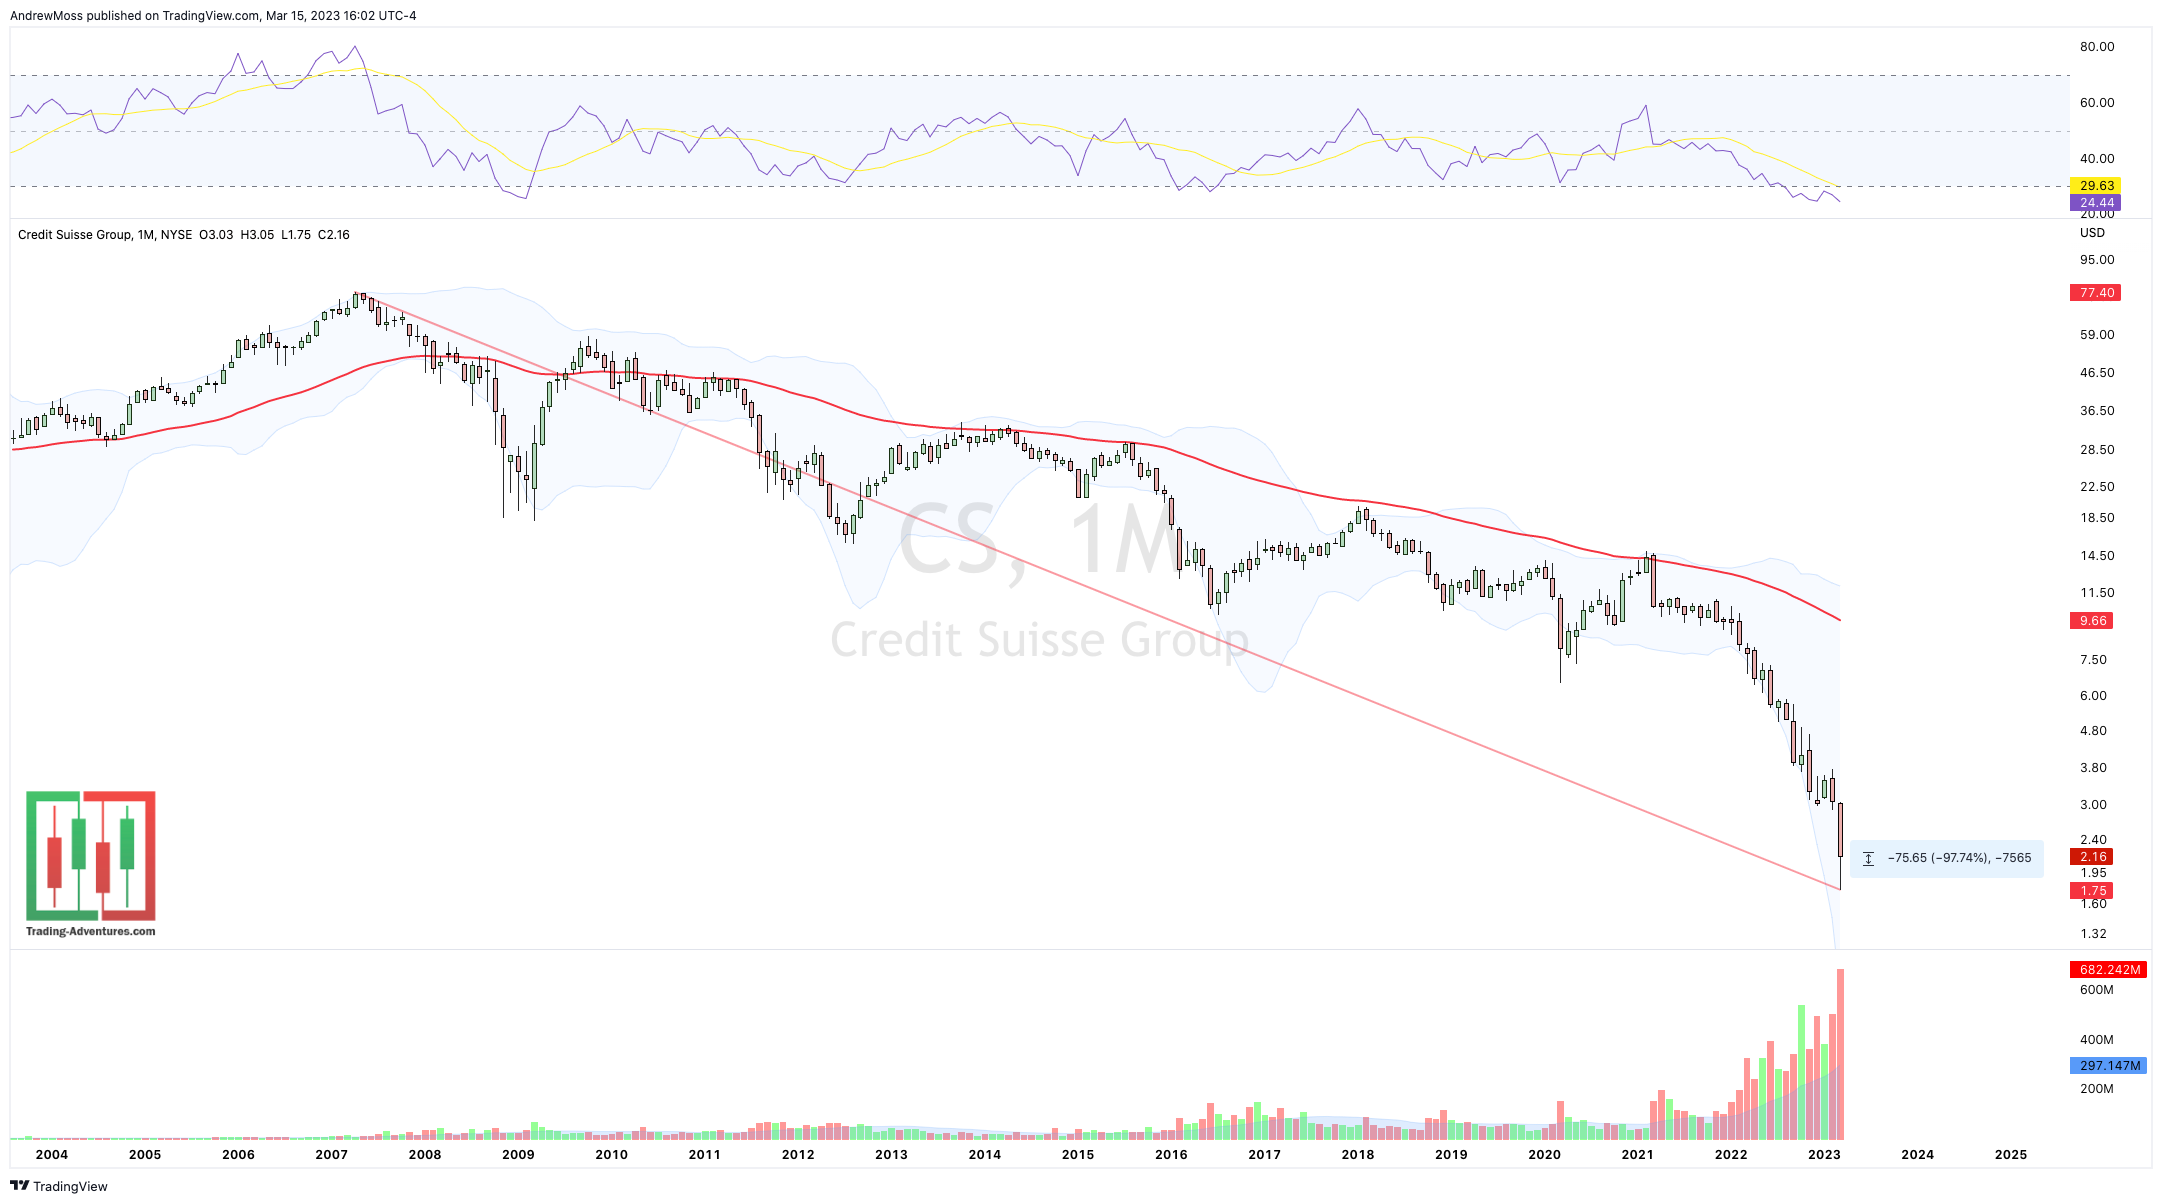
Other times it shows up very slowly, as in the case of Credit Suisse CS, whose stock traded as low as $1.75 this morning. This issue peaked in April of 2007 at $77.40 a share and has been in a steady decline ever since.
Banks are suffering. Interest rates have come down quickly. Commodities are breaking down.
Are these warning shots?
Signals of more pain to come for the stock market?
For the economy?
According to SP Global Financials account for 11.7% of the SP 500. Will the overall market be able to go up while banks go down?
The Primary Function of a Stock Chart
We don’t have to know. What we have to do, is manage risk.
Or perhaps more importantly, when NOT to own it.
That is the main utility of a stock chart.
It’s not to show a breakout pattern. It’s not for projecting price targets. It’s certainly not about making predictions.
The primary use for a stock chart is to be a tool for managing risk.
Patterns, projections, retracements, relative strength…
Those tools are useful and deserve to have a place in our process. But never forget the primary purpose.
Risk management is job #1.
The Charts
SPY traded lower early in the day before another late rally carried it back into the congestion zone. The positive price movement is nice. But there is still plenty of supply overhead.
QQQ continues to show relative strength as Tech has seemingly been the “safety” trade.
IWM has regional banking exposure and it’s showing up in the price as the index tested the $170 pivot before regaining some strength.
DIA dipped below the March 2020 low anchored VWAP, which appears to be the last bit of potential support for a while.
XLF is selling off hard on massive volume for the last seven sessions. $29.50-$30.50 is a reference point.
EUFN European financials were recently a leading sector. But now they are selling off at a pace similar to XLF. Both are down roughly -16% from recent highs to today’s lows.
For EUFN the 200-day MA is just below at $16.83
The levels of potential support and resistance help to give an idea of what could happen.
Has the price been able to hold a support level before?
Has a resistance level kept prices from moving higher in the past?
All of these questions revolve around risk management.
Examine them with curiosity. Then ask follow-up questions like,
“If this happens, then what is likely to occur next.”
Look for the path of least resistance.
For now, that path appears to be lower for many stocks and sectors. However, the degree of downside extension could likely lead to a short-term bounce.
Patience, fewer positions, and smaller position sizes can help navigate this choppiness.
***This is NOT financial advice. NOT a recommendation to buy, sell or trade any security. The content presented here is intended for educational purposes only.
Andrew Moss is an associated member of T3 Trading Group, LLC (“T3TG”) an SEC registered broker/dealer and member of FINRA/SIPC. All trades placed by Mr. Moss are done through T3TG.
Statements in this article represent the opinions of that person only and do not necessarily reflect the opinions of T3TG or any other person associated with T3TG.
It is possible that Mr. Moss may hold an investment position (or may be contemplating holding an investment position) that is inconsistent with the information provided or the opinion being expressed. This may reflect the financial or other circumstances of the individual or it may reflect some other consideration. Readers of this article should take this into account when evaluating the information provided or the opinions being expressed.
All investments are subject to the risk of loss, which you should consider in making any investment decisions. Readers of this article should consult with their financial advisors, attorneys, accountants, or other qualified investors prior to making any investment decision.
POSITION DISCLOSURE
March 15, 2023, 4:00 PM
Long: SBNY0317P70, KRC0421P25
Short:
Options symbols are denoted as follows:
Ticker, Date, Call/Put, Strike Price
Example: VXX1218C30 = VXX 12/18 Call with a $30 strike