The Markets
The market bounced. Now what? Is that all we get?
Since the last Thursday update here, (Could Stocks Actually Bounce) stocks have moved nicely higher. Nearly 4% (low to high) for SPY and over 5% for QQQ. Several important hurdles have been cleared and there are still a few more overhead.
Today, just as it was looking like markets were becoming immune to bad news (higher PPI, higher CPI, stronger Dollar) sellers stepped in to test the strength.
Now we find out how much meaning this bounce has.
Monday’s note mentioned —
more news later this week … see if it is good or bad, and how the markets react.
and
follow the process, looking forward to each next step, whether higher or lower.
The news is out (bad) and the reactions were good. But rates…
Prior to the Treasury Bond auction, stocks seemed like they could only go up. The bad news kept coming all week but the sellers never could take control.
before the auction
With the auction, and with 10-year Treasury yields moving back north of 4.7% we were reminded that rates are still the primary driver of these moves, and things sold off sharply.
after the auction
Rates are given as the reason for today’s selloff. But we knew things wouldn’t keep going straight up forever. That’s why we trim positions and raise our stops on the way up.
As prices come down after hitting resistance in the form of gap fills, moving averages, and pivot levels, we shift focus to potential support; first with the rising 5-day moving averages and the week-to-date anchored VWAPs, then the 8 and 21-day MAs, then previous pivot lows. And so on. This is the process.
Now we ask:
Will these levels hold?
Can stocks make a higher low and then resume the positive action?
Do the other measures of breadth and momentum add to the strength? Or takeaway?
The first tests of the first levels are in.
SPY moved lower to 5-day MA and bounced. QQQ nearly tested the WTD AVWAP and bounced. DIA and IWM did not fare as well.
The SPX Bullish Percent index has reversed back to a column of Xs, signaling a “Bull Alert.”
And the percentage of SPX stocks above their 50-day MAs has regained its upward progress.
These are encouraging pieces of the puzzle. But as we know,
Only Price Pays
So continue to watch the Stock and Index charts first, and these indicators second.
The Charts
SPY dipped back into the gap area and recovered to close above. Even though it had a wide range for the day, so far this is the kind of test we want to see. Price remains above the gap/support zone and above the 8 and 21-day MAs to keep the recent momentum.
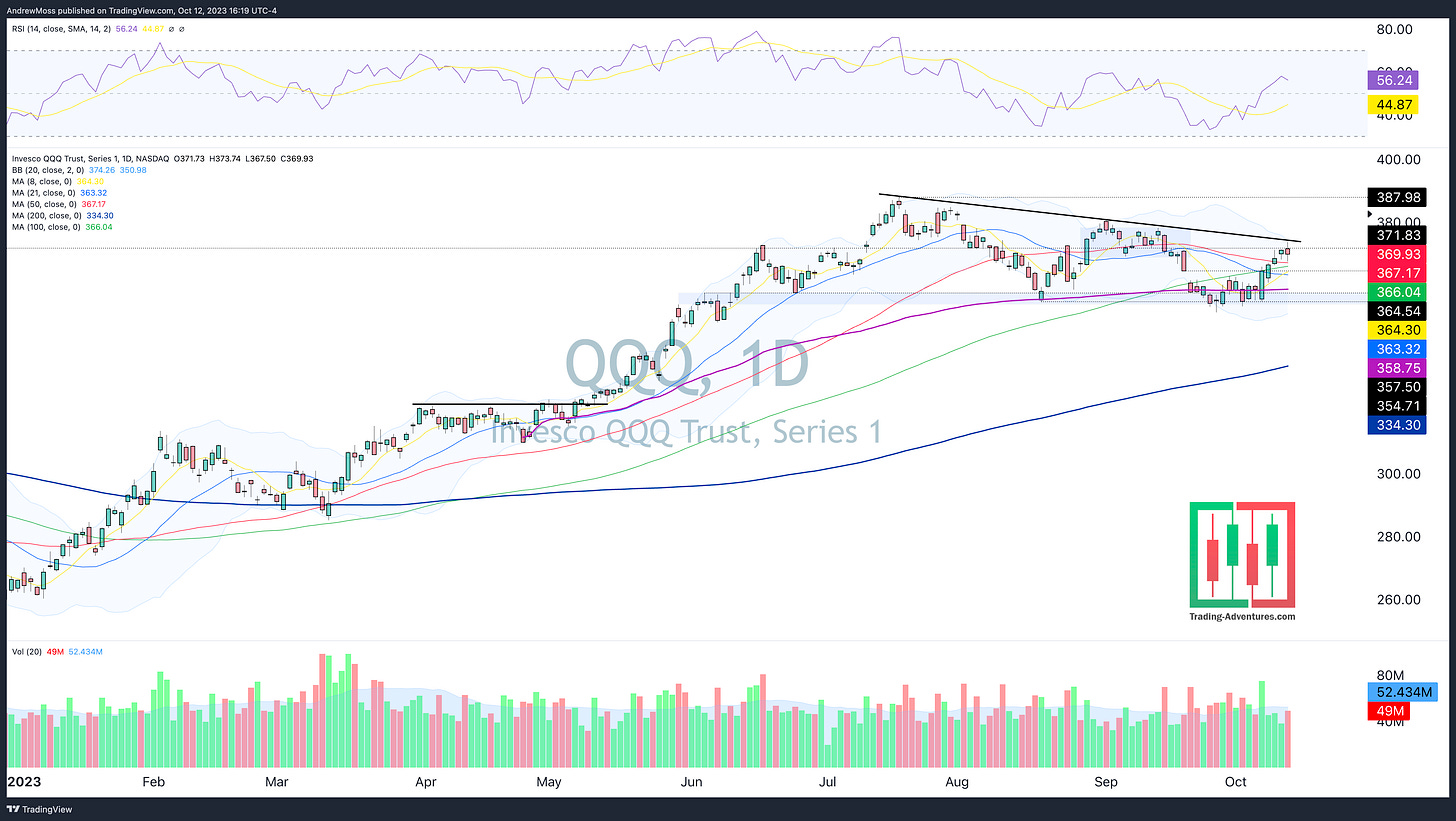
QQQ got very close to the trendline, which looks like it will be some resistance. After the mid-day selloff, it recovered well to stay high in the range and well above all of its key moving averages.
IWM is concerning. While it was nice to see it participating to the upside, this huge down day doesn’t look good. Ideally, any selling would’ve been contained to the upper portion of the recent rally. We’ll have to see if this is a tell of more risk coming, or if it’s just the higher volatility of small-caps in action.
DIA is back below the 21 and 200-day MAs but above the 8-day.
TLT lost a pivot level and the 8-day MA.
DXY The Dollar rallied big from the support zone. Not the action stocks want to see.
The Closing Bell
Once again, continue to follow the process, looking forward to each next step, whether higher or lower.
Bank earnings start tomorrow with JPM, C, WFC, PNC
Weekly Charts Saturday morning.
Don’t miss it!
https://twitter.com/Andy__Moss
The Disclosures
***This is NOT financial advice. NOT a recommendation to buy, sell, or trade any security. The content presented here is intended for educational purposes only.
Andrew Moss is an associated member of T3 Trading Group, LLC (“T3TG”) a SEC registered broker/dealer and member of FINRA/SIPC. All trades placed by Mr. Moss are done through T3TG.
Statements in this article represent the opinions of that person only and do not necessarily reflect the opinions of T3TG or any other person associated with T3TG.
It is possible that Mr. Moss may hold an investment position (or may be contemplating holding an investment position) that is inconsistent with the information provided or the opinion being expressed. This may reflect the financial or other circumstances of the individual or it may reflect some other consideration. Readers of this article should take this into account when evaluating the information provided or the opinions being expressed.
All investments are subject to the risk of loss, which you should consider in making any investment decisions. Readers of this article should consult with their financial advisors, attorneys, accountants, or other qualified investors prior to making any investment decision.
POSITION DISCLOSURE
October 12, 2023, 4:00 PM
Long: AMD, AMZN, MSFT, NVDA, SNAP1027C9
Short:
Options symbols are denoted as follows:
Ticker, Date, Call/Put, Strike Price
Example: VXX1218C30 = VXX 12/18 Call with a $30 strike


Very confusing market as the push pull continues in the various areas. Where is the money leaving and where is it going? This is the question....