Watch for this one factor to fuel the market's next move higher
And three potential trades if it does
$SPY is up strongly with continued fuel this morning coming in the form of a lighter-than-expected PPI report.
As I write this $SPY is exactly $10 higher than its 8-day exponential moving average (EMA) and almost $17 dollars over the 21-day EMA. A welcomed bullish move, for sure. And one that shows some signs of continuation higher. But this degree of upside extension isn't likely to continue.
In order for the next leg higher to start, it would be best if price and price equilibrium get closer together.
In other words, we need to see $SPY trading closer to the 8 and 21 EMAs.
This could come about in a couple of different ways; either price moves lower, or the EMAs move higher. That would make it a little easier to add new long positions with tighter risk parameters.
With that view in mind let's look at some trading plan examples.
$PYPL
PayPal Holdings Inc. formed a textbook hammer reversal pattern after its Nov. '22 earnings report and is now back above the 8/21/50 moving averages, testing the 200-day, and breaking above a broadening formation.
Possible trades:
Watch for the price to move beyond the 200-day MA and then come back. Enter long on a successful retest of the 200-day MA with the pivot low as a stop.
Go long on a close over the 200-day MA with a stop below the 8/21 EMAs
$SHOP.
Shopify Inc. has been in a potential bottoming process since the May '22 earnings report. It has been largely contained in the range between $30-$41 and below its key moving averages. There have been a couple of moves higher that were ultimately snuffed out as the weight of the overall market was too heavy.
The October '22 earnings report was well received and buying came in with more than 2x the average daily volume. Price moved through the key MAs and to the upper Bollinger Band before coming back to retest the 50-day MA.
It’s pushing the Bollinger Bands higher and the RSI is in the bullish zone. Now the stock is facing potential resistance in the form of the upper end of the range and the declining 200-day MA.
Possible scenarios:
Watch for a price or time correction that moves the stock closer to the 8/21 EMAs.
Continued momentum that takes the stock quickly above the range and the 200-day MA followed by a brief selloff and a retest of the 200-day MA.
Either of those would likely present an opportunity to initiate a long position in the stock with very favorable risk/reward and longer-term potential to move higher.
$MNST
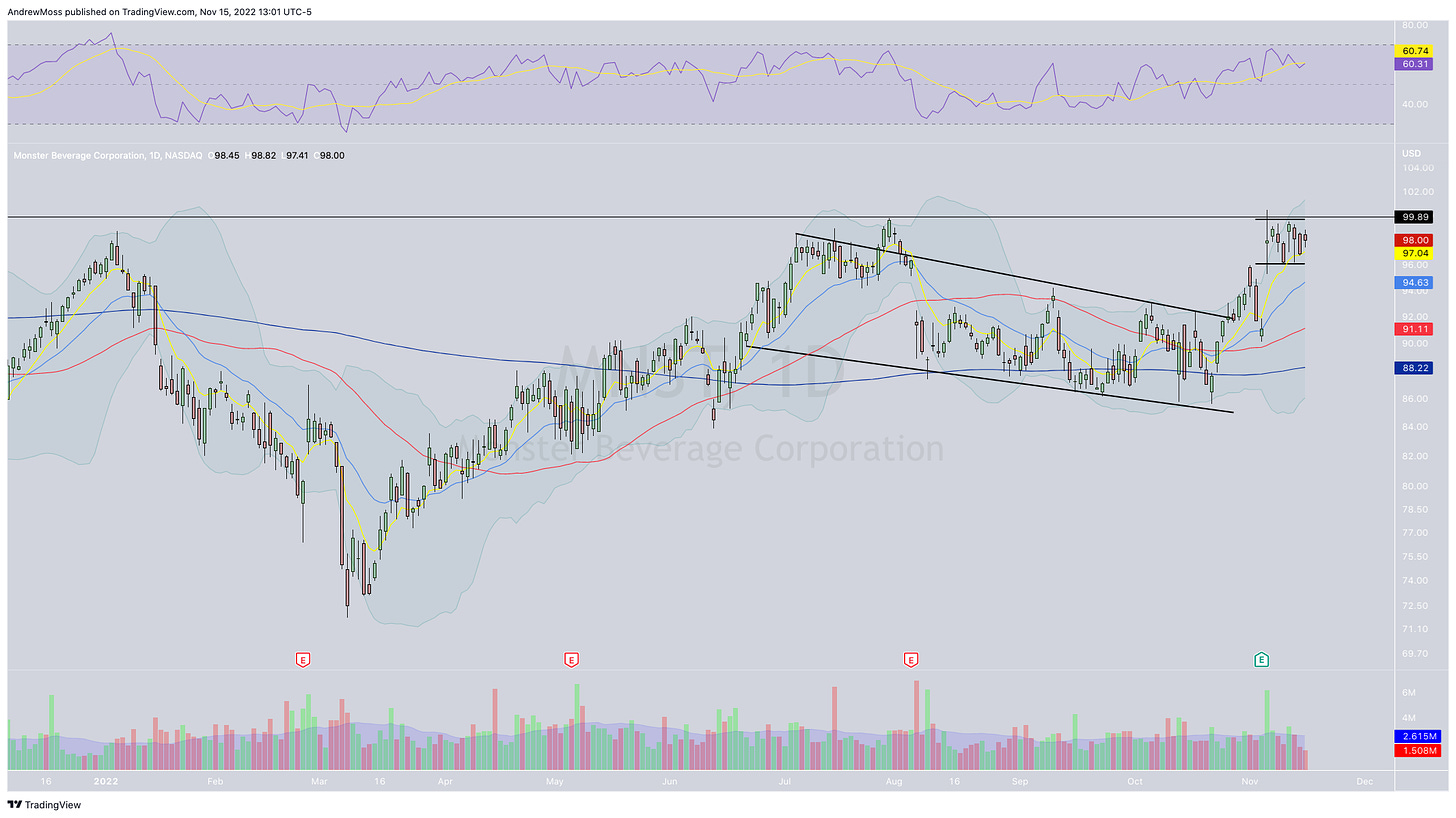
Monster Beverage Corporation's price moved swiftly higher on its most recent earnings report and briefly made a new all-time high on volume over 2x the average. Since then it has moved in a fairly orderly fashion between $96 and $99.
This has allowed the 8-day to catch up to the price, which could provide support for another move higher.
The Bollinger Bands are opening up higher and RSI is in the bullish zone.
Possible trades:
Buy now with a stop beneath the recent range
Buy on a move above the recent range with a similar stop
Whatever happens, make sure you stay focused on proper position sizing and risk management.
I’d love to know what you think. Would you like to see more posts like this? If so, please share this one, send me an email, and/or leave a comment below.
***This is NOT financial advice. NOT a recommendation to buy, sell, or trade any security. The content presented here is intended for educational purposes only.
Andrew Moss is an associated member of T3 Trading Group, LLC (“T3TG”) a SEC registered broker/dealer and member of FINRA/SIPC. All trades placed by Mr. Moss are done through T3TG.
Statements in this article represent the opinions of that person only and do not necessarily reflect the opinions of T3TG or any other person associated with T3TG.
It is possible that Mr. Moss may hold an investment position (or may be contemplating holding an investment position) that is inconsistent with the information provided or the opinion being expressed. This may reflect the financial or other circumstances of the individual or it may reflect some other consideration. Readers of this article should take this into account when evaluating the information provided or the opinions being expressed.
All investments are subject to risk of loss, which you should consider in making any investment decisions. Readers of this article should consult with their financial advisors, attorneys, accountants or other qualified investors prior to making any investment decision.
POSITION DISCLOSURE
Long: COIN1118P45, QQQ1118P280, QQQ1125P290, SPY1118P390, SPY1125P400
Short: COIN1118P40, QQQ1118P265, QQQ1125P280, SPY11189375, SPY1125P390
Options symbols are denoted as follows:
Ticker, Date, Call/Put, Strike Price
Example: VXX1218C30 = VXX 12/18 Call with a $30 strike


