

Waves and Cycles
Midweek Market Update December 7, 2022

Everything comes in waves
Markets, moods, culture, and fashion all move in waves or cycles. Things are always changing and the outcomes vary immensely. But the changes often occur in patterns.
“History doesn't repeat, but it does rhyme.”
-Seth Klarman
This phenomenon occurs on multiple timelines as well.
Short Cycles
The short-term cycle has been; wait, move, wait, move.
Last week the stock market did mostly nothing, waiting until Jerome Powell made comments that ignited prices and sent them moving higher.
This week feels like waiting again. Prices are down, last week’s rally has been mostly erased and there is a persistent lull signaling the market’s unwillingness to move until a suitable catalyst emerges.
Waiting
The Federal Reserve has been under a “blackout period” and the release of economic data has slowed down. This will soon change.
Moving
Inflation data in the form of the Producer Price Index (PPI) will be announced this Friday, December 9, and Consumer Price Index (CPI) numbers will come out on Tuesday.
Waiting will soon give way to moving.
The Charts
SPY - Hasn’t failed, but hasn’t yet passed the 3-part test
Downtrend line
200-day moving average
All-time high anchored VWAP
QQQ - Couldn’t see the breakout through. But so far hasn’t broken support either.
IWM - The most vulnerable of the three, failed to break through resistance and is now below near-term support.
DXY - The US Dollar rallied a bit. But so far it’s staying below recent support/resistance, which means the downtrend is still in place.
VIX - Volatility jumped from foreseeable levels and so far is slowing down the same way.
Long Cycles
Oil and oil-related stocks have been the “go-to” bullish trade for many this year. However, since the price of a barrel of oil peaked in June, this chart has taken a different character.
This looks like an important spot for oil. Will it find support here at the September pivot low and 38.2% fibonacci retracement? Or is headed lower?
USO
Lower looks like the higher probability move. What’s really interesting though is the bigger picture business cycle implications.
Fellow chartist David Yocum mentioned this chart to me recently and got thinking back on my Chartered Market Technician (CMT) studies and test preparation.
Intermarket analysis was a big part of those studies and this chart was often cited. It is generally thought that the longer-term market cycles of these asset classes move and progress in this order.
Graph courtesy of the-intermarket.com
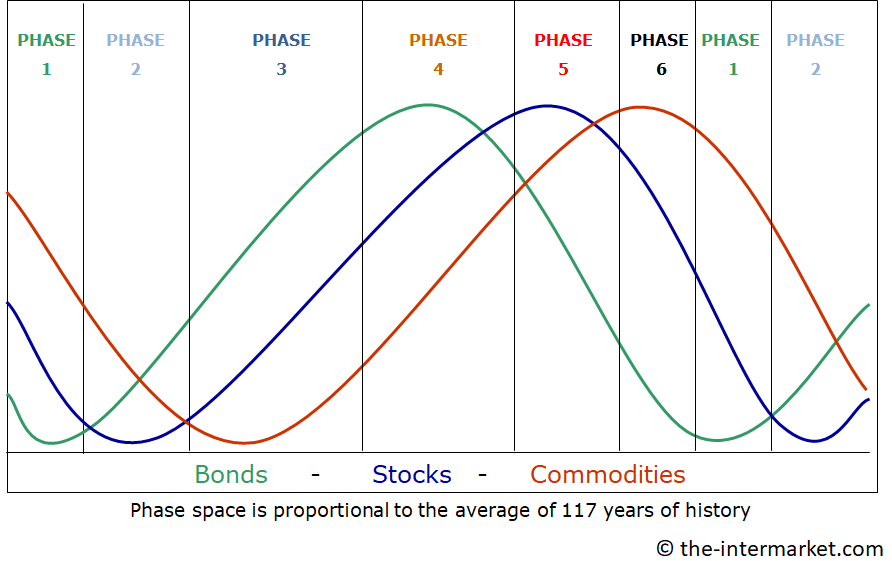
Relating that to current prices looks like this. It’s not as neat, but we can clearly see bonds turning down first, followed by stocks, and lastly commodities.
SPY - stocks - black line
LQD - bonds - orange line
GSG - commodities - aqua line

Now bonds and stocks trying to turn back up. Of course, we don’t yet know if this upturn will survive and continue. And we’re not seeing that move from commodities yet.
But if we do,
wouldn’t that suggest that this cycle relationship is playing out as expected?
And wouldn’t that in turn suggest continued upside for stocks and bonds?
What do you think?
***This is NOT financial advice. NOT a recommendation to buy, sell, or trade any security. The content presented here is intended for educational purposes only.
Andrew Moss is an associated member of T3 Trading Group, LLC (“T3TG”) a SEC registered broker/dealer and member of FINRA/SIPC. All trades placed by Mr. Moss are done through T3TG.
Statements in this article represent the opinions of that person only and do not necessarily reflect the opinions of T3TG or any other person associated with T3TG.
It is possible that Mr. Moss may hold an investment position (or may be contemplating holding an investment position) that is inconsistent with the information provided or the opinion being expressed. This may reflect the financial or other circumstances of the individual or it may reflect some other consideration. Readers of this article should take this into account when evaluating the information provided or the opinions being expressed.
All investments are subject to risk of loss, which you should consider in making any investment decisions. Readers of this article should consult with their financial advisors, attorneys, accountants or other qualified investors prior to making any investment decision.
POSITION DISCLOSURE
December 7, 2022 4:15 PM
Long: MSOS, QQQ
Short: none
Options symbols are denoted as follows:
Ticker, Date, Call/Put, Strike Price
Example: VXX1218C30 = VXX 12/18 Call with a $30 strike