Weekend Market Review
December 2, 2022
The week at a glance;
Drifting lower
JPow speaks - Market UP!!!
Rest day
Hot Jobs # - Market DOWN!!!!
Then......recovery
The markets
After a seemingly slow start to the week, afternoon comments on Wednesday lead to markets rocketing higher as Jerome Powell indicated that maybe the Federal Reserve would chill out a bit.
Thursday things took a rest.
Friday during the pre-market session prices tanked on a hot employment number and the rally suddenly looked very questionable.
Then?
We rallied all day.
Markets are crazy.
The Charts
$SPY - Three consecutive closes above the 200-day MA. The downtrend line provided some resistance. No surprise.
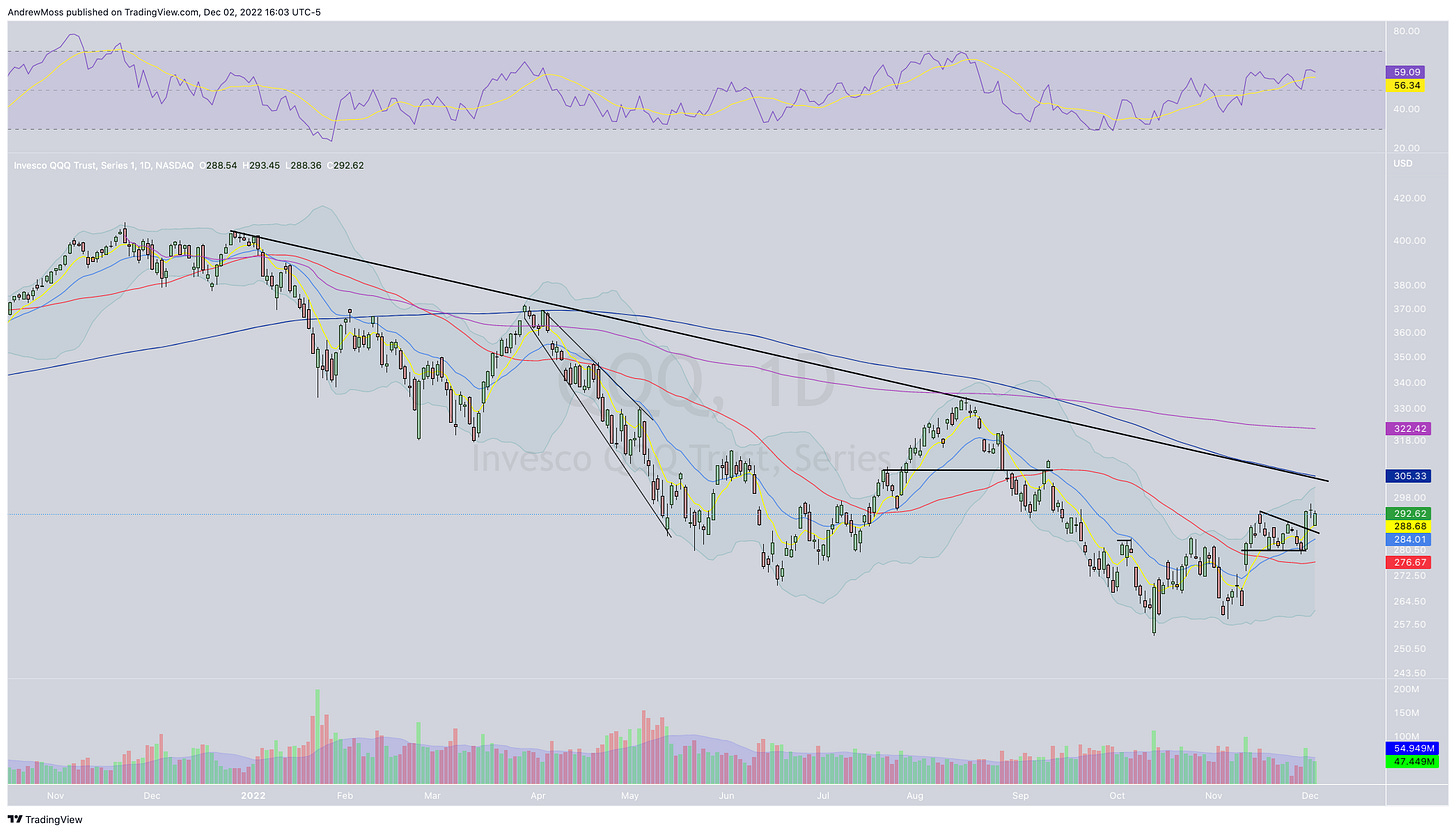
$QQQ - held the 8-day at the open and rose steadily all day.
$IWM - opened below the 8-day and 200-day but rallied to finish strongly above both.
$DXY - moved below this support zone and still pointed toward the 50% Fibonacci retracement. Can it get there? Can it do by year-end? It's possible.
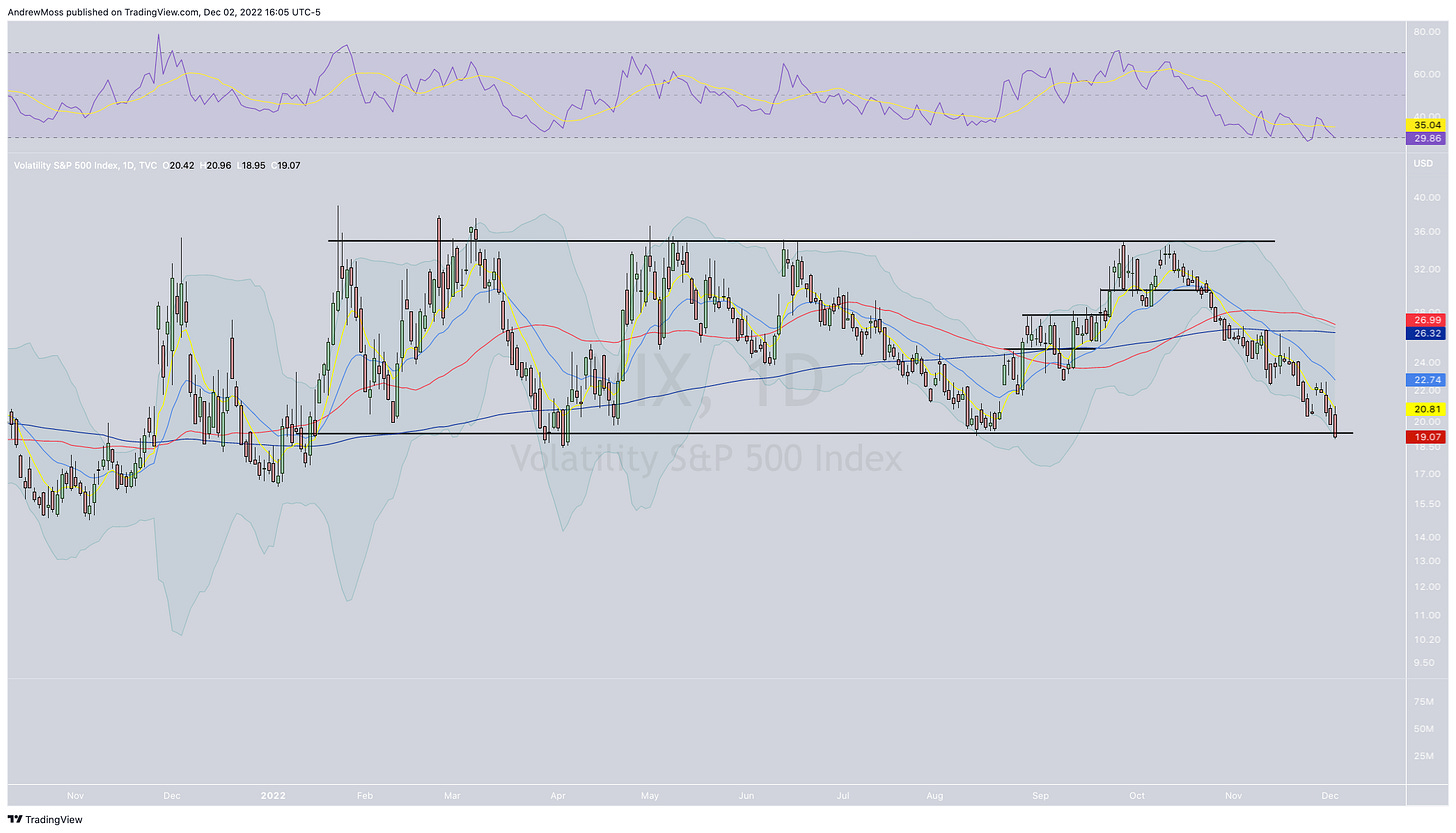
$VIX - Below 20 and back to the lower end of the range.
Bull and bear case
The bull case we've been eyeing is playing out nicely. Continue to watch the overhead resistance areas; price congestion, moving average, anchored VWAPs, trendlines, etc.
The bear case in the near term is largely an economic surprise.
A sudden shift in Fed policy
An interest rate shock
Other data that comes in outside of expectations
Any of these will continue to rattle markets and likely produce a selloff. The question remains, How big would the surprise need be to overwhelm buyers and send prices sustainably lower?
The good news? The Federal Reserve is on a “blackout period” from December 3rd through December 15th.
What I'm reading and listening to
AI (artificial intelligence) is wild! Admittedly, I’ve done almost no serious thinking or exploration of the topic. But I know it’s here. I know it will have profound implications. And I know it’s not all scary, sci-fi, dystopian lore. There will be tremendous leaps in human progress with the help of AI.
Jim O’Shaughnessy and Liberty dig into a fascinating conversation here.
From Twitter
It’s important to step back on a regular basis. Looking at charts on multiple timeframes is a great way to do that. That’s why I make it point to share weekly charts every Saturday.
At month-end, we can see an even bigger view.
Get the Big Picture with monthly charts.
Anything else?
World Cup Update
Tomorrow morning (Saturday) we have USA vs Netherlands. This soccer match will likely be one of the most viewed in history. Go USA! 🇺🇸
The comparison chart shows recent strength in the markets pointing to the Netherlands. But, is there a turnaround in the offing? There is some potential support close at hand.
EUSA/EWN
We’ll see.
For now- Thanks for reading, subscribing and sharing with your friends and family.
Join me in the morning for weekly charts and World Cup.
***This is NOT financial advice. NOT a recommendation to buy, sell, or trade any security. The content presented here is intended for educational purposes only.
Andrew Moss is an associated member of T3 Trading Group, LLC (“T3TG”) a SEC registered broker/dealer and member of FINRA/SIPC. All trades placed by Mr. Moss are done through T3TG.
Statements in this article represent the opinions of that person only and do not necessarily reflect the opinions of T3TG or any other person associated with T3TG.
It is possible that Mr. Moss may hold an investment position (or may be contemplating holding an investment position) that is inconsistent with the information provided or the opinion being expressed. This may reflect the financial or other circumstances of the individual or it may reflect some other consideration. Readers of this article should take this into account when evaluating the information provided or the opinions being expressed.
All investments are subject to risk of loss, which you should consider in making any investment decisions. Readers of this article should consult with their financial advisors, attorneys, accountants or other qualified investors prior to making any investment decision.
POSITION DISCLOSURE
December 2, 2022 4:15 PM
Long: DIA1209C350, IWM, MSOS, NUE, PYPL1216C90, QQQ, SI1216P25
Short: SI1216P20
Options symbols are denoted as follows:
Ticker, Date, Call/Put, Strike Price
Example: VXX1218C30 = VXX 12/18 Call with a $30 strike


