

Weekend Market Review - November 4, 2022
Choppiness and indecision

Welcome to the weekend.
It’s been a busy week with lots of new readers and subscribers. Thank you for that!
And thanks to all of you that have shared this page either by forwarding an email or by linking an article in your Twitter feed. I really appreciate it.
If you’re a first-time reader and haven’t already, take a minute to subscribe now.
The Best October ever!
Followed by a rocky November start
No doubt you've seen the headlines and performance figures by now. The SP500 moved over 11% from low to high during the month.
It really was a powerful rally, though it didn't come in a straight line as new lows for this year and this bear market was established on the 13th of the month.
Still, October 2022 will surely be featured in the glossy printed "Missing the best days" marketing pieces of the future. You know, the same ones that fail to mention that the "the best days" almost always happen during a bear market. Or the counterpoint of the advantages of also missing “the worst days.”
They're also usually devoid of any discussion on risk management or sell strategies. More on that in a moment.
In the meantime, rallies are nice, and there are some bright spots emerging even as November has a rough start.
The price action before the Fed and economic data this week was much improved but fizzled quickly. This pullback wasn’t unexpected and could end up being a welcomed buying opportunity.
Choppiness and indecision.
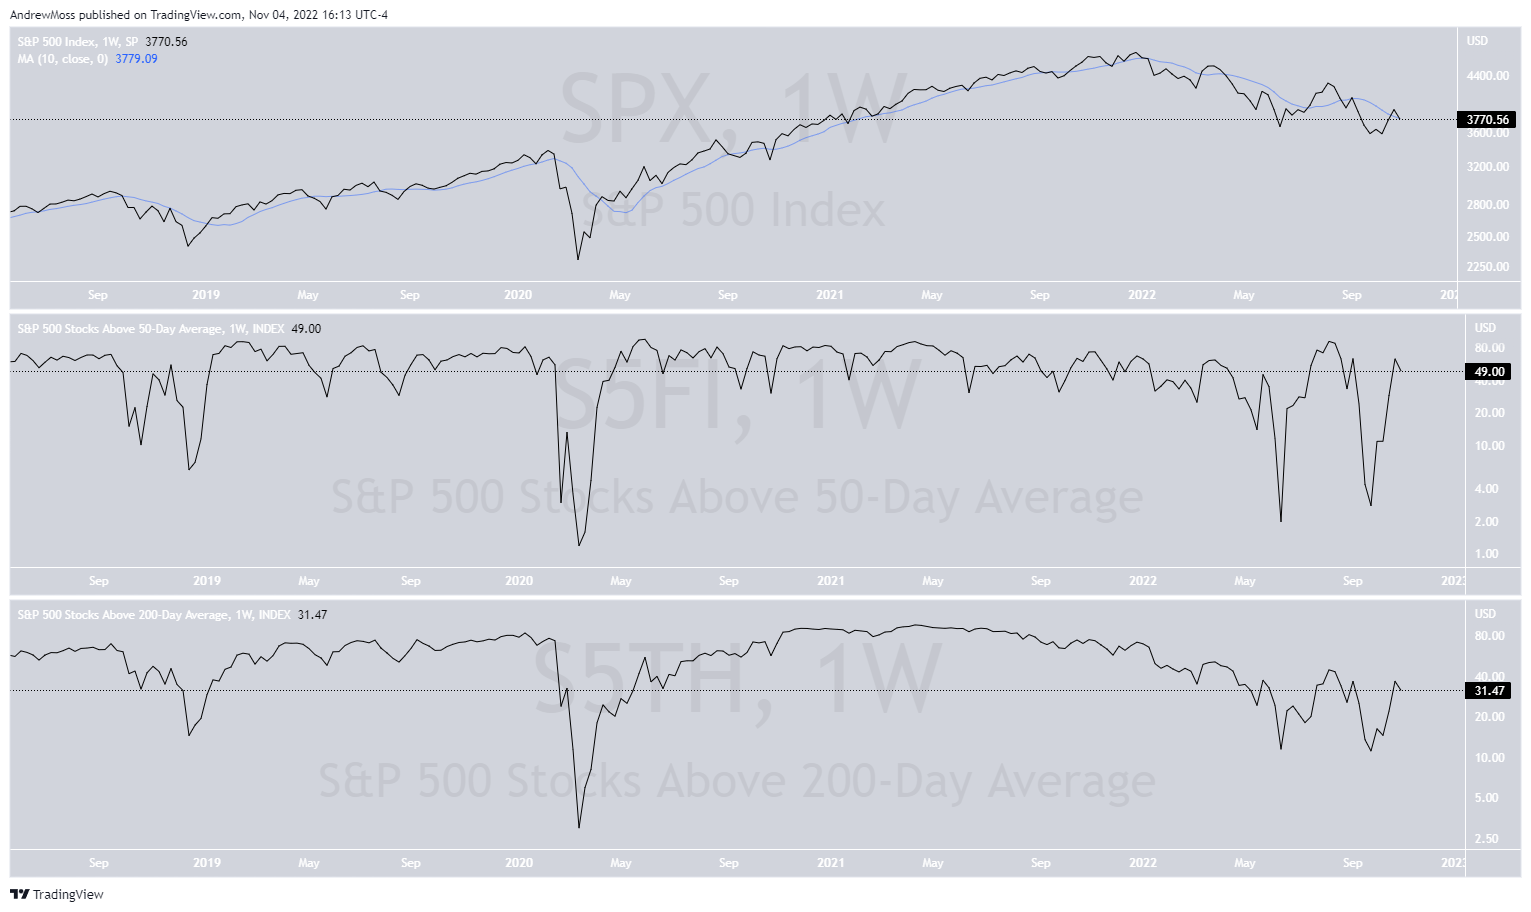
For the major indexes, it’s still a bear market.
They are below the 200-day moving averages
Fed, CPI, or employment data continues to drive stocks lower
Mega-caps/FAANG names are getting killed. Most made new lows this week.
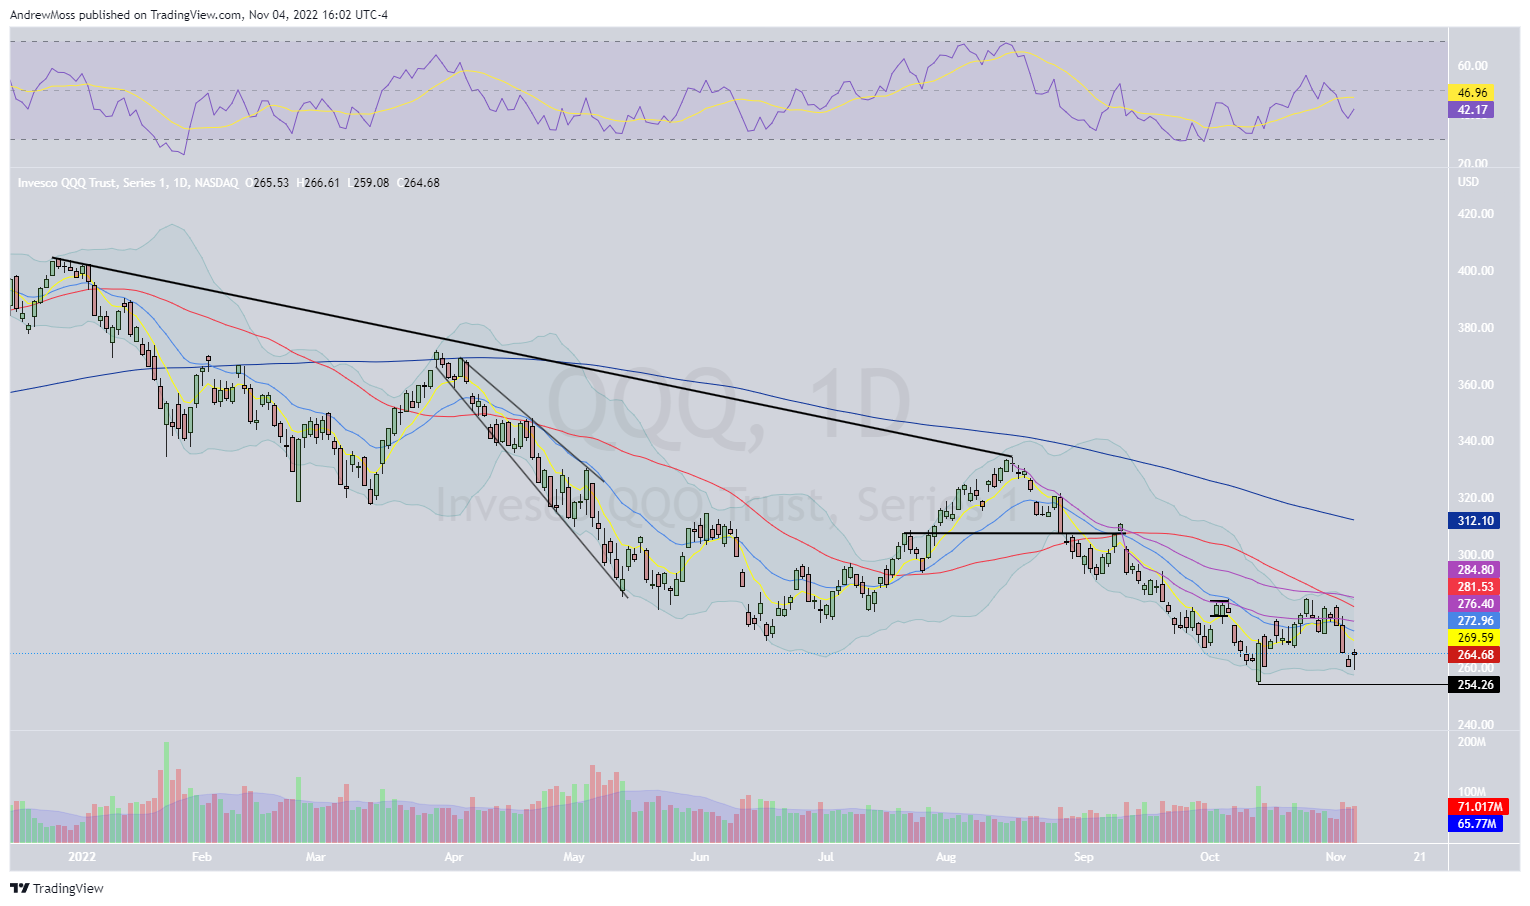
$QQQ is the worst of the major indexes
Is this indicative of more pain to come?
Or is this a product of money rotation and the end of big-tech market leadership?
Breakouts are failing
On the other side, there are some bright spots:
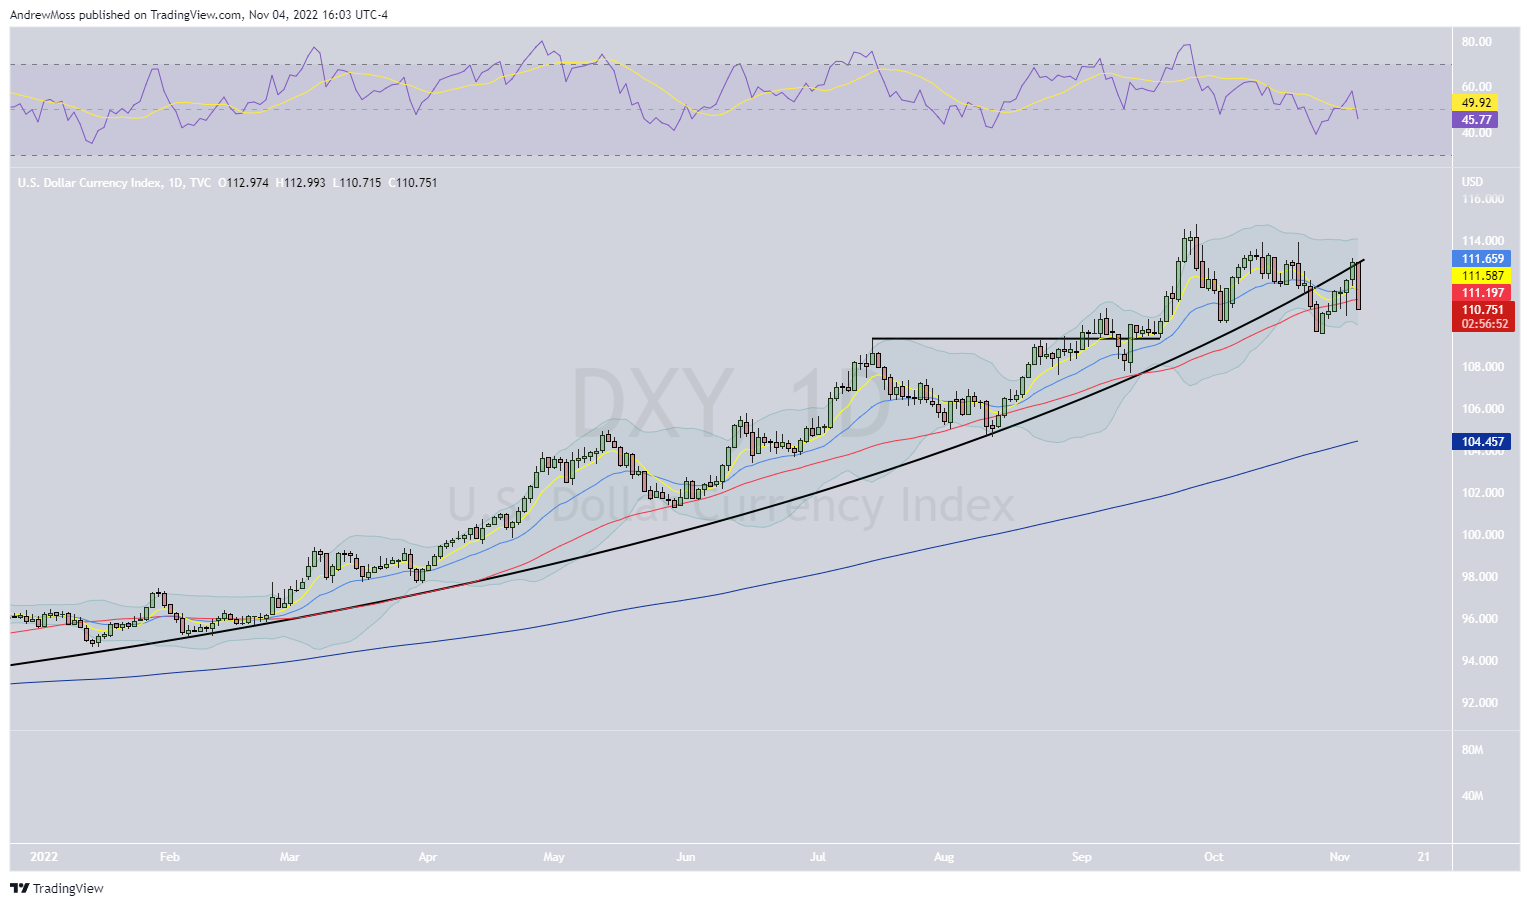
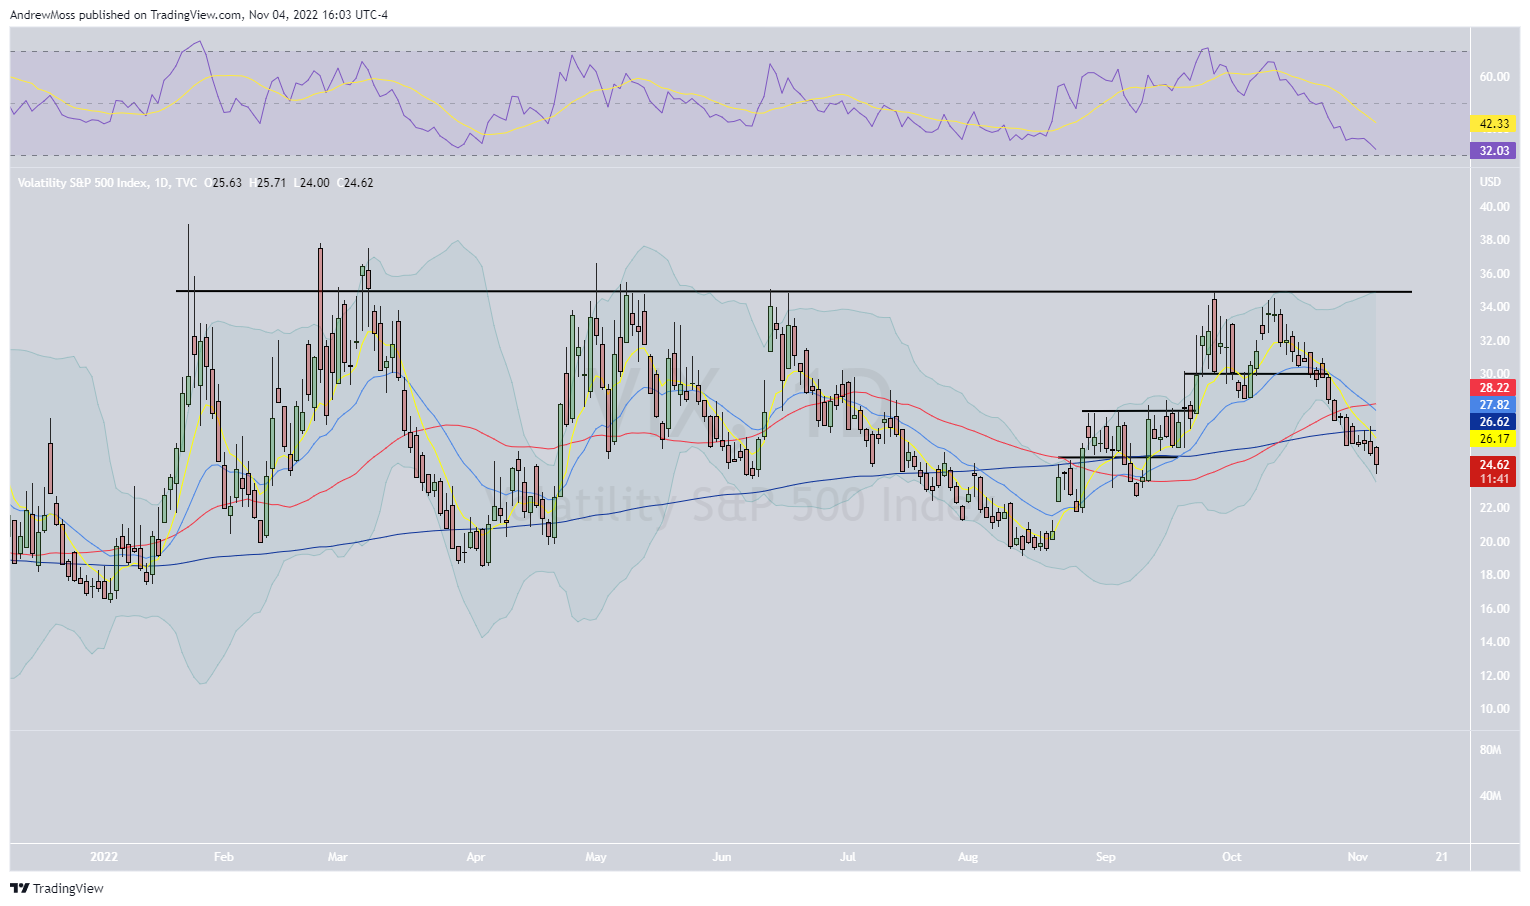
$DXY and $VIX continue to fall reducing some of the headwinds.
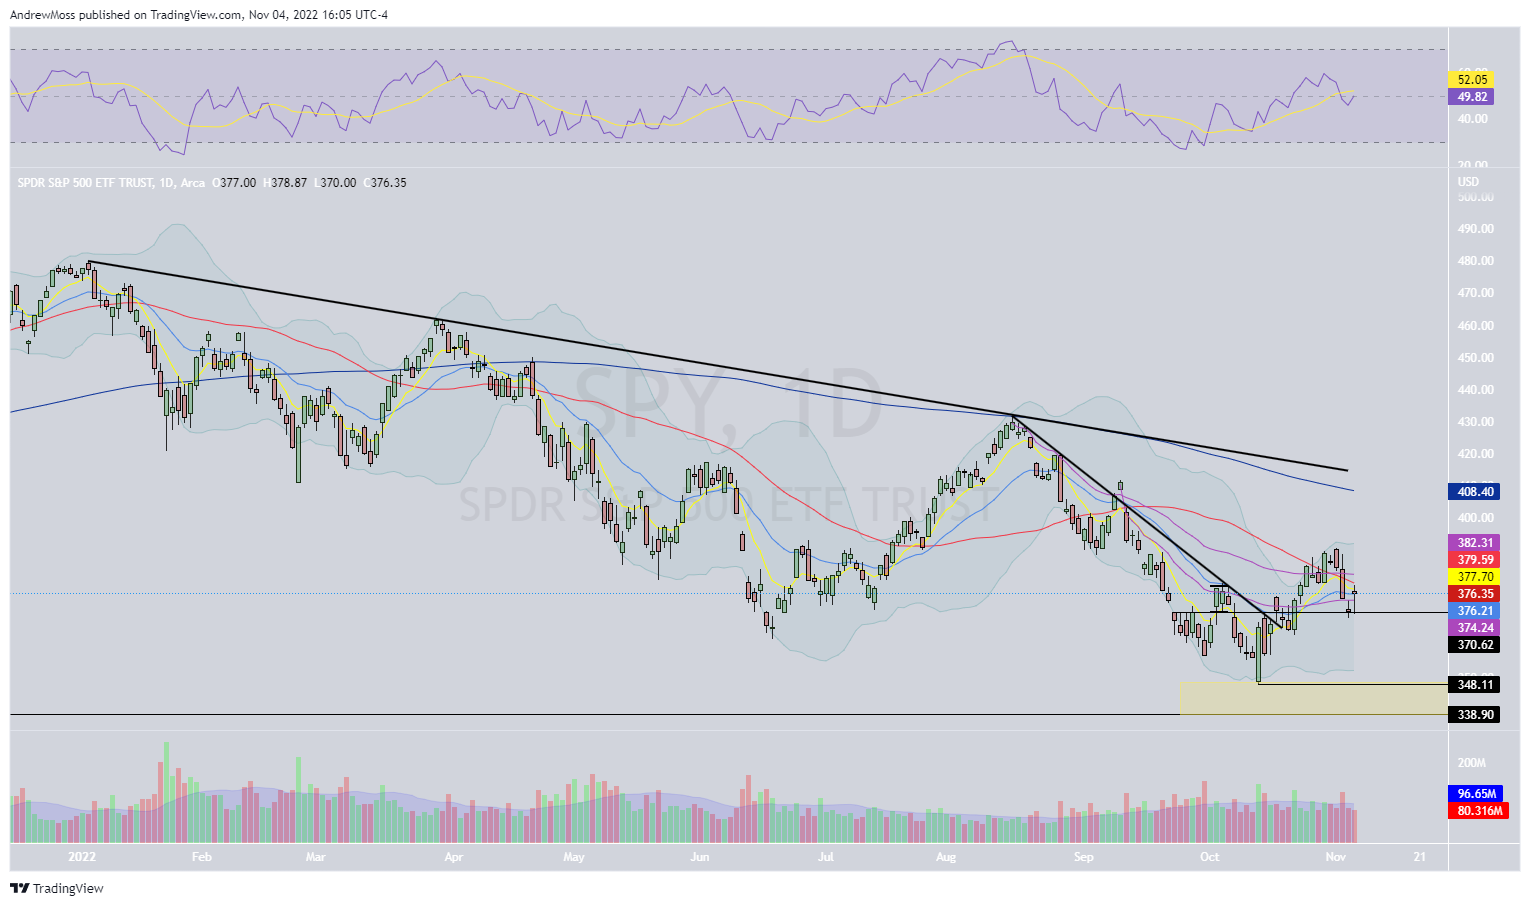
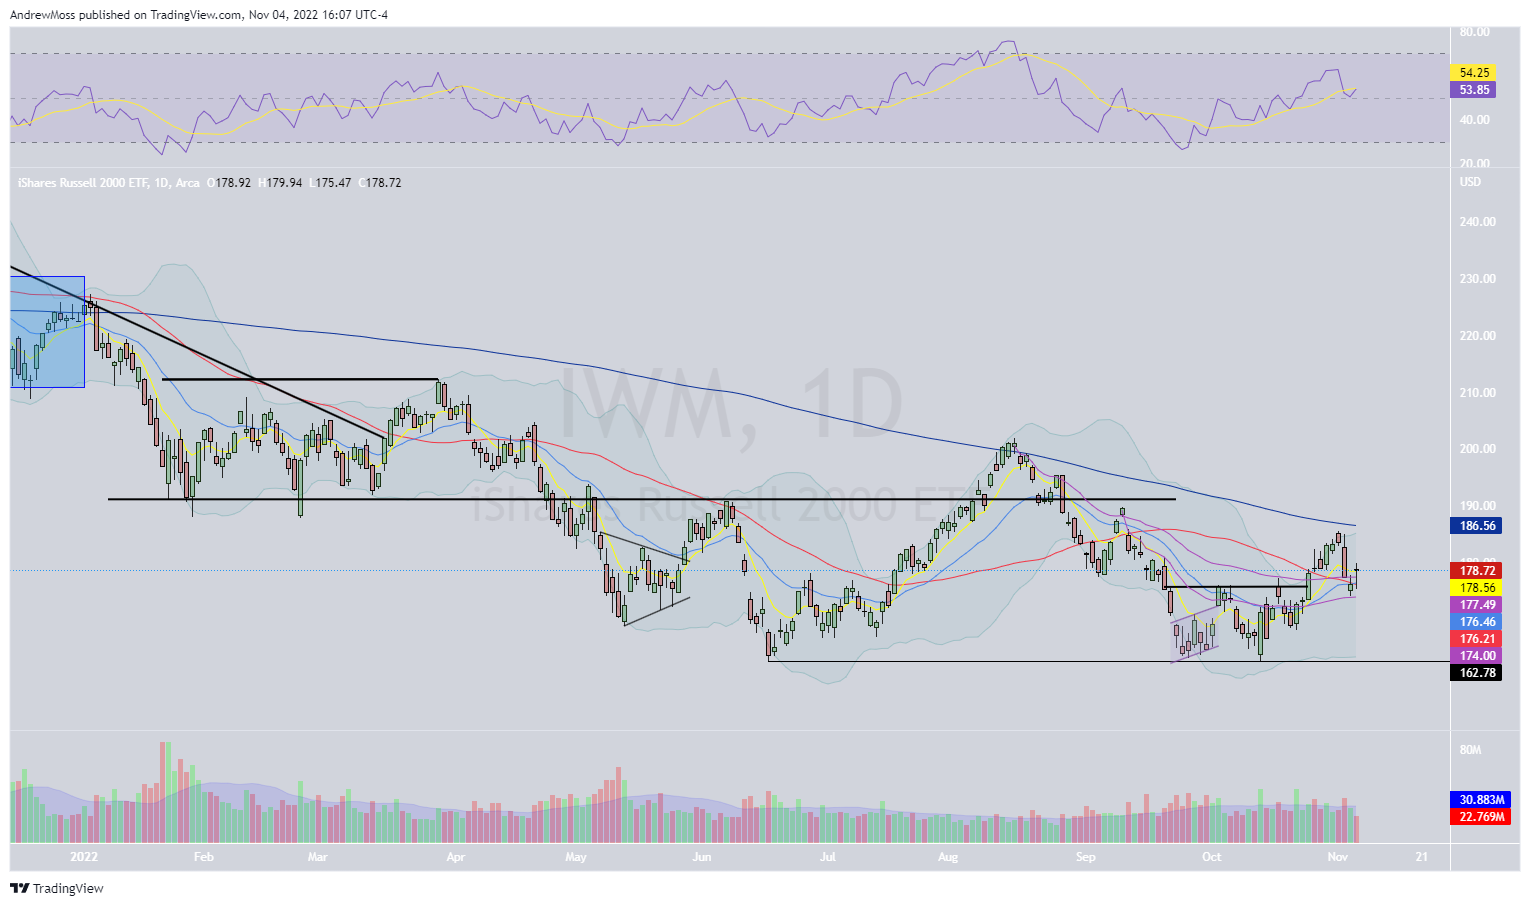
$DIA $SPY $IWM still look better than a month ago and still have a chance to make a higher low.
If that can be followed by a higher high we'll have further evidence that the trend is changing.
The number of $SPX stocks over the 50/200 day MA has risen.
Some of those charts look very good.
But many of those same charts are the ones with the failed breakouts. Again, guilty until proven innocent.
Bull and bear case
This choppy action can be extremely tiresome. There is nothing wrong with waiting until things shape up better. Exposure can be added incrementally. It doesn’t have to be “all or nothing.”
If doing so, have a plan. Make sure you’ve answered the question, “what will it take to get more involved?
The bull case:
$SPY and $IWM need to pivot up here and prove this to be a higher low. Then they need to move on above the September 12 pivot high and through the 200-day moving average. Each of those achievements would get me more actively long.
As for $QQQ, a resumption of strength in big tech would likely drive the overall market higher. That would be a major shift from this point and seems very unlikely given the interest rate situation.
In the meantime, there's nothing wrong with focusing on individual names and buying stocks that are:
Above the key moving averages
Showing relative strength vs. the market, other sectors, and their peers
Purchased with a very strict and well-defined risk management plan.
Use caution. With so many headwinds it’s prudent to assume that new positions will fail. And that means trading plans need to allow for:
fewer positions
smaller size in those positions
being more aggressive in taking profit/reducing risk
closely monitoring overall exposure
The bear case:
If Thursday's lows don't hold it’s more likely that we revisit the October, or yearly lows. Many former leading stocks are already doing that.
The charts
$SPY Fighting back to close the day between the 8 and 21-day EMAs
$QQQ Lots of work to do here
$IWM The afternoon rally closed this above the 8 and 21-day EMAs. Hanging in there.
$DXY - solid retest and now resuming the move lower. That's what we want to see. It looks like a lower high. Now we need to get a lower low for confirmation.
$VIX Continues to fall, although it doesn’t feel like it’s helping stocks this week. Interesting.
Be sure to visit me on Twitter tomorrow (Saturday) morning for a look at the weekly charts where I’ll go over the bigger picture, macro view. I’ll also have a look at some individual names, and some of those failed breakouts mentioned above.
What I'm reading and listening to
This is an absolute gem from two of my favorite thinkers/writers/podcasters/investors. Howard and Jim talk about so many interesting things including:
The genesis of the Federal Reserve
The Crash of '87
GFC bailouts - who didn’t get them, and why
Opportunities on the other side of this bear market
From Twitter
First, say hello to the new mayor as Elon Musk completes his takeover of the company.
This account is aptly named. Big wave surfing fascinates and astonishes me.
It looks like certain death, no?
In addition to the 200-day moving average, the DJIA found resistance at the point-and-figure chart bearish resistance line as well.

This will be the first book I read in 2023

An incredibly underrated skill
Anything else?
That's all for now. Thanks always for reading, subscribing, and sharing with your friends and family.
I hope you have a fantastic weekend.
Cheers.
***This is NOT financial advice. NOT a recommendation to buy, sell, or trade any security. The content presented here is intended for educational purposes only.
Andrew Moss is an associated member of T3 Trading Group, LLC (“T3TG”) a SEC registered broker/dealer and member of FINRA/SIPC. All trades placed by Mr. Moss are done through T3TG.
Statements in this article represent the opinions of that person only and do not necessarily reflect the opinions of T3TG or any other person associated with T3TG.
It is possible that Mr. Moss may hold an investment position (or may be contemplating holding an investment position) that is inconsistent with the information provided or the opinion being expressed. This may reflect the financial or other circumstances of the individual or it may reflect some other consideration. Readers of this article should take this into account when evaluating the information provided or the opinions being expressed.
All investments are subject to risk of loss, which you should consider in making any investment decisions. Readers of this article should consult with their financial advisors, attorneys, accountants or other qualified investors prior to making any investment decision.
POSITION DISCLOSURE
Long: DRI, KMI, MCK
Short:
Options symbols are denoted as follows:
Ticker, Date, Call/Put, Strike Price
Example: VXX1218C30 = VXX 12/18 Call with a $30 strike