📈Weekly Charts📉 July 13, 2025
What the charts are telling us heading into a busy earnings week.
Good morning!
After a stretch of quiet strength, we’re seeing some big moves again.
Bitcoin breaks out. Ethereum surges. Risk-on sectors rotate back into leadership.
Meanwhile, major equity indexes hold near their highs—even as breadth indicators take a breather.
Let’s dig into this week’s charts…
₿ Crypto
Bitcoin (BTC)
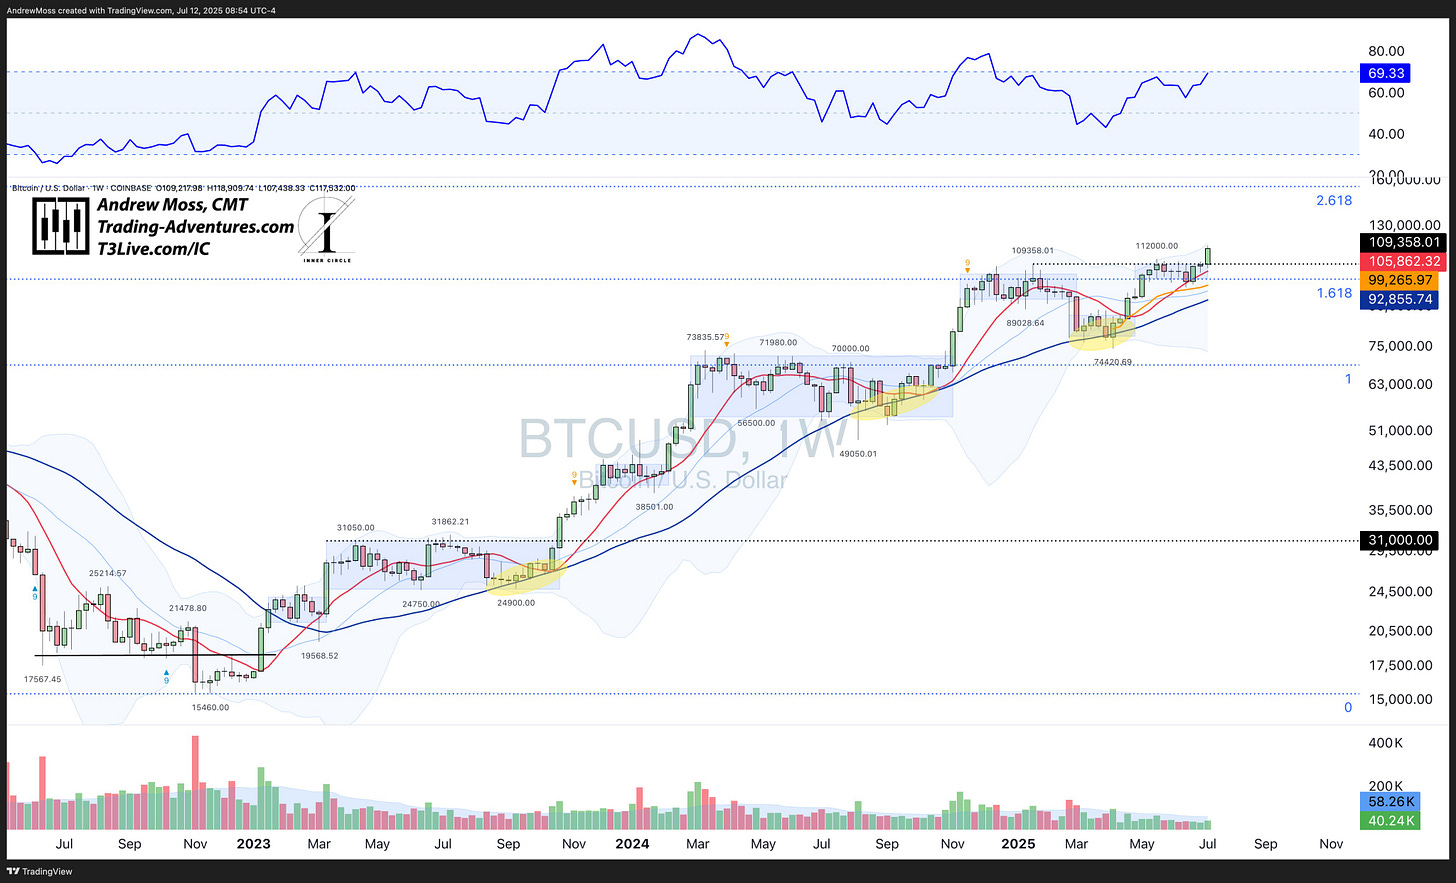
After 9 weeks in the ~$100K–$110K consolidation box, Bitcoin has broken out to new highs near $119K.
The next major target is the 2.618 extension level near $155K.
Will it run straight to that level like the move last November? Or build another base along the way, like we saw in December/January?
Ethereum (ETH)
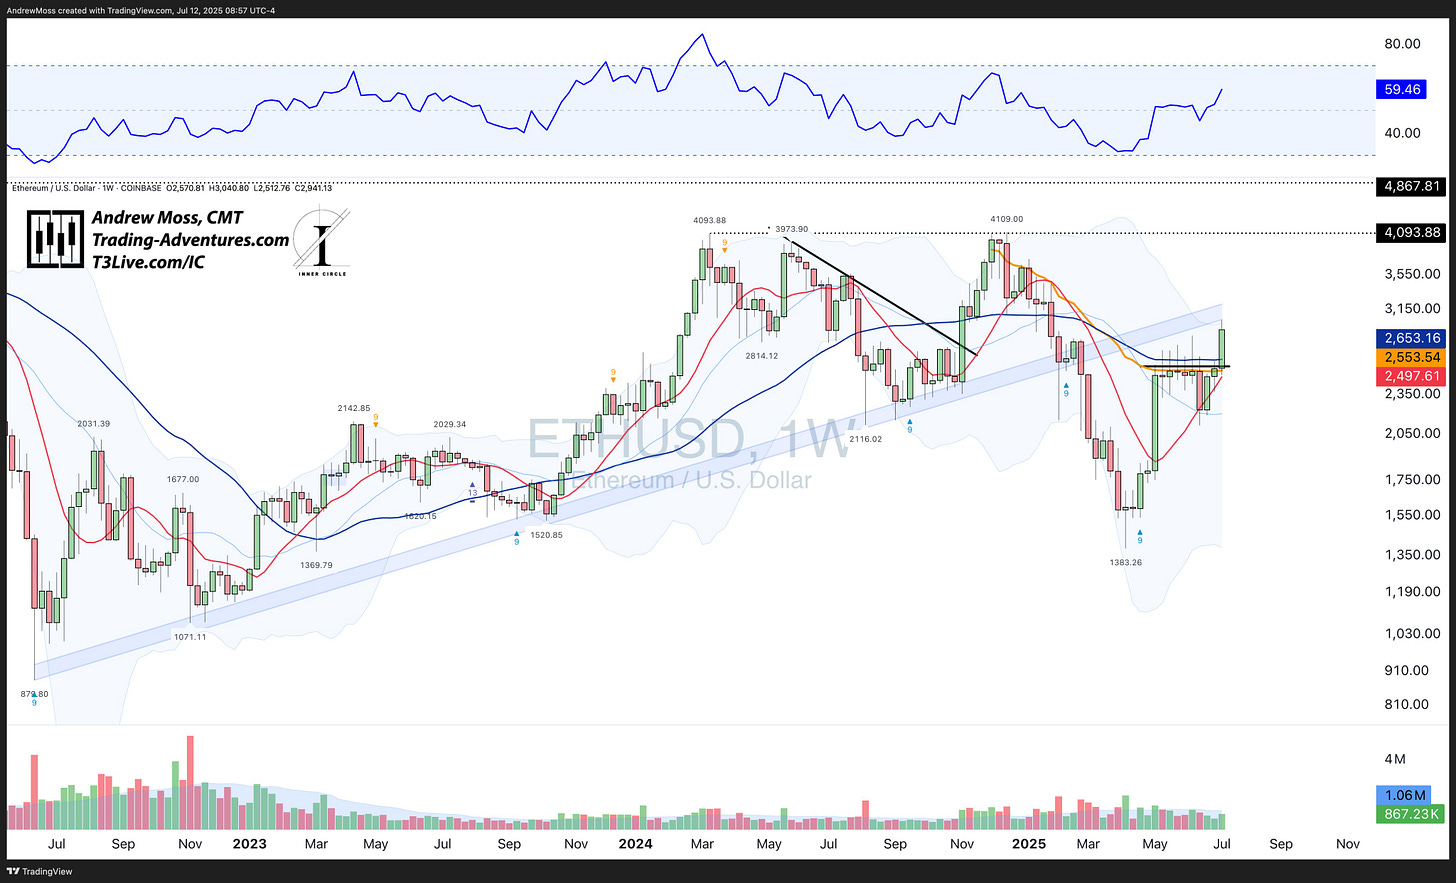
Ethereum also turned heads this week, with a strong breakout featured in Inner Circle trades via ETHA and call options.
The breakout cleared the flat 40-week MA and the AVWAP from 2025 highs. Now it’s testing a descending trendline from below and facing initial resistance in the 3000–3200 zone. This is the area to watch.
📊 Major Indices
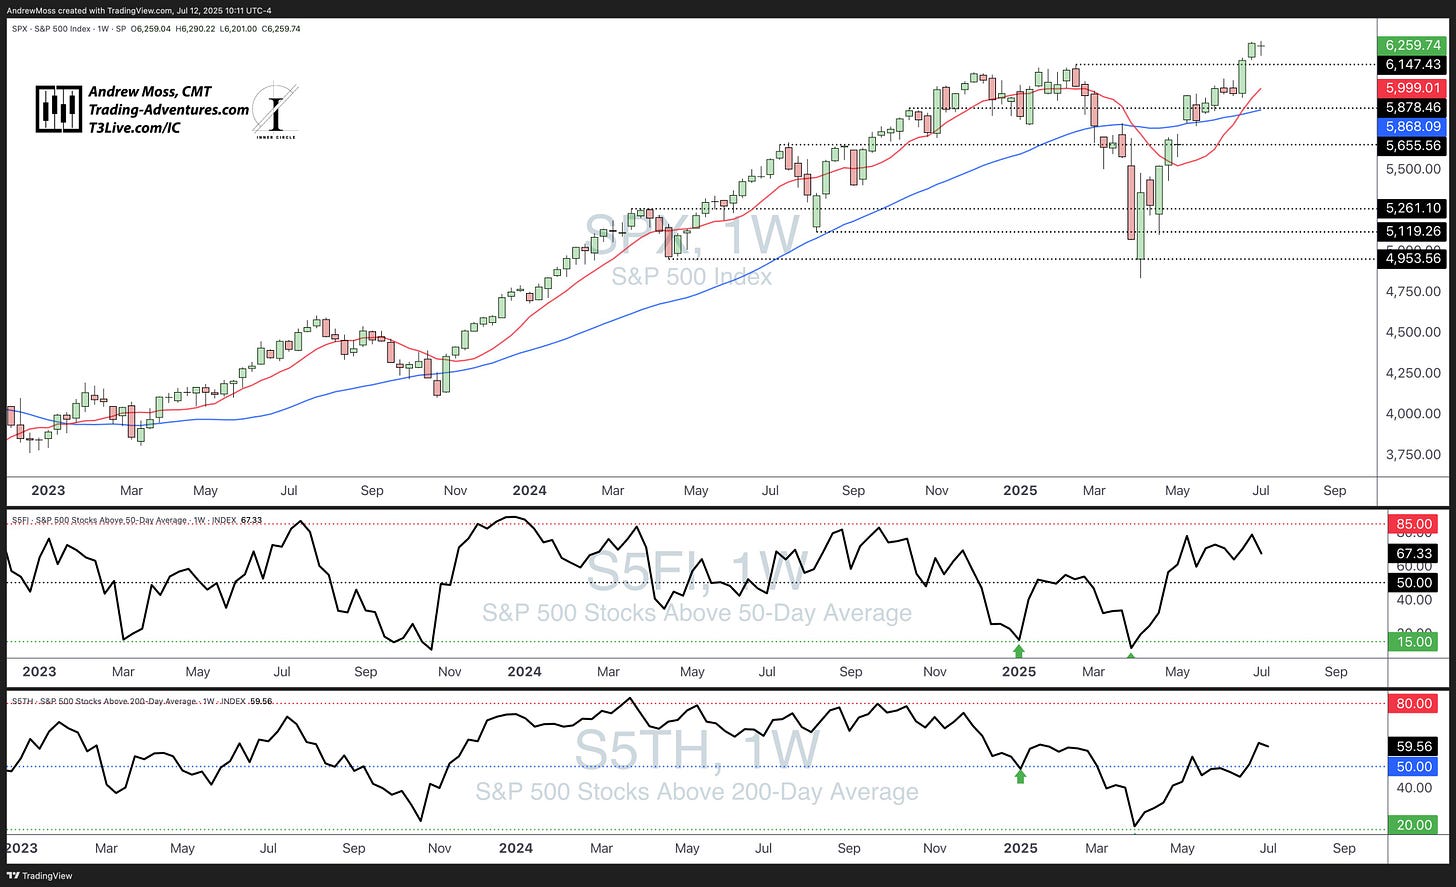
S&P 500 (SPX)
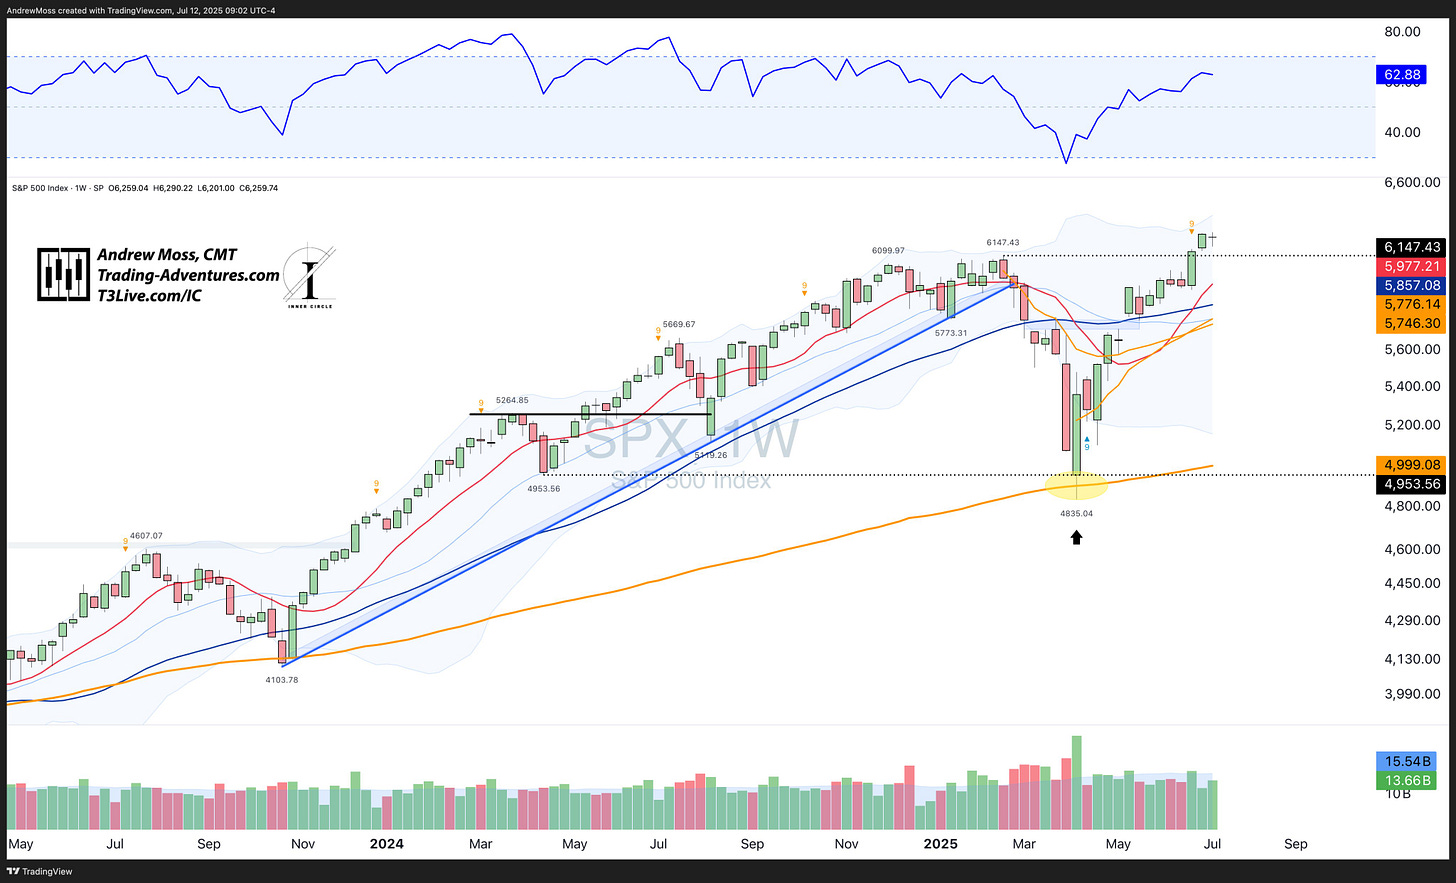
SPX spent the week in high-level consolidation, maintaining the breakout from the previous week.
RSI remains strong but not overbought
Volume was a bit light—typical for summer
Price stayed just under the upper Bollinger Band, not yet pushing into extension
NASDAQ 100 (QQQ)
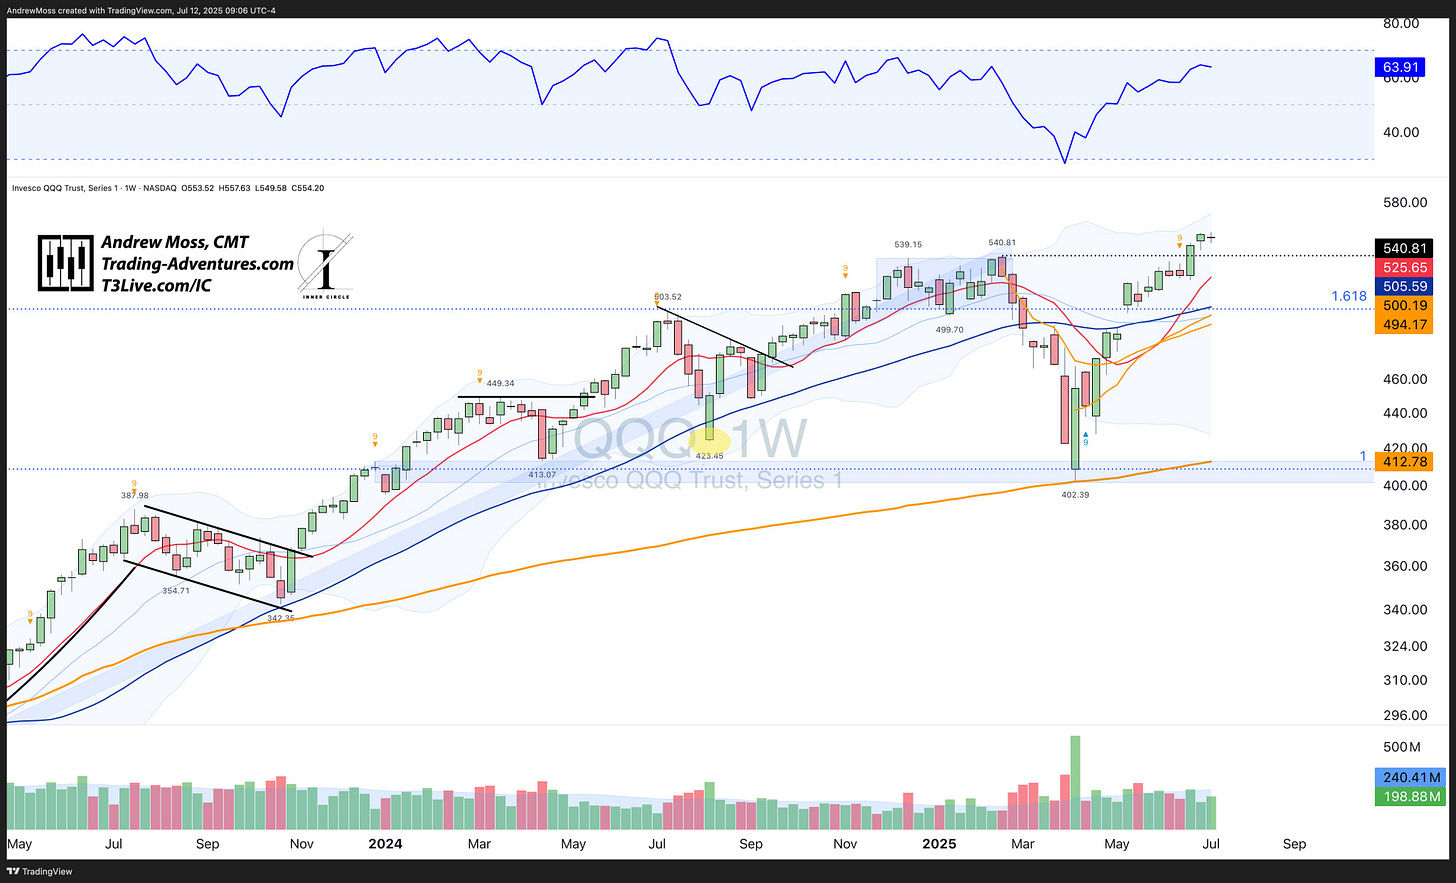
A nearly identical chart to SPX.
Tech continues to lead, with no significant divergence between the two major indexes.
Russell 2000 (IWM)
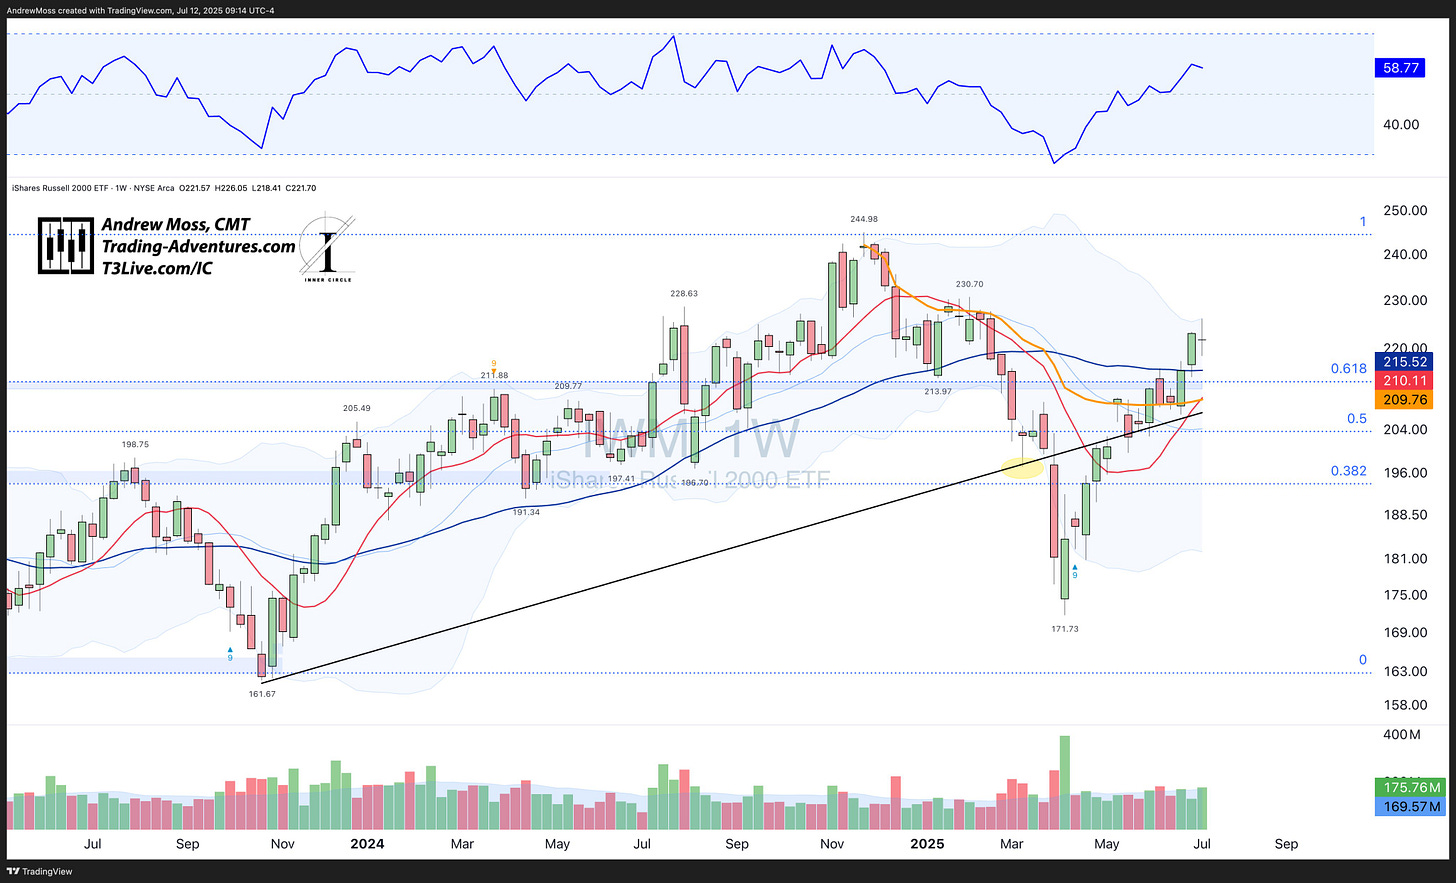
IWM briefly poked above recent highs before closing slightly lower on the week.
Volume was slightly above average
RSI is strong and building, now nearing 59
Support levels to watch:
🟢 204–215 is a huge support cluster:
40-week MA
211–213 pivot area
10-week MA
Pivot high AVWAP
Rising trendline
50% and 61.8% retracement levels
🟠 It would be ideal for IWM to hold above $215—but small caps rarely deliver “clean” price action.
Dow Jones (DIA)
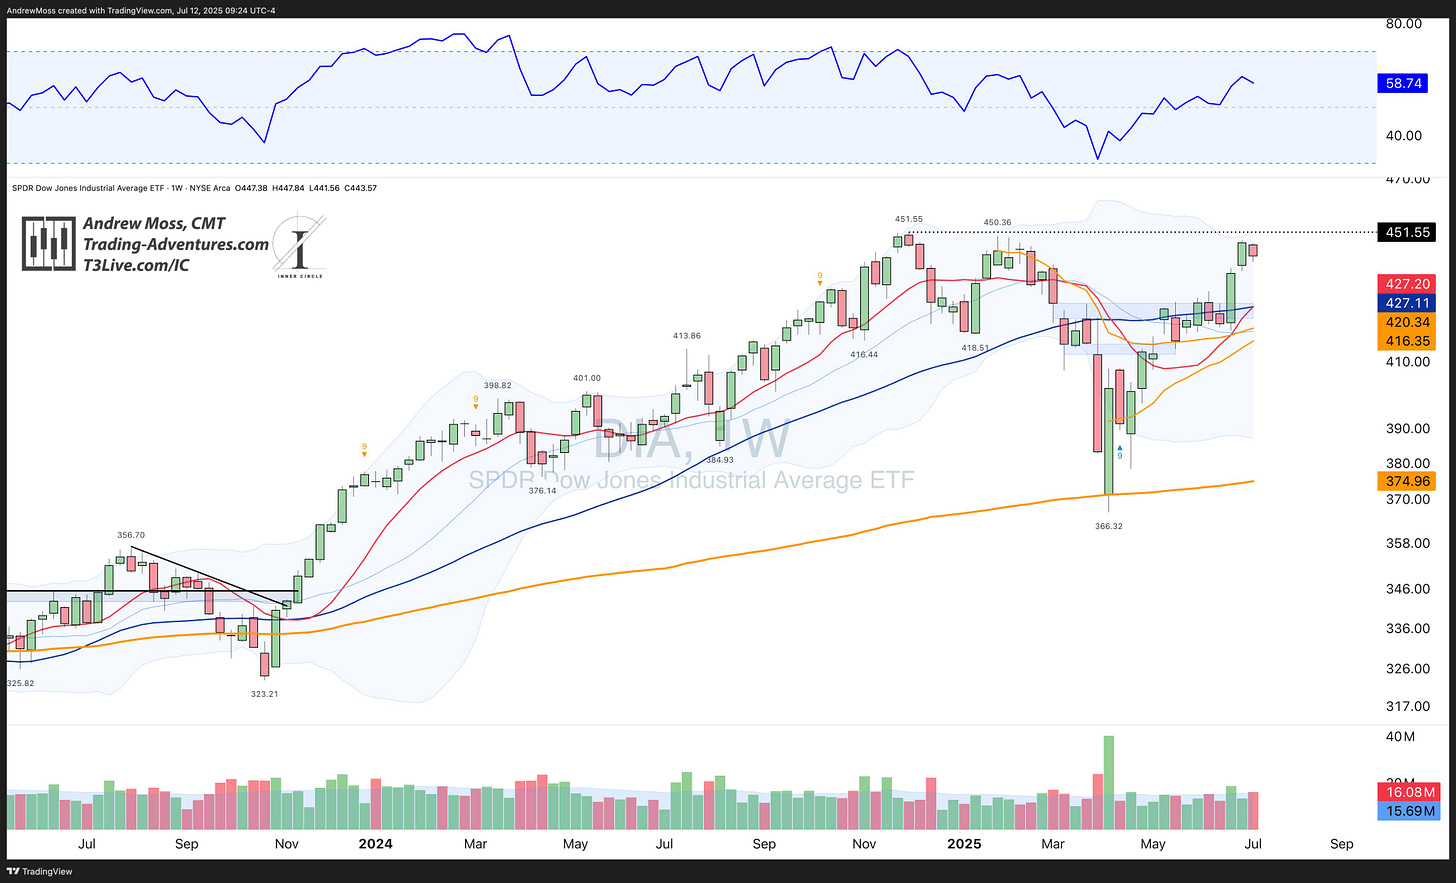
An inside week after last week’s strong breakout.
This is healthy consolidation just below the pivot highs—a bullish setup.
🌏 Global Stocks & Macro
Global ex-US (ACWX)
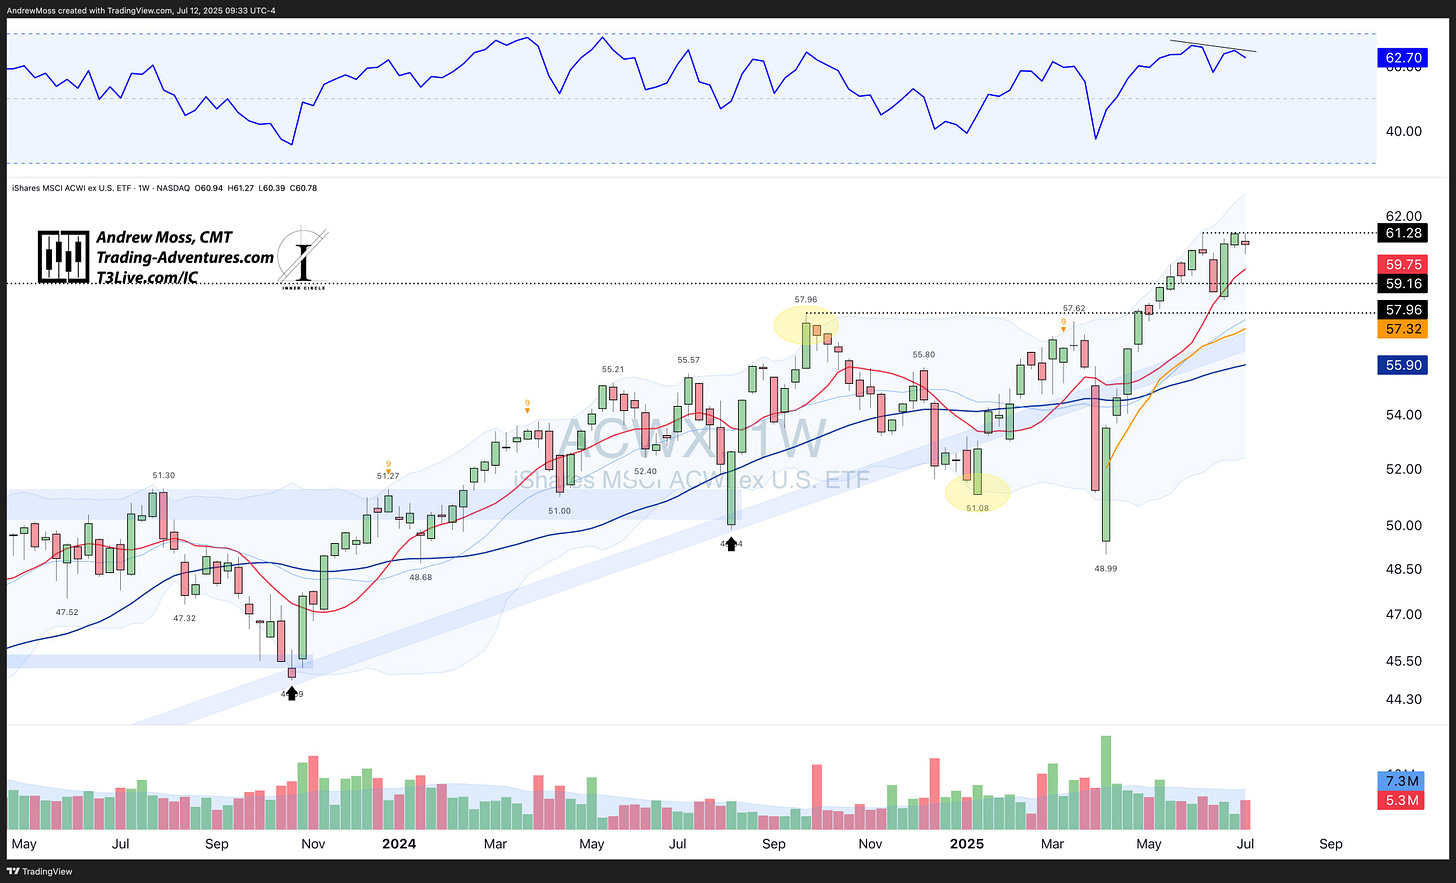
Global equities held steady, consolidating just under recent highs.
There’s a slight short-term negative RSI divergence. Maybe nothing, but worth keeping an eye on.
China Large-Cap (FXI)
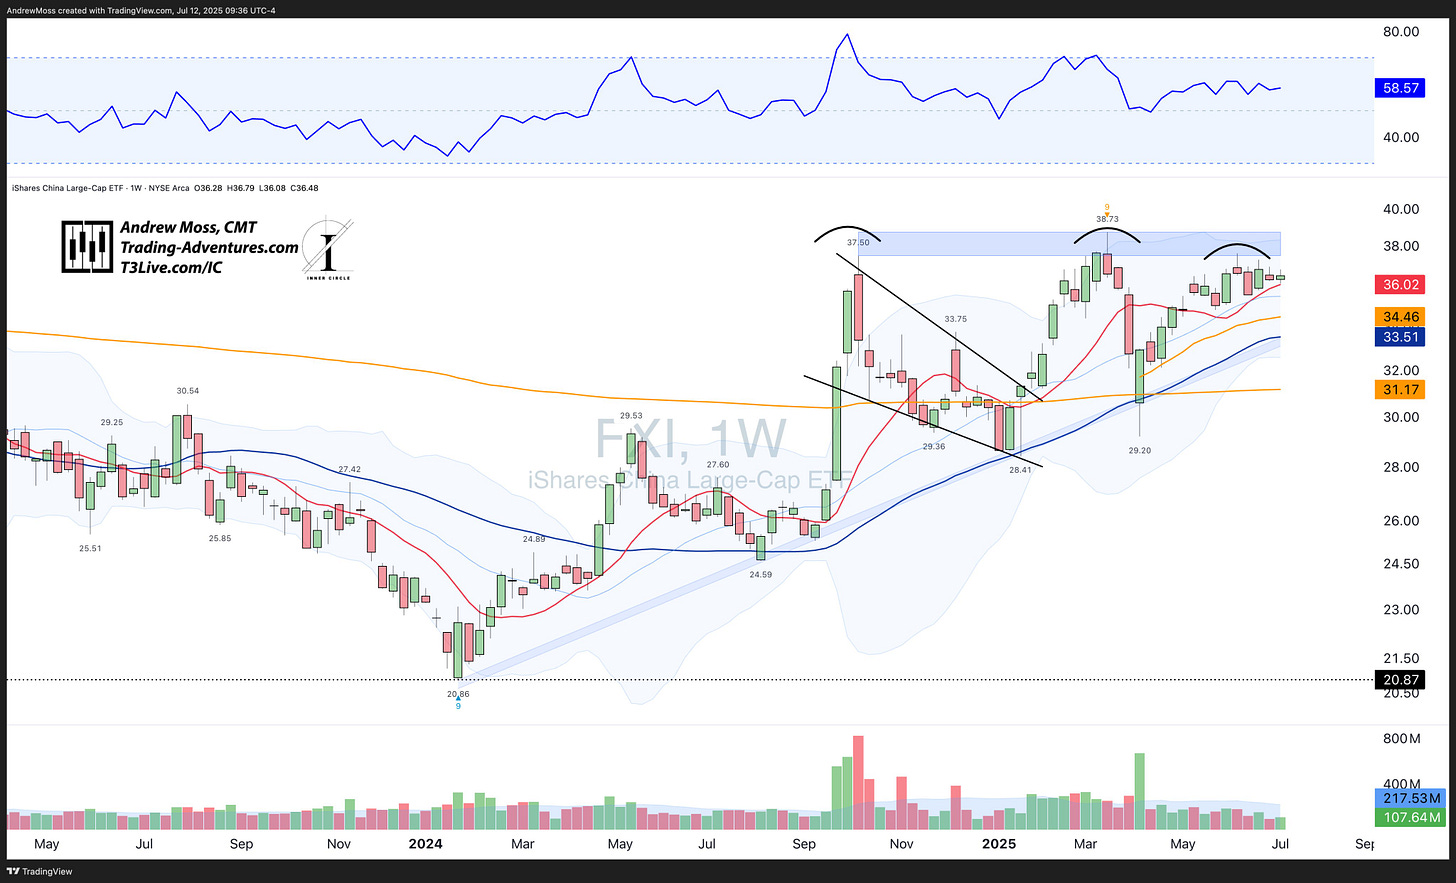
FXI hasn’t made a decisive move above $38 yet. Is the delay a warning sign—or is it quietly building pressure for a powerful upside breakout?
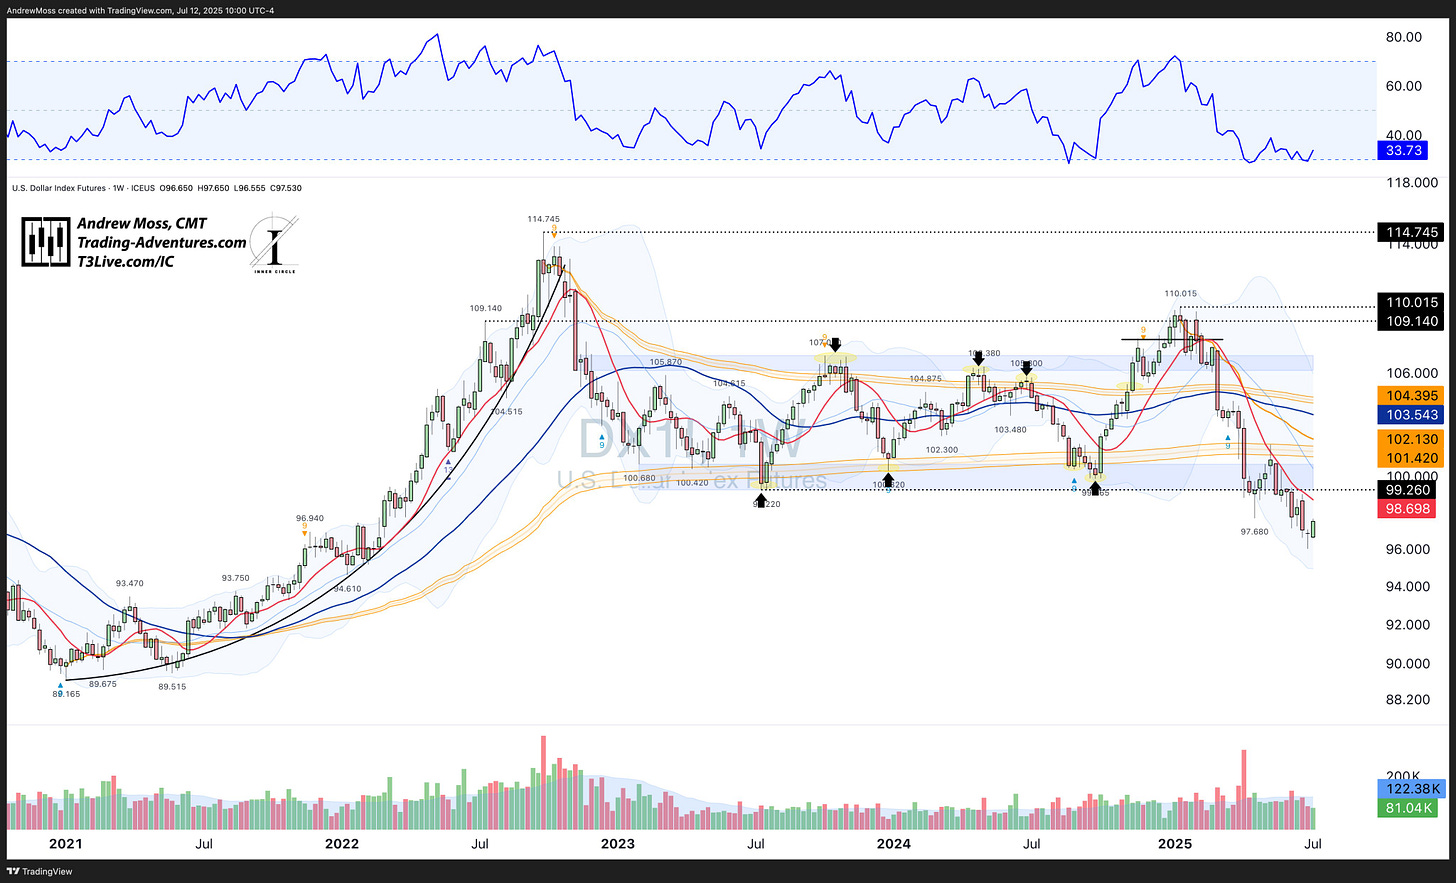
U.S. Dollar Index ($DXY)
DX1! Slight rebound this week, confirming last week’s reversal candle.
Still, there’s a long way to go before we see meaningful trend strength return.
🧳 Bonds & Credit
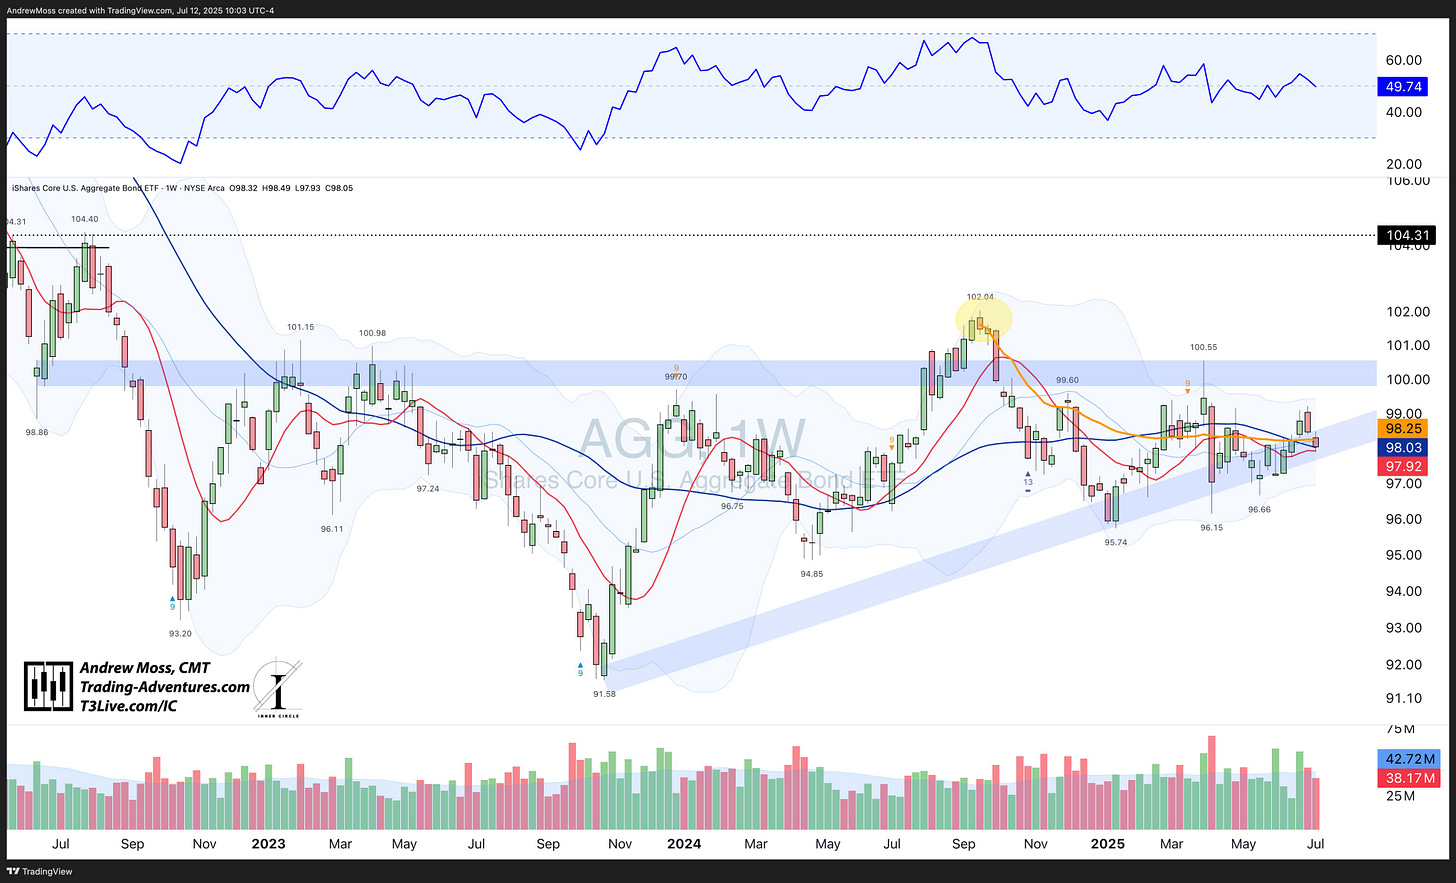
AGG is trying to hold support at the rising 10- and 40-week MAs and a key trendline.
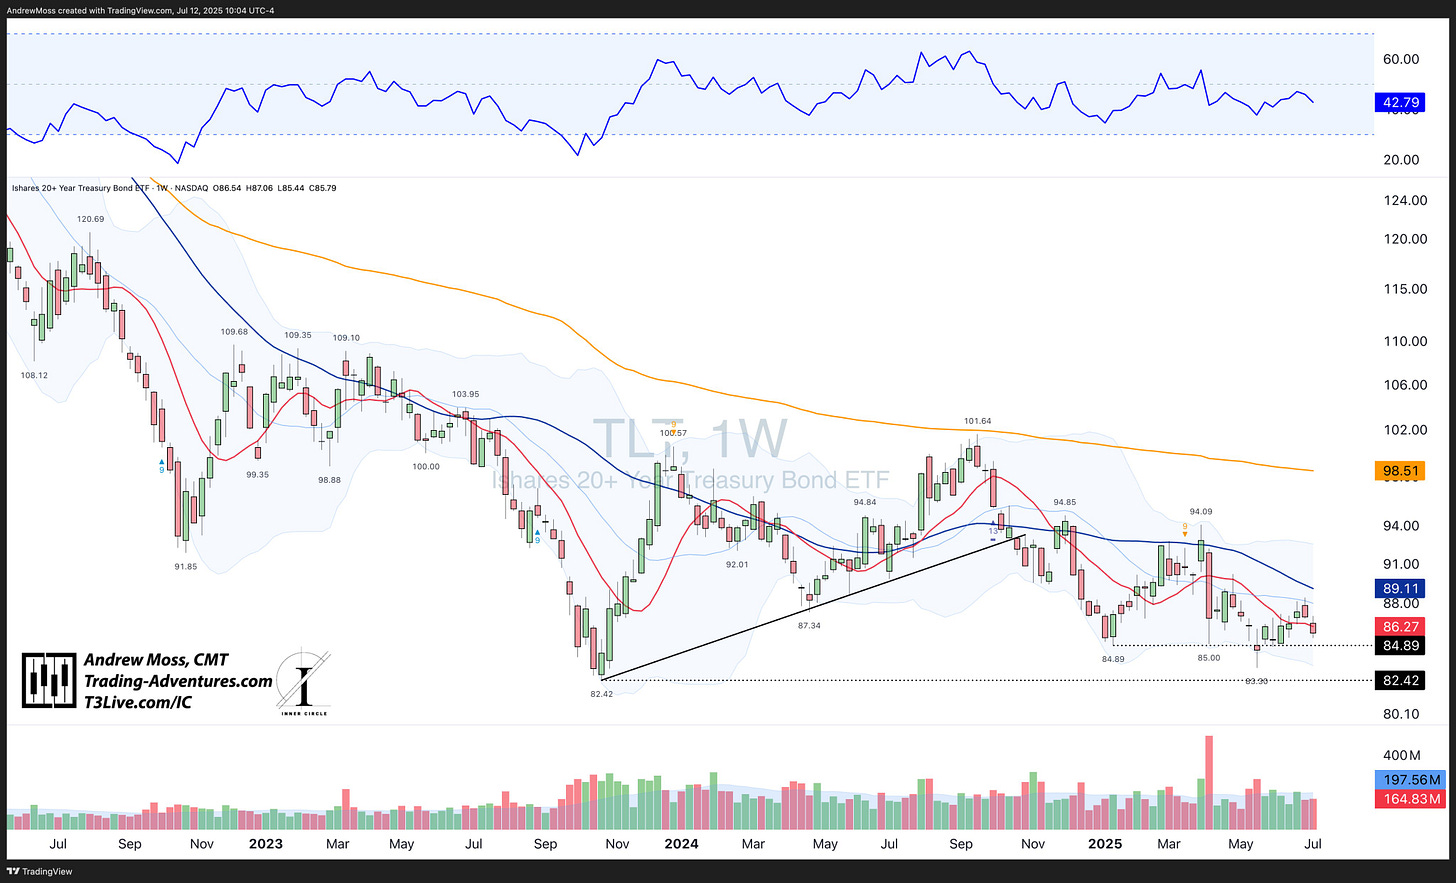
TLT gave up recent gains and dropped below the 10-week MA.
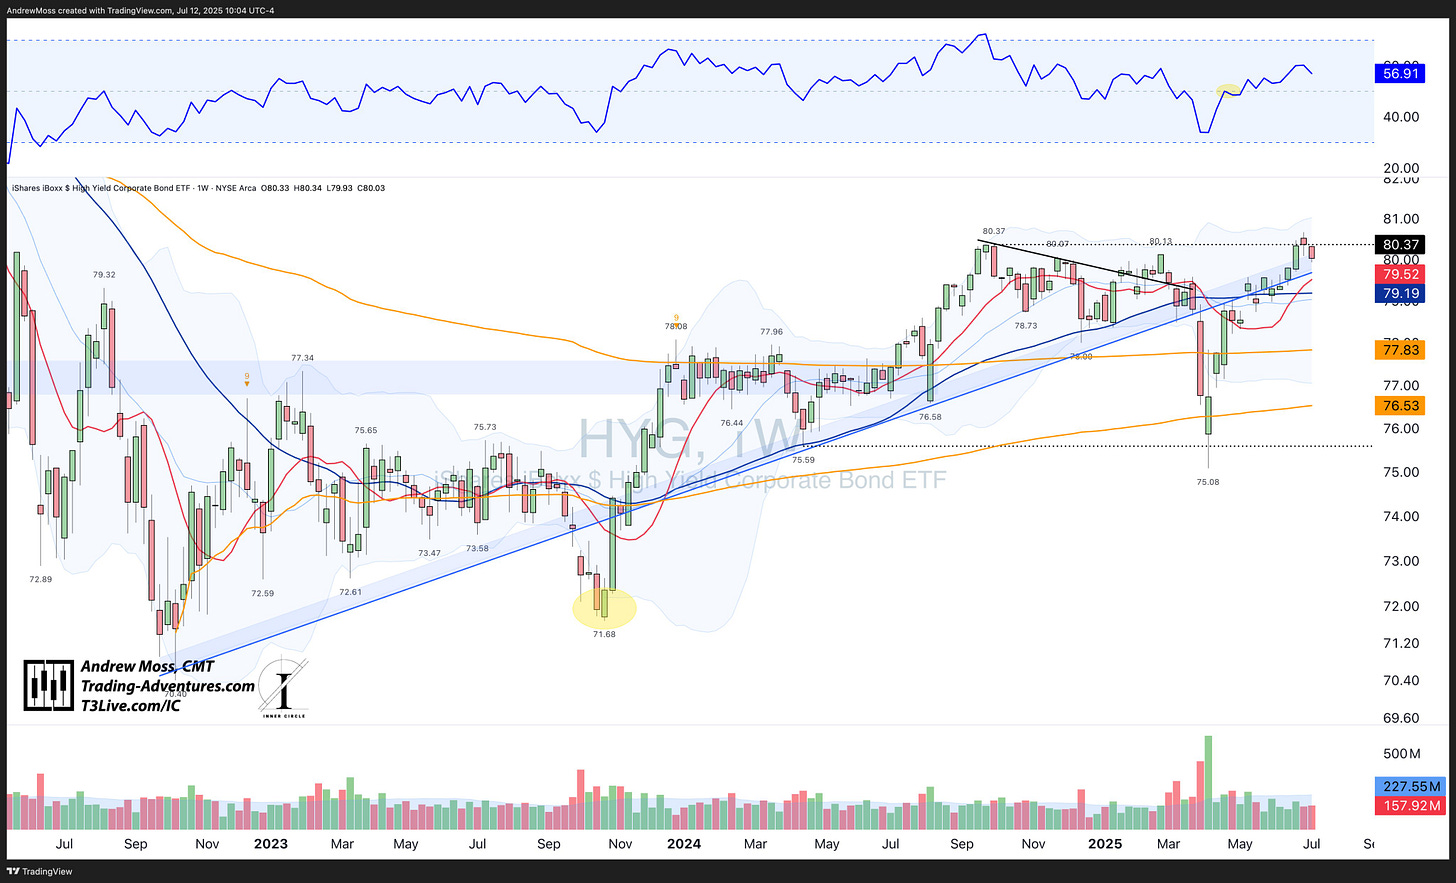
HYG failed to follow through on last week’s breakout. Could be a failed move… or just a pause.
Overall: Bonds and credit aren’t doing much.
⚖️ Metals
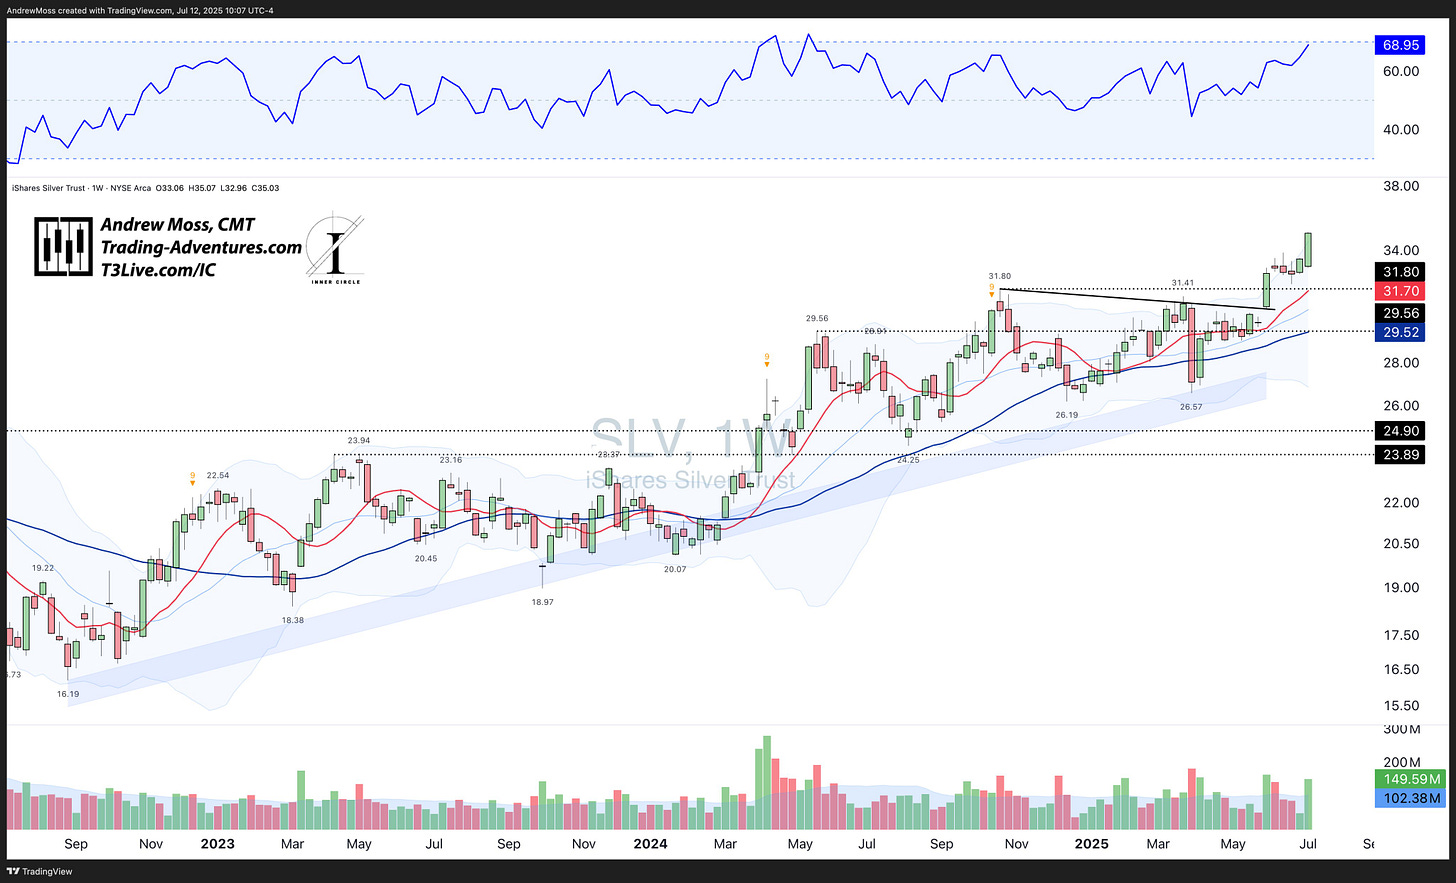
Silver (SLV)
Best in show from the commodities space this week.
Silver looks strong after breaking out above a tight consolidation range.
📊 Breadth & Internals
SPX breadth indicators are holding high levels, though they ticked lower this week.
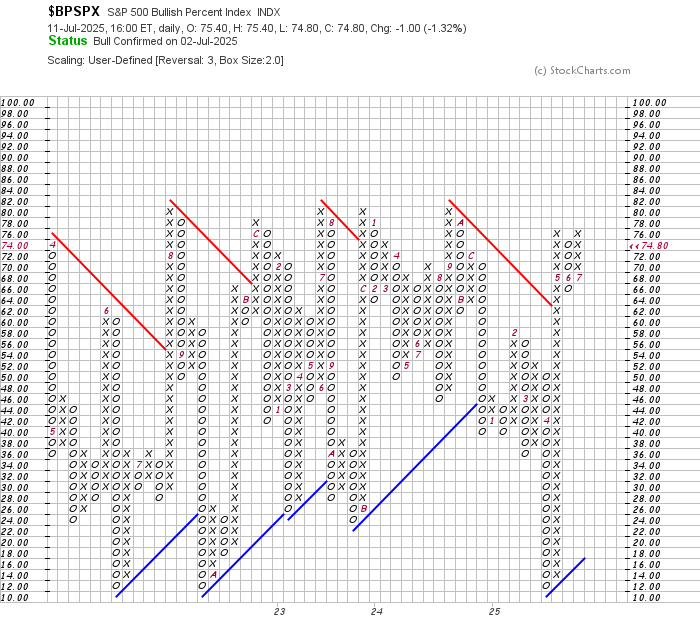
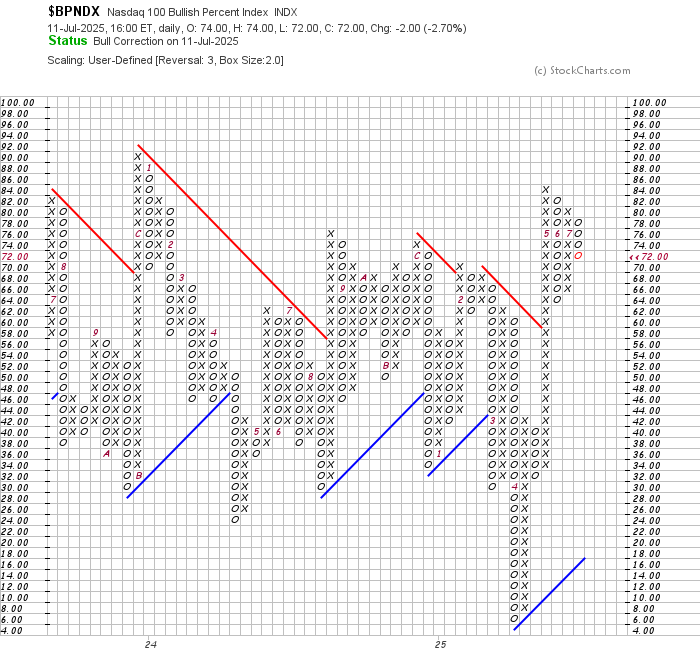
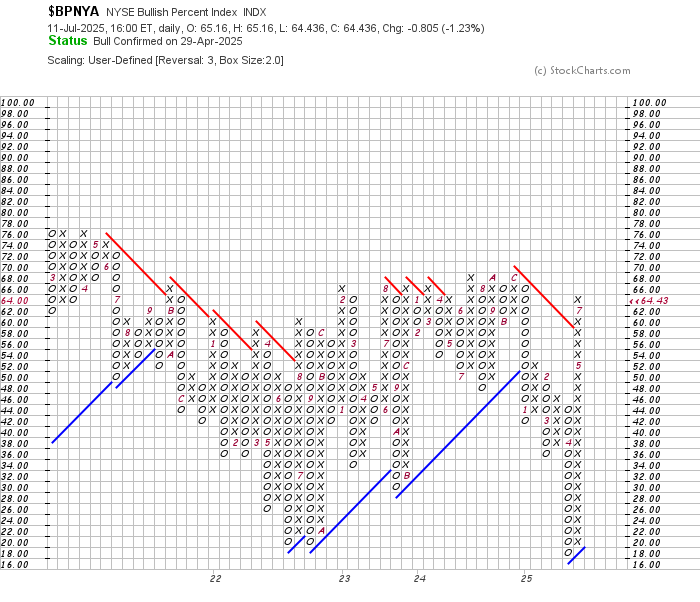
Bullish Percent Indexes:
BPSPX is nearing a double-top breakout
BPNDX has added two more columns of Xs
BPNYA is mostly unchanged, adding one more X
Still healthy.
Unlock Market-Beating Options Trades with EpicTrades – Join The Winning Streak Today
💥 Real setups. Real follow-through.
📩 Want real trades like this — with structure, targets, and real-time alerts?
Join here → t3live.com/epicoffer
🔄 Relative Strength
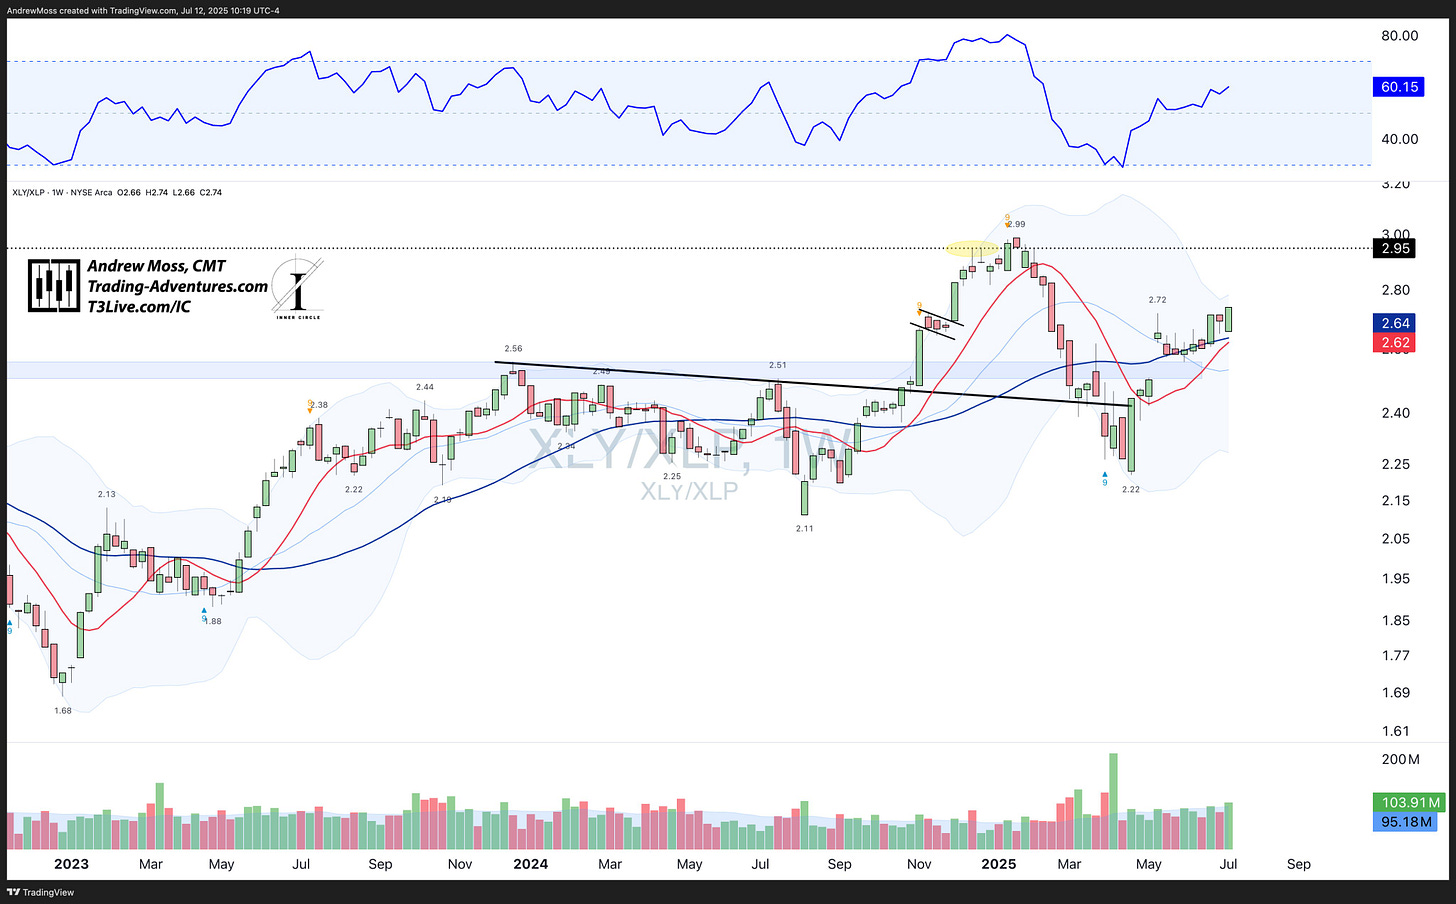
🟢 XLY vs. XLP: Discretionary is gaining on Staples
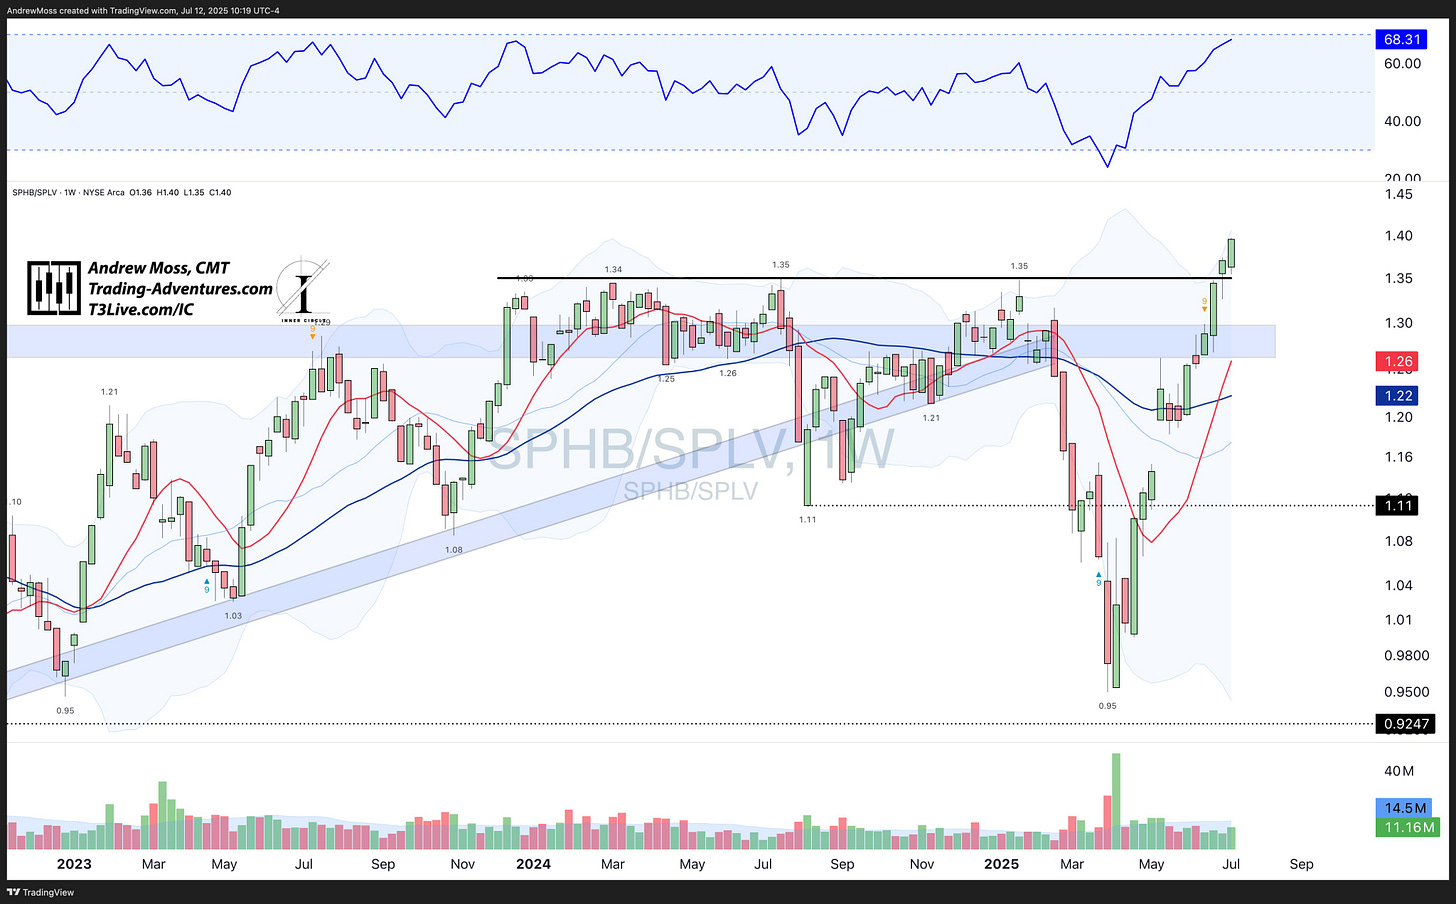
🟢 SPHB vs. SPLV: High Beta is breaking out over Low Volatility
Both point to: Risk-On!
For more on Relative Strength, see the Chart School lesson:
🔍 Now what?
Bitcoin and Ethereum are leading
Discretionary is outperforming Staples
High Beta is outpacing Low Volatility
Large-cap indexes are consolidating at highs
Breadth is resting, not breaking
Bonds, commodities, and the dollar are quiet (except Silver)
Together, this paints a strong and supportive environment for stocks.
Yes, we’re near the top of the Bollinger Band range, and the move off March/April lows has been huge. That opens the door to some chop or volatility.
But big picture? The trend remains bullish. Risk takers are still being rewarded.
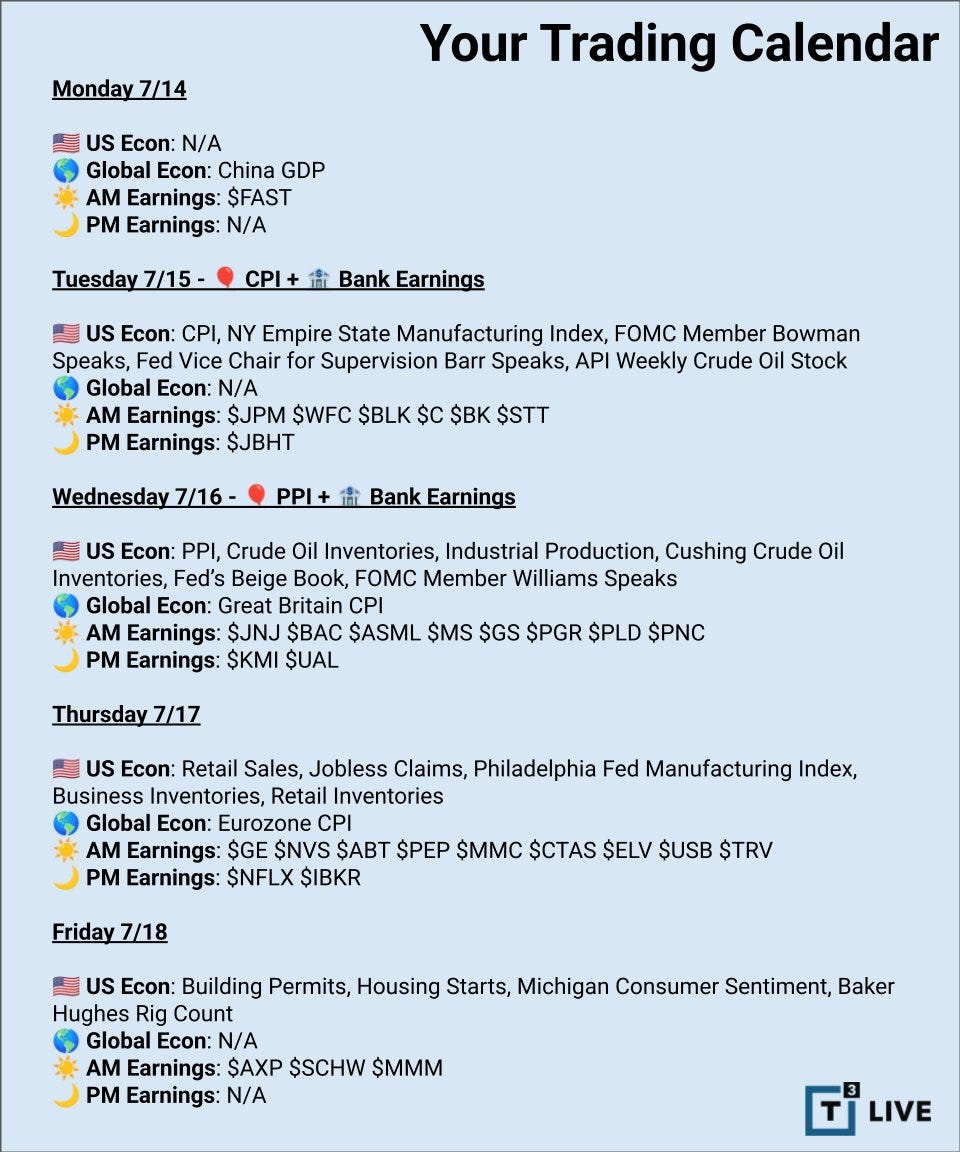
Next week gets busy again:
Earnings season begins with the banks: JPM, WFC, C, BAC
NFLX reports Thursday
CPI, PPI, Fed speakers, Beige Book, and more
Stay ready.
🙏 Thanks for Reading
These 📈Weekly Charts📉 are designed to help you stay clear, consistent, and confident in your trading.
If you haven’t already:
❤️ Tap the heart
📤 Share with a fellow trader
💬 Let me know what stood out this week
Until next time —
Andy
Looking For More?
Elevate Your Trading Adventure Even Further With These Offerings.
EpicTrades Options Newsletter
Real-time trade ideas and insights, providing actionable trading insights focusing on options trades with short-term horizons, aiming to capitalize on weekly market movements.
The approach includes detailed reasoning for trades, specific options, and profit targets. It focuses on quick gains with a minimal time commitment from subscribers.
Click below to sign up!
The Inner Circle
The Inner Circle is a Virtual Trading Floor (VTF) at T3 Live. I’ve been working and trading with this group since 2022. You may have noticed the logo in the watermarks on my charts.
Founded by David Prince and led by him, Rick March, and Kira Turner, the Inner Circle is a community of elite traders, including hedge fund managers, family office heads, corporate executives, financial advisors, and even professional poker players.
Fundamental, Macro, and Technical Analysis all combine to find and discuss the best opportunities in current markets.
The Disclosures
***This is NOT financial advice. This is NOT a recommendation to buy, sell, or trade any security. The content presented here is intended for educational purposes only.


