

What do candlesticks have to do with stocks?
Candlestick charts show a concise picture of the price action on any timeframe.

Candlestick charts show a concise picture of the price action on any timeframe.
Developed in Japan as a tool to aid in rice trading, candlestick charts have been around since the 17th century and are one of the most popular types of charts used in technical analysis. In his book on the subject, Steve Nisson credits this popularity to features including:
-Easy to understand
-Provide earlier indications of market turns
-Increased efficiency of analysis because of the immediate visual information
How are they made?
The construction is very simple.
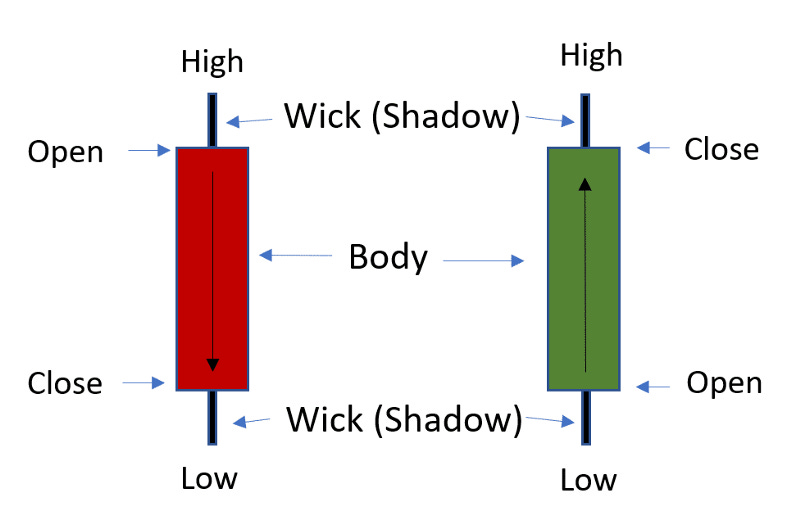
A candle has four price components: open, high, low, and close. Using these four prices, candles are “drawn” to show a “real body” and “shadows.” The body shows the opening and closing prices. Shadows show the high and low for the period. If the closing price is higher than the opening price, the candle will usually be green, white, or hollow. And if the opposite is true, it will be black or red.
How do you read them?
Once familiar with the simple construction technique, candle charts give a clear picture of price action and movement in one glance. Long candles show an expanding price range, while short ones show compression. Opening and closing prices that are the same or very close signal indecision. Long shadows show a reversal.
The color of the candles indicates direction. The sequence of candles gives an idea of whether or not the price is trending. Certain combinations of candles represent patterns that can further indicate momentum, reversal, or consolidation.
Elegance and efficiency. The simple construction and concise conveyance of information makes the Japanese Candlestick chart an indispensable tool. While elegant and powerful, a candle chart is just one tool. Like all the other tools and techniques of the technical analyst, its usefulness is enhanced when combined with other tools.
The Disclosures
***This is NOT financial advice. This is NOT a recommendation to buy, sell, or trade any security. The content presented here is intended for educational purposes only.
Looking For More? Elevate Your Trading Adventure Even Further With These Offerings

EpicTrades Options Newsletter
Real-time trade ideas and insights, providing actionable trading insights focusing on options trades with short-term horizons, aiming to capitalize on weekly market movements.
The approach includes detailed reasoning for trades, specific options, and profit targets, focusing on quick gains with less time commitment required from subscribers.

The Inner Circle
The Inner Circle is a Virtual Trading Floor (VTF) at T3 Live. It’s the group I’ve been working and trading with since 2022. You may have noticed the logo in the watermarks on my charts.
Founded by David Prince and led by him, Rick March, and Kira Turner, the Inner Circle is a community of elite traders, including hedge fund managers, family office heads, corporate executives, financial advisors, and even professional poker players.
Fundamental, Macro, and Technical Analysis all combine to find and discuss the best opportunities in current markets.
