What is Anchored VWAP?
Anchored VWAP is exactly what it sounds like. It is the average price, weighted by volume, and anchored to a particular time.
Volume weighted average price or VWAP is traditionally used on an intraday basis as a benchmark. Some traders like to know where price is relative to the average of all shares traded so far in a session. Some are even judged against it and therefore prefer to buy below the VWAP and sell above it.
Extending the VWAP beyond the confines of a single daily trading session can be incredibly useful as well. Brian Shannon of AlphaTrends.net has taught about and popularized this concept.
He explains more here:
https://alphatrends.net/archives/2017/12/use-anchored-vwap-avwap/
I have incorporated it into my process as well and I frequently look at the VWAP anchored to a recent high or low, or the start of a time period; week, month, quarter, year-to-date, etc. And it is useful on charts of all different time frames. I look at it on the daily and 30-minute charts most.
Here are some examples from today's trading session.
$SPY $AAPL $XLE - all finding support at the VWAP anchored to the 3/14 low - 30m charts
$AMZN $MSFT - finding support at the VWAP anchored to the 3/8 low - 30m charts
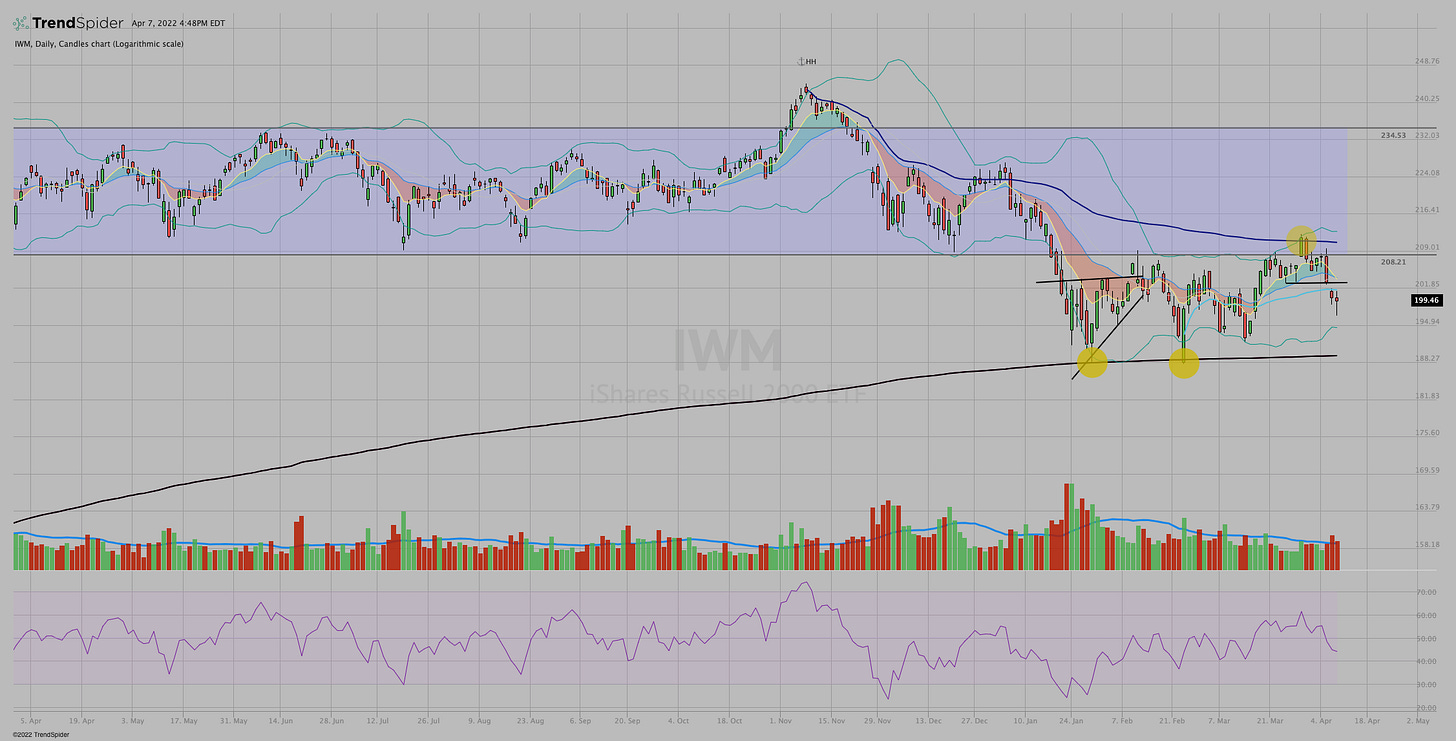
$IWM - finding support at the VWAP anchored to the 3/19/2020 low and then resistance at the VWAP anchored to the all-time-high on 11/8/2021. - Daily chart
These examples all show fairly clean price action reversals at the AVWAP. But keep in mind that AVWAP is not a trading signal by itself. Price moving into the AVWAP does not guarantee an instance of support or resistance. There are many times when other factors are at work and price moves right through the AVWAP as if it wasn't even there. It is almost always a useful reference point though.
If you're not using it on your charts you may want to consider it. Trendspider makes the process very easy with a "point-and-click" addition to any chart. Or the process can even be completely automated.
Check it out here.


