

Working off the extension
Mid-week Market Update November 16, 2022

Yesterday’s article addressed the extension in the major stock indexes. Extension, in this context, is defined as the distance between the current price and the price equilibrium. Price equilibrium is designated as the area between the 8 and 21-period exponential moving averages.
As the price moves further away from equilibrium it becomes increasingly likely that the gap narrows. The narrowing started yesterday and we’re seeing more of that today.
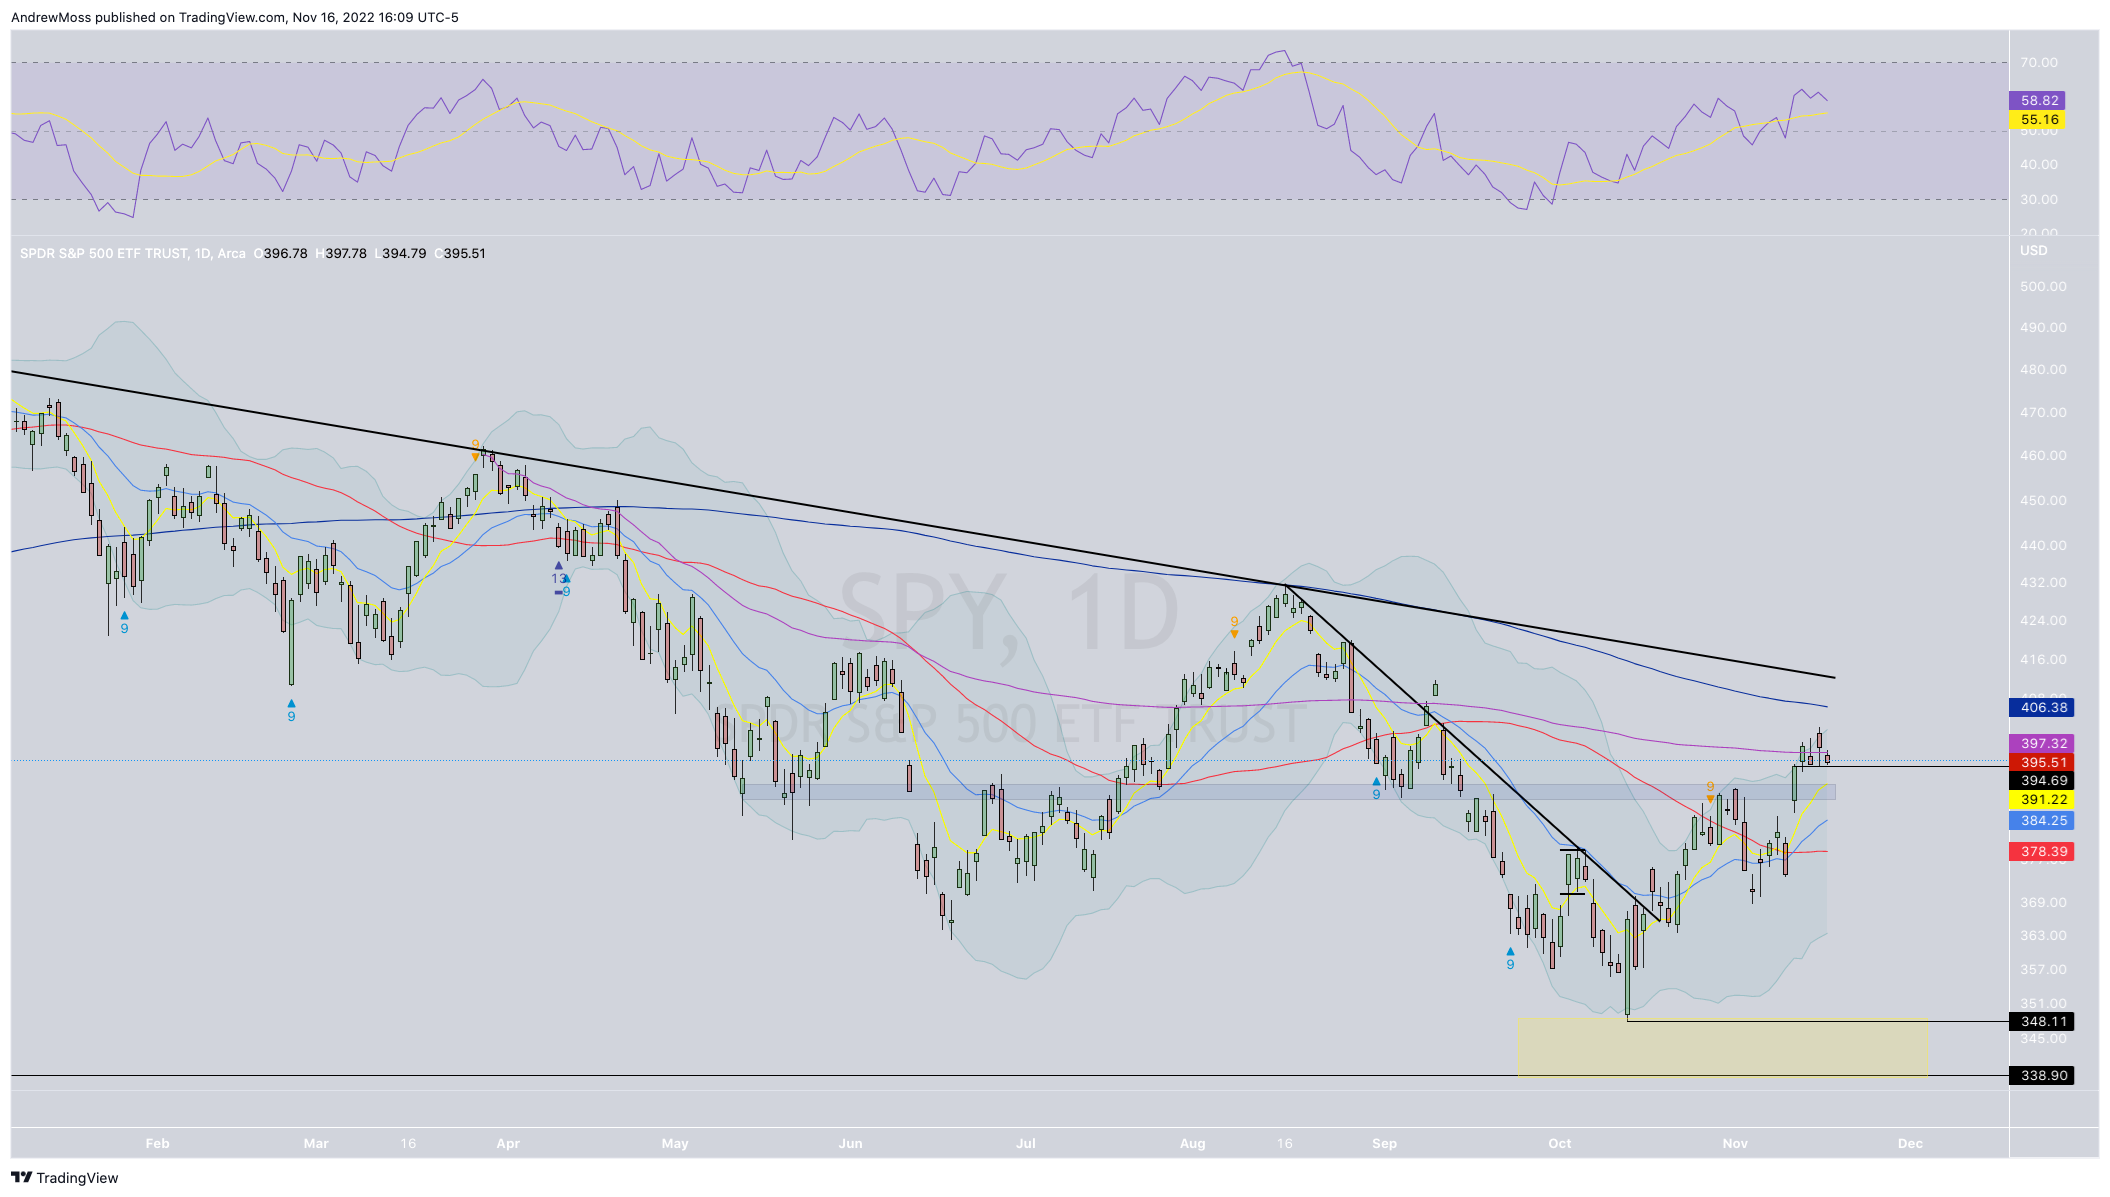
For $SPY, a $10 gap has become a $5. And so far it has done so while the price has remained above Thursday’s (CPI day) close. That is a bullish consolidation and, if it continues, should lead to further upside.
Here are the charts -
SPY
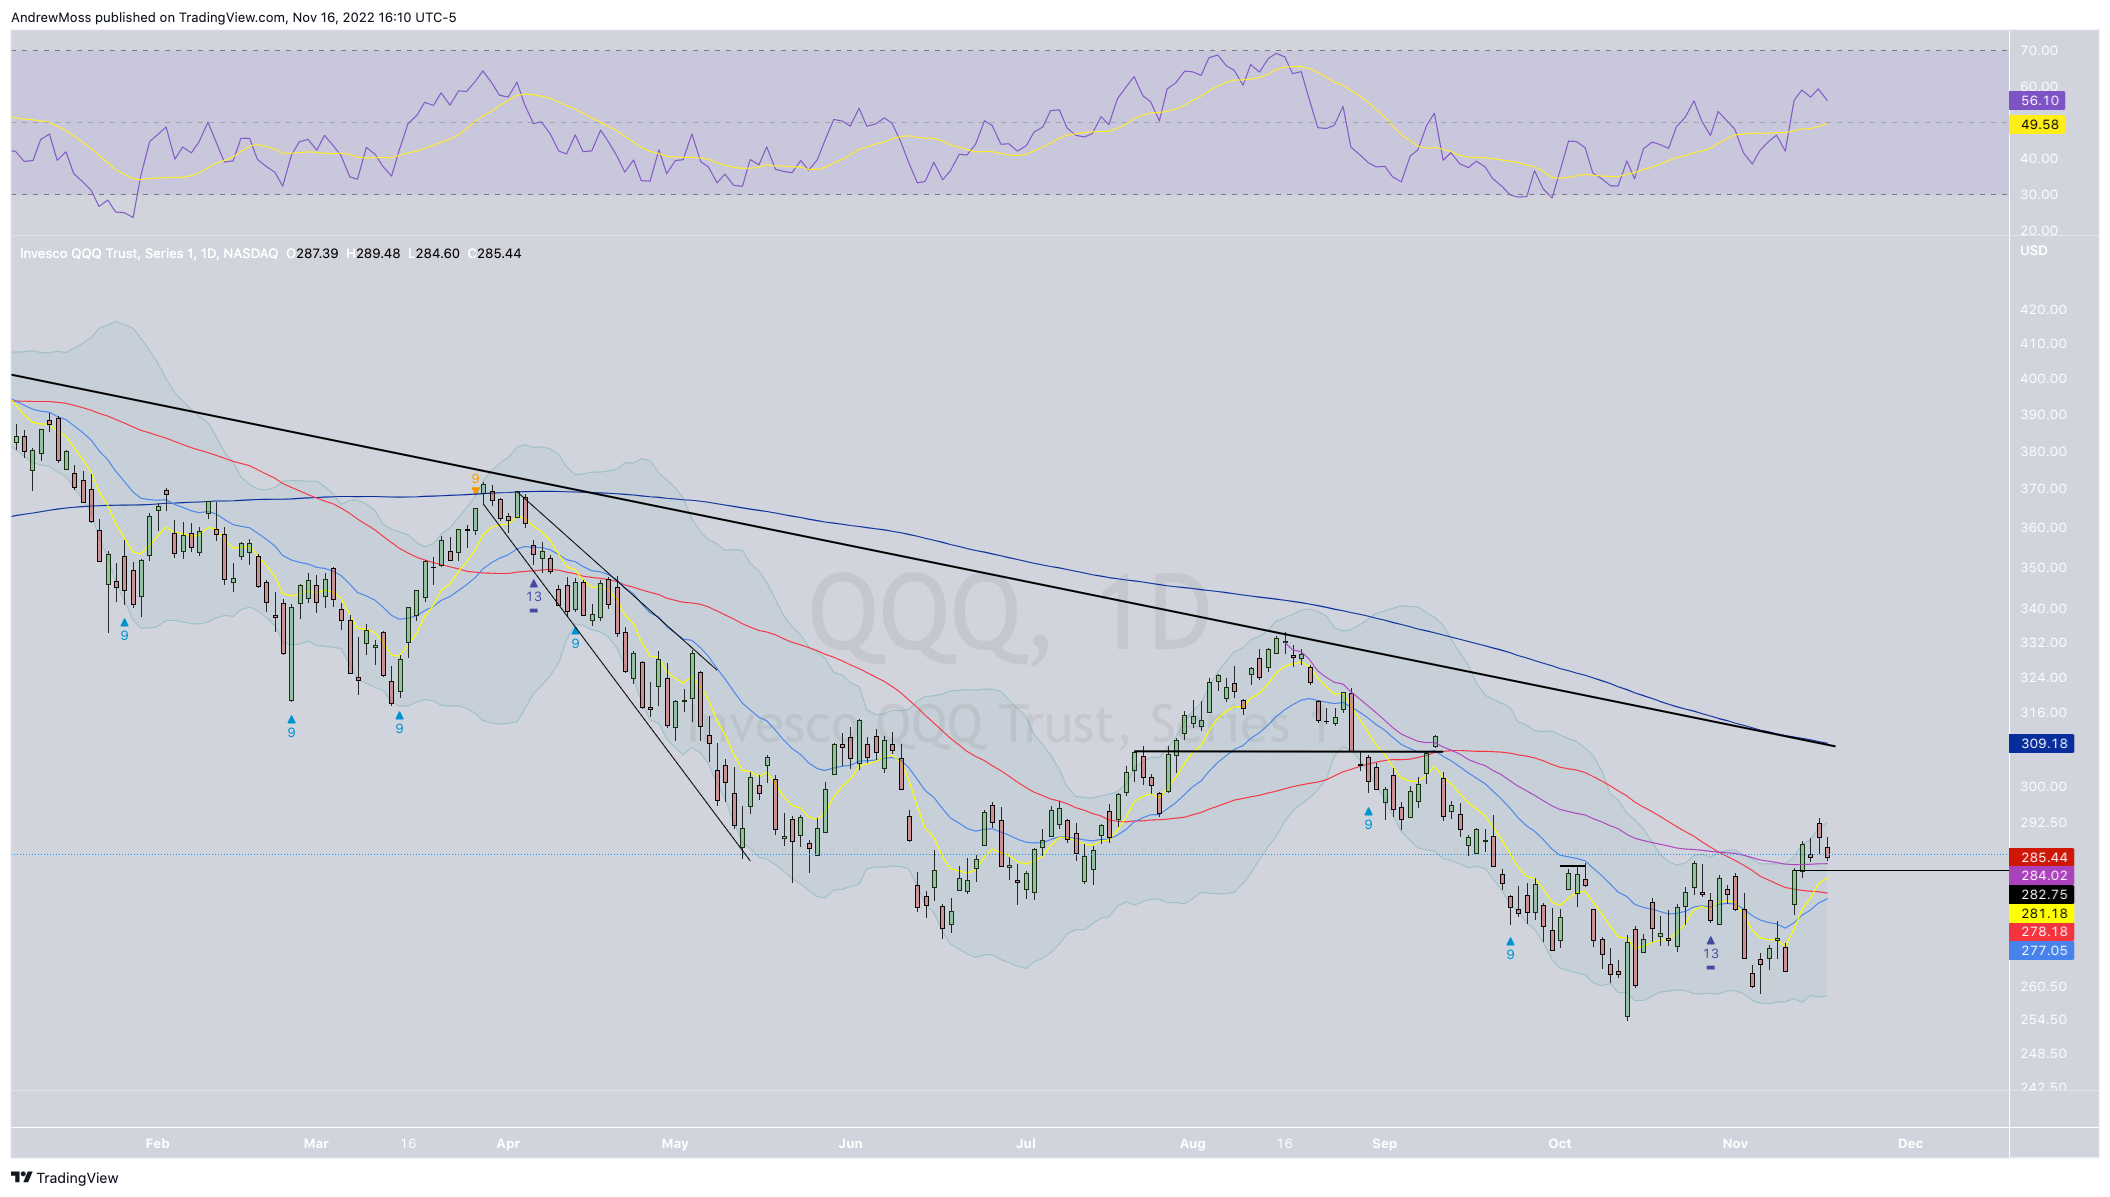
QQQ is also narrowing the gap and is still above Thursday’s close and the August high anchored VWAP.
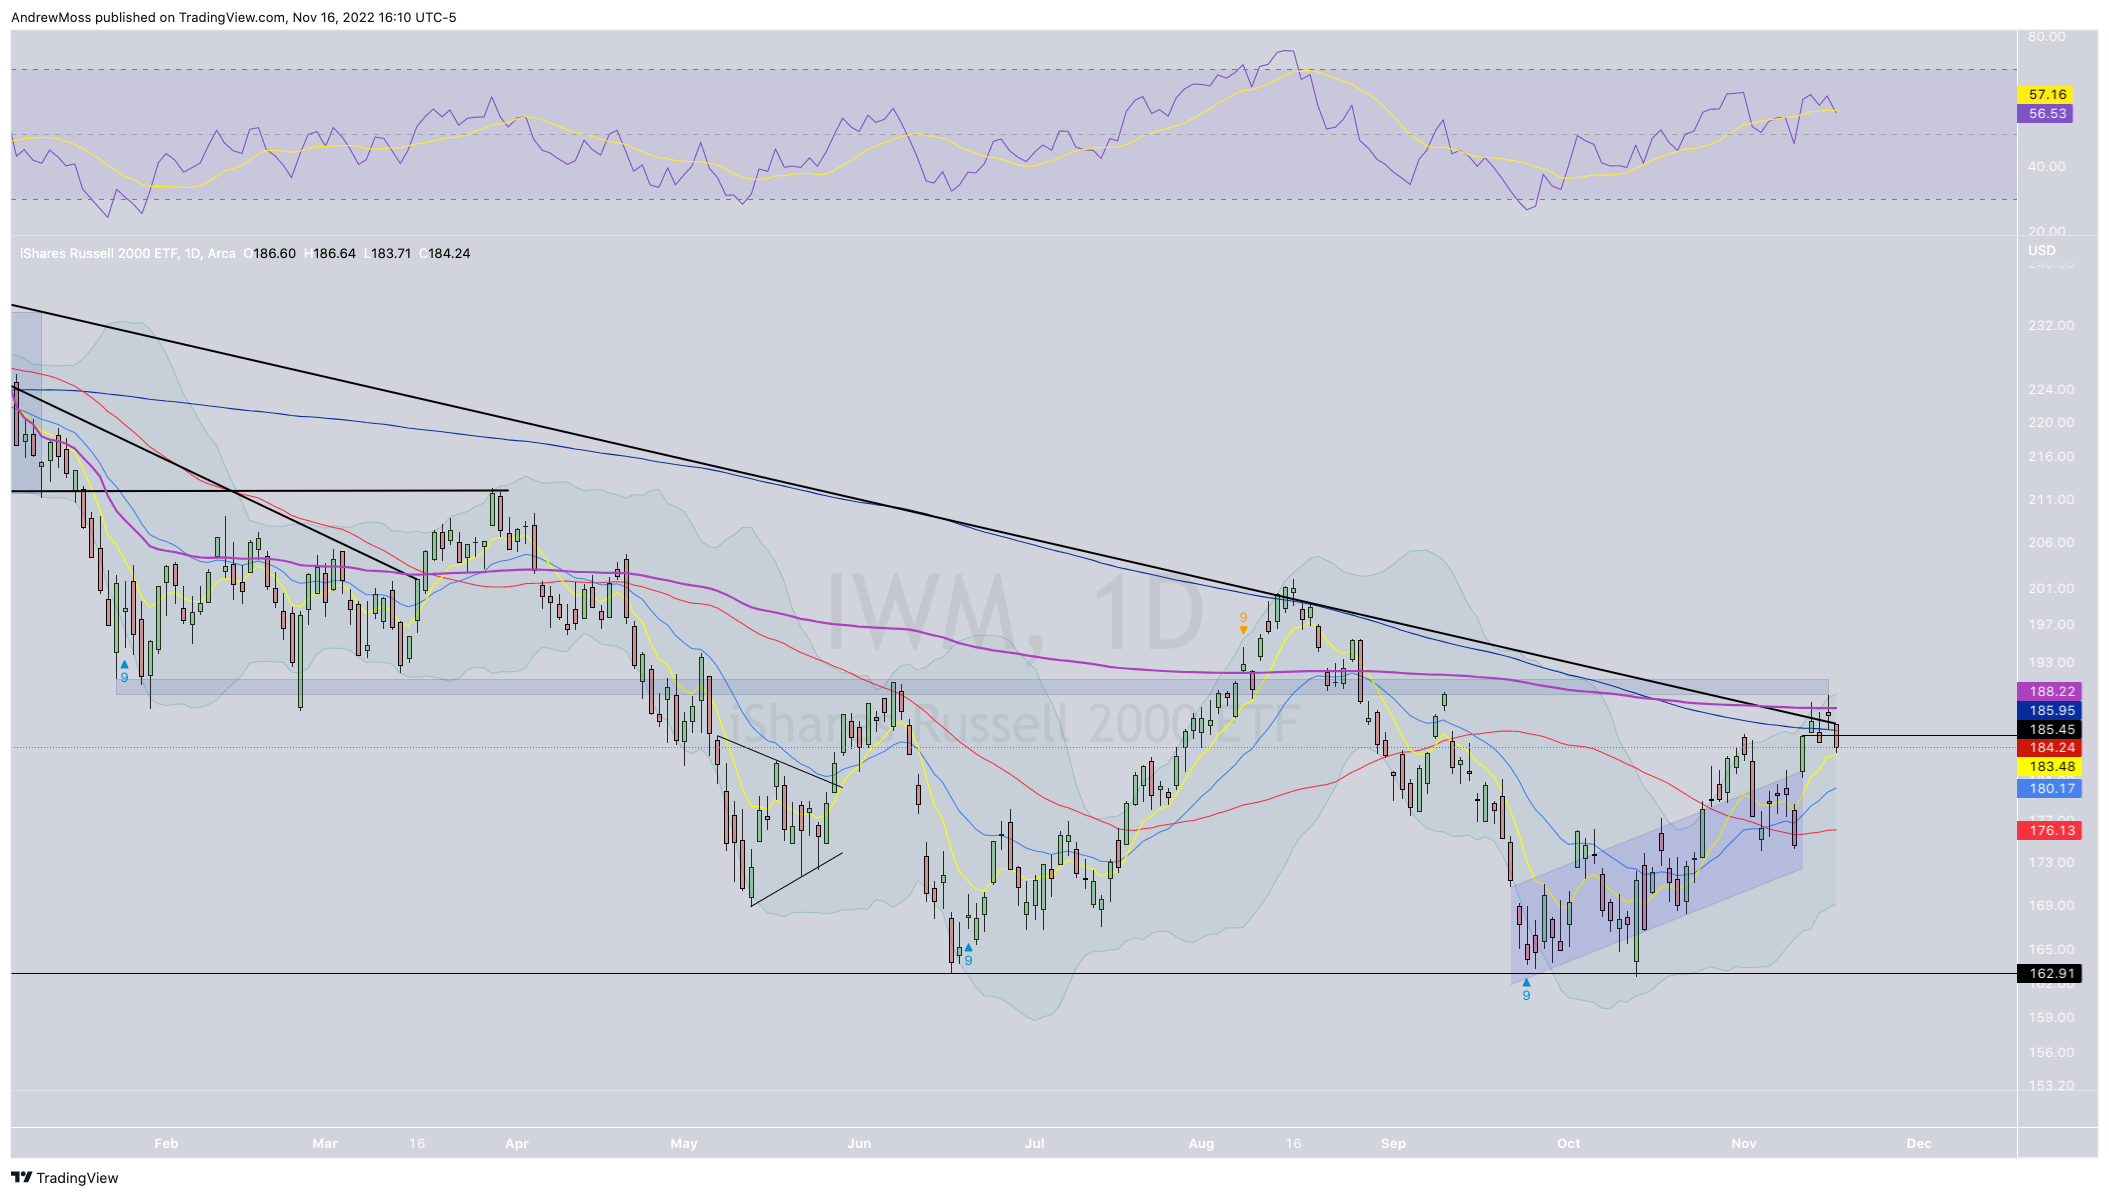
IWM is the closest to touching the 8-day EMA but is a little weaker than the other two indexes as its trading below Thursday’s close. That doesn’t kill the bullish move, but it is worth noting.
The US Dollar, always a factor for stock prices, is notable here as well.
This update is from earlier today —

So we’re still in a bullish scenario, but there’s no hurry to add too much long exposure until we see the extension gap closed, or we see a strong resumption of momentum — upward in stocks, downward in the Dollar.
Individual stocks will need to pass this test
Up until this morning, Target Corporation was moving nicely into its 200-day moving average. The reaction the this morning’s earnings announcement resulted in a powerful price rejection and now we’ll have to see if it can rebuild and move higher again. Or maybe the news leads to further selling.
TGT
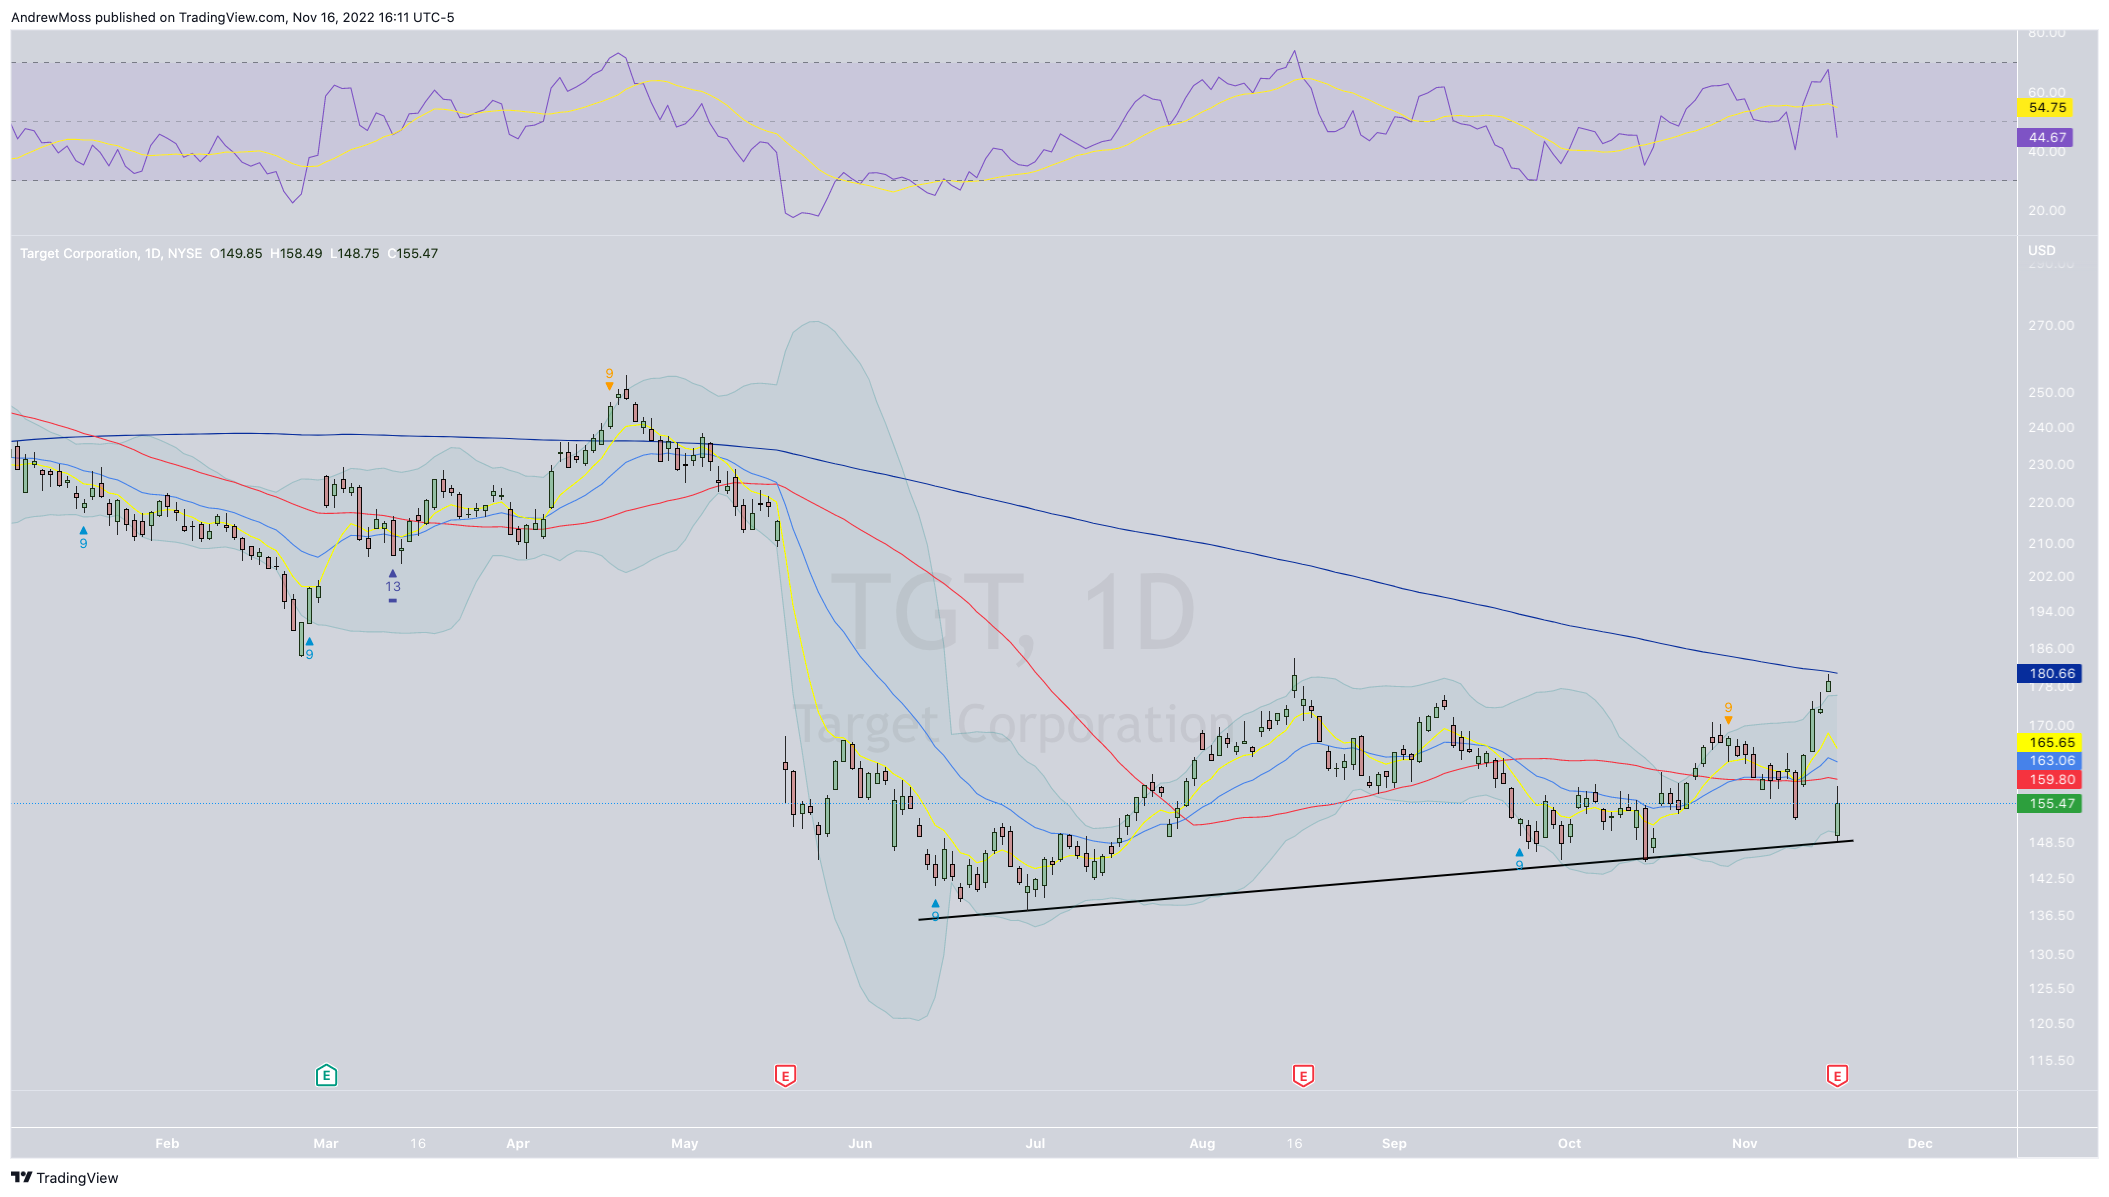
The point here is that this is a test that we could see in many names in the coming days or weeks. So as you look at other names and their charts pay special attention to the 200-day moving average.
Where is it in relation to price? Above or below? Near or far away?
Where is the 50-day in relation to the 200-day? Above or below?
Is the 200-day sloping up or down?
Or is it flat?
The answers to each of the questions will help you determine if the stock in your view is trending. If you’re considering taking a trade or adding to your portfolio it is wise to be on the side of the overall trend.
As one of the more widely used measures of long-term trends, you can bet that we’ll be seeing, hearing, and reading a lot about 200-day moving averages in the near future.
***This is NOT financial advice. NOT a recommendation to buy, sell, or trade any security. The content presented here is intended for educational purposes only.
Andrew Moss is an associated member of T3 Trading Group, LLC (“T3TG”) a SEC registered broker/dealer and member of FINRA/SIPC. All trades placed by Mr. Moss are done through T3TG.
Statements in this article represent the opinions of that person only and do not necessarily reflect the opinions of T3TG or any other person associated with T3TG.
It is possible that Mr. Moss may hold an investment position (or may be contemplating holding an investment position) that is inconsistent with the information provided or the opinion being expressed. This may reflect the financial or other circumstances of the individual or it may reflect some other consideration. Readers of this article should take this into account when evaluating the information provided or the opinions being expressed.
All investments are subject to risk of loss, which you should consider in making any investment decisions. Readers of this article should consult with their financial advisors, attorneys, accountants or other qualified investors prior to making any investment decision.
POSITION DISCLOSURE
Long: COIN1118P45, QQQ1125P290, SPY1125P400
Short: COIN1118P40, QQQ1125P280, SPY1125P390
Options symbols are denoted as follows:
Ticker, Date, Call/Put, Strike Price
Example: VXX1218C30 = VXX 12/18 Call with a $30 strike