Special Announcement!
I’ll be speaking with Greta Wall again on Conversations With A Pro Trader - This Wednesday, September 27th at 4:30 PM
We'll be talking about the good, the bad, and the ugly of being a professional trader. With Q&A. Join us Wednesday. And bring your questions.
Register here: Conversations With A Pro Trader - Featuring Andrew Moss, CMT
The Markets
The Dollar, 10-year yields, and SPY are all higher today. However, the positive action is not the same.
The Dollar is making new highs within the context of this current bullish run.
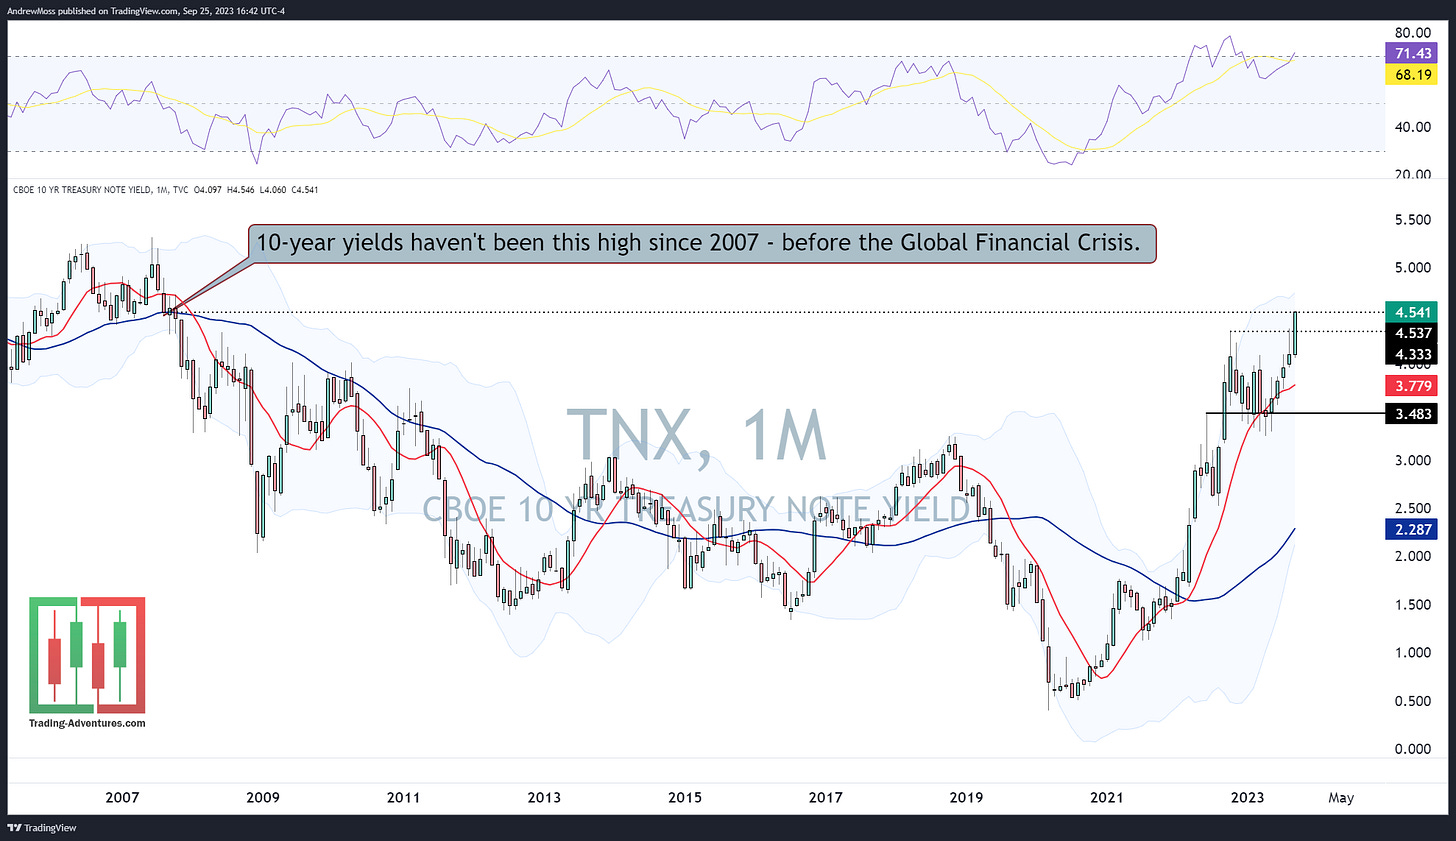
10-year yields are making new highs for the year and hitting levels not seen since 2007, before the Global Financial Crisis.
SPY looks more like an oversold relief bounce.
Positive price action? Technically, yes. Positive message? Not exactly.
Higher rates are changing the landscape for everything from growth stocks to mortgages to government debt. Combine this with the rising Dollar and the headwind for stocks appears to be getting stronger.
Even though SPY and QQQ are positive on the day, it’s little consolation when the gains are modest and coming after a gap lower at the open. That said, there are a few things bouncing from important levels (TSLA at its 100-day MA, DIA at its 200-day MA for instance) so let’s see if this can develop into something more lasting.
Here are the charts.
The Charts
SPY bounced from the gap-down open and is back in the support/resistance zone. Getting above the shaded area and the anchored VWAP would be the first indication that the move has more potential.
If it moves lower we’ll still be watching the gap area around $422-$424.50, followed by the 200-day MA.
QQQ spends a third day trading on either side of the anchored VWAP and near the support/resistance zone. Friday’s pivot high and the 100-day MA will be test areas above. $354 is still the level to watch below.
IWM touched the bottom of the gap area and then moved to the top. A nice green candle, but follow-through is needed.
DIA bounced from its 200-day MA. Now we see if it can get back above $340.
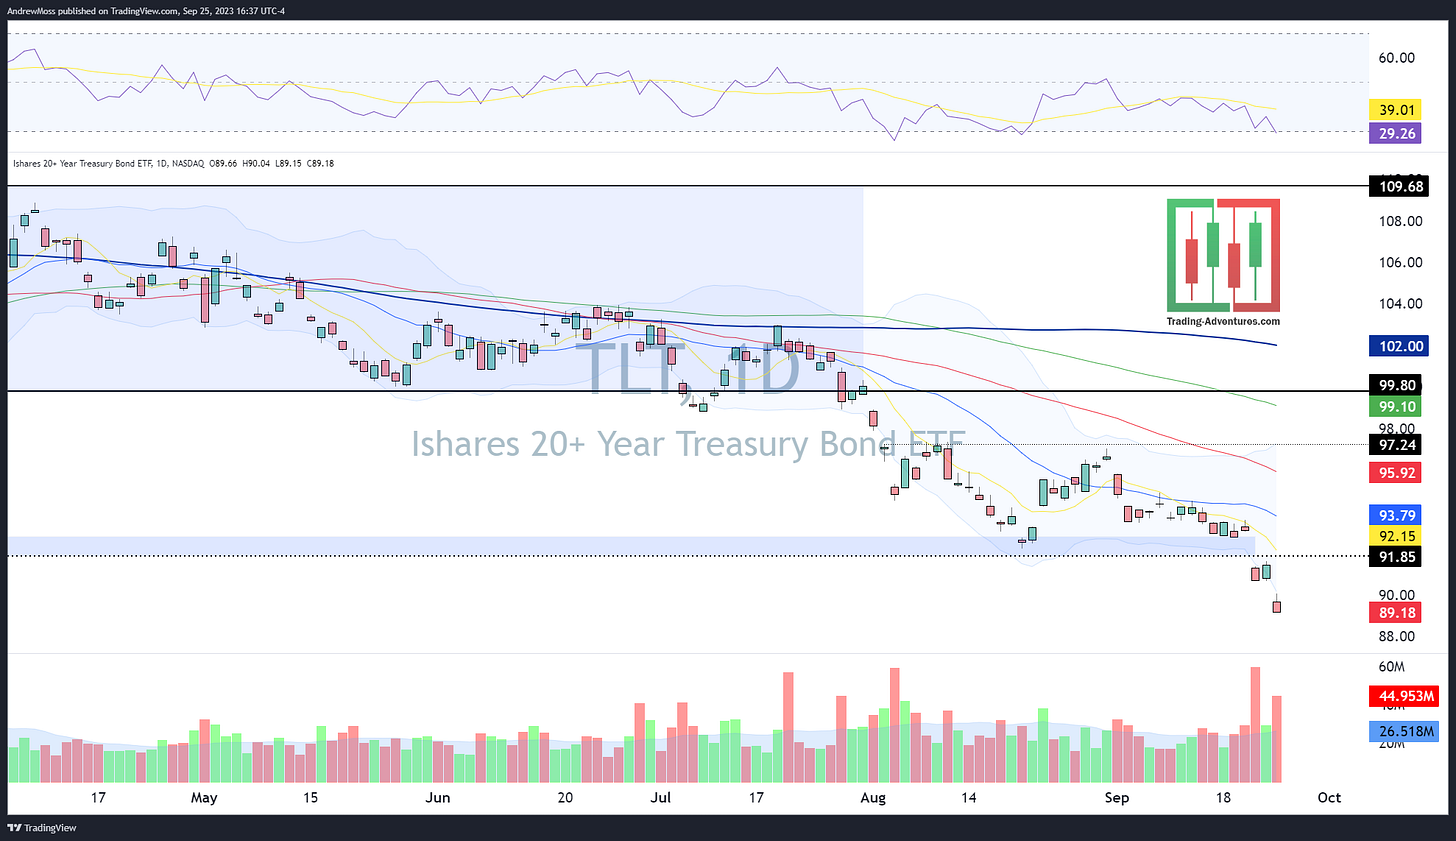
TLT went down nearly -2.5% today as the selling in bonds continues. Potential support levels are many years back on the chart.
DXY The Dollar advances again in relentless pursuit of recent highs.
The Closing Bell
Not a bad start to the week. We left last week looking for a potential bounce from or near some of the levels we’re seeing today. And we’re close to putting the seasonally weak period behind us. History suggests that a rally into year-end is a very likely outcome.
So the plan is:
remain patient
watch support levels
be willing to take trades and see what develops
More on Wednesday during
Conversations With A Pro Trader - Featuring Andrew Moss, CMT
Don’t miss it!
The Disclosures
***This is NOT financial advice. NOT a recommendation to buy, sell, or trade any security. The content presented here is intended for educational purposes only.
Andrew Moss is an associated member of T3 Trading Group, LLC (“T3TG”) a SEC registered broker/dealer and member of FINRA/SIPC. All trades placed by Mr. Moss are done through T3TG.
Statements in this article represent the opinions of that person only and do not necessarily reflect the opinions of T3TG or any other person associated with T3TG.
It is possible that Mr. Moss may hold an investment position (or may be contemplating holding an investment position) that is inconsistent with the information provided or the opinion being expressed. This may reflect the financial or other circumstances of the individual or it may reflect some other consideration. Readers of this article should take this into account when evaluating the information provided or the opinions being expressed.
All investments are subject to the risk of loss, which you should consider in making any investment decisions. Readers of this article should consult with their financial advisors, attorneys, accountants, or other qualified investors prior to making any investment decision.
POSITION DISCLOSURE
September 25, 2023, 4:00 PM
Long: QQQ
Short:
Options symbols are denoted as follows:
Ticker, Date, Call/Put, Strike Price
Example: VXX1218C30 = VXX 12/18 Call with a $30 strike


