Zooming In
How to use multiple timeframe analysis for precision trade entries
Special Announcement!
This article will stray from the usual format (don’t worry, we’ll still chart the major indexes) and look briefly into the concept of multiple timeframe analysis; a tool and a process that can help traders improve the reward-to-risk relationship of any trade.
The Markets - On Different Timeframes
How to use multiple time frame analysis to identify low-risk entries with huge potential reward.
Many times when spotting a potential trade setup, the chart will show potential for higher prices, but with a risk management level that is uncomfortably far away. This can make it difficult to take a position with meaningful, but appropriate size.
There are tactics available to improve the setup.
How? Multiple timeframe analysis.
Derrick Oldensmith, Senior Trader at T3 Trading, often shares the phrase, “day trade risk for swing trade reward.”
The late Rob Smith of The Strat trading style often talked about full timeframe continuity. What he meant was that the stock was moving in unison on all different time frames. For instance; five-minute, hourly, daily, and weekly charts.
Brian Shannon wrote the book Technical Analysis Using Multiple Timeframes. He often shares a view of a five-day moving average on a 30-minute chart.
All of these techniques can be incredibly useful as we seek to skew the reward-to-risk relationship further in our favor.
By identifying patterns and support or resistance levels across multiple chart time frames we can identify low-risk entry opportunities that have much more upside potential.
Two recent examples
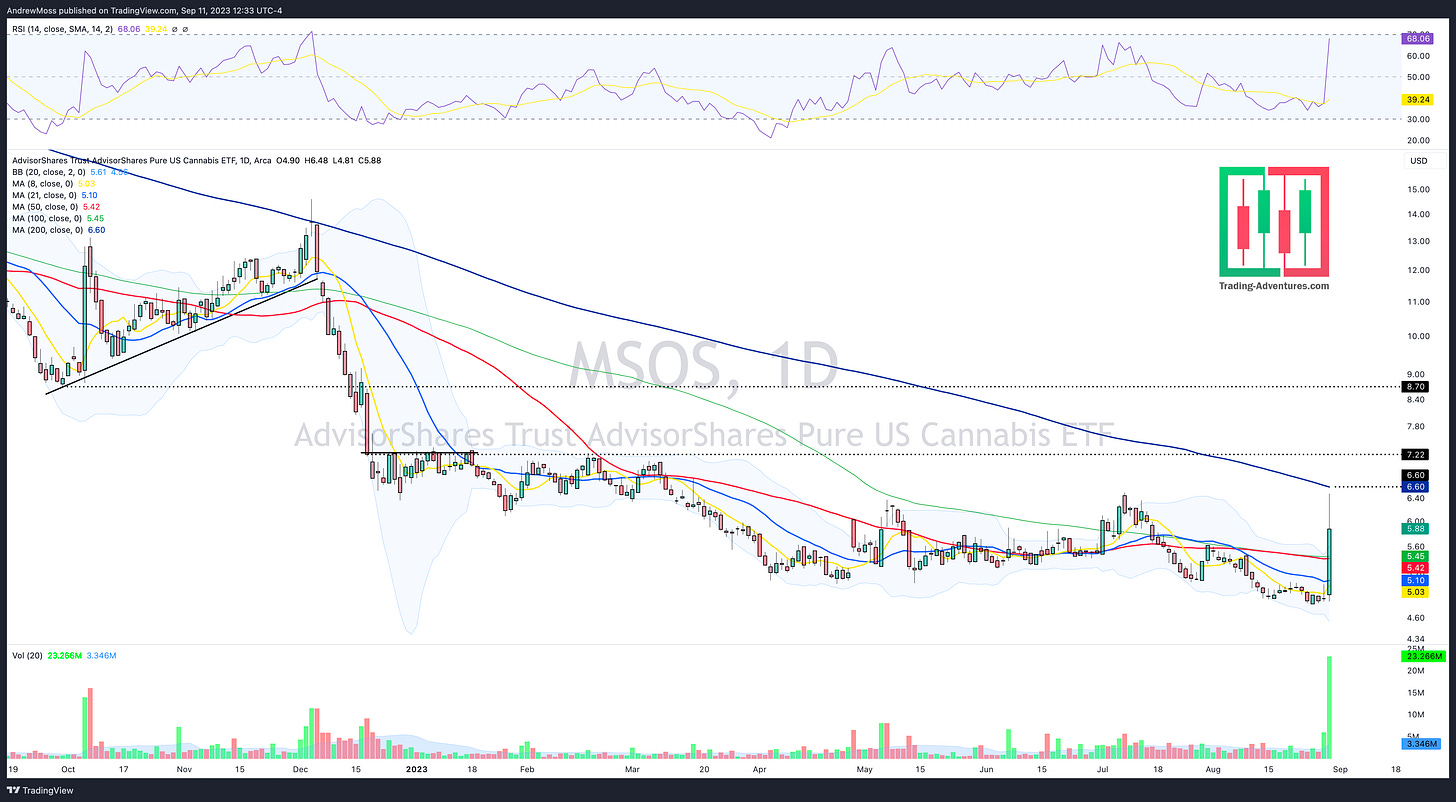
MSOS recently came alive on news of potentially favorable cannabis legislation. The ETF moved up 33% quickly and then settled in to close the day up roughly 20%, clearly signaling a change of mood.
Traders looking to buy the momentum may have struggled while trying to find a suitable level for their stop order. The recent daily low could make sense, but with that price all the down at $4.78, it wouldn’t allow for much of a position size.
With potential targets higher at $6.60 (the 200-day MA), or pivots at $7.22 and $8.70, the reward-to-risk ratio is not attractive. And that assumes that an opportunity to buy near the daily close shows up the next day.
The trading plan can be improved by moving into a 30-minute chart. Here we can see the intraday consolidation after the big move, showing another potential risk management level. Buying a breakout of that pattern the next day presented a much better reward/risk using the same target levels above.
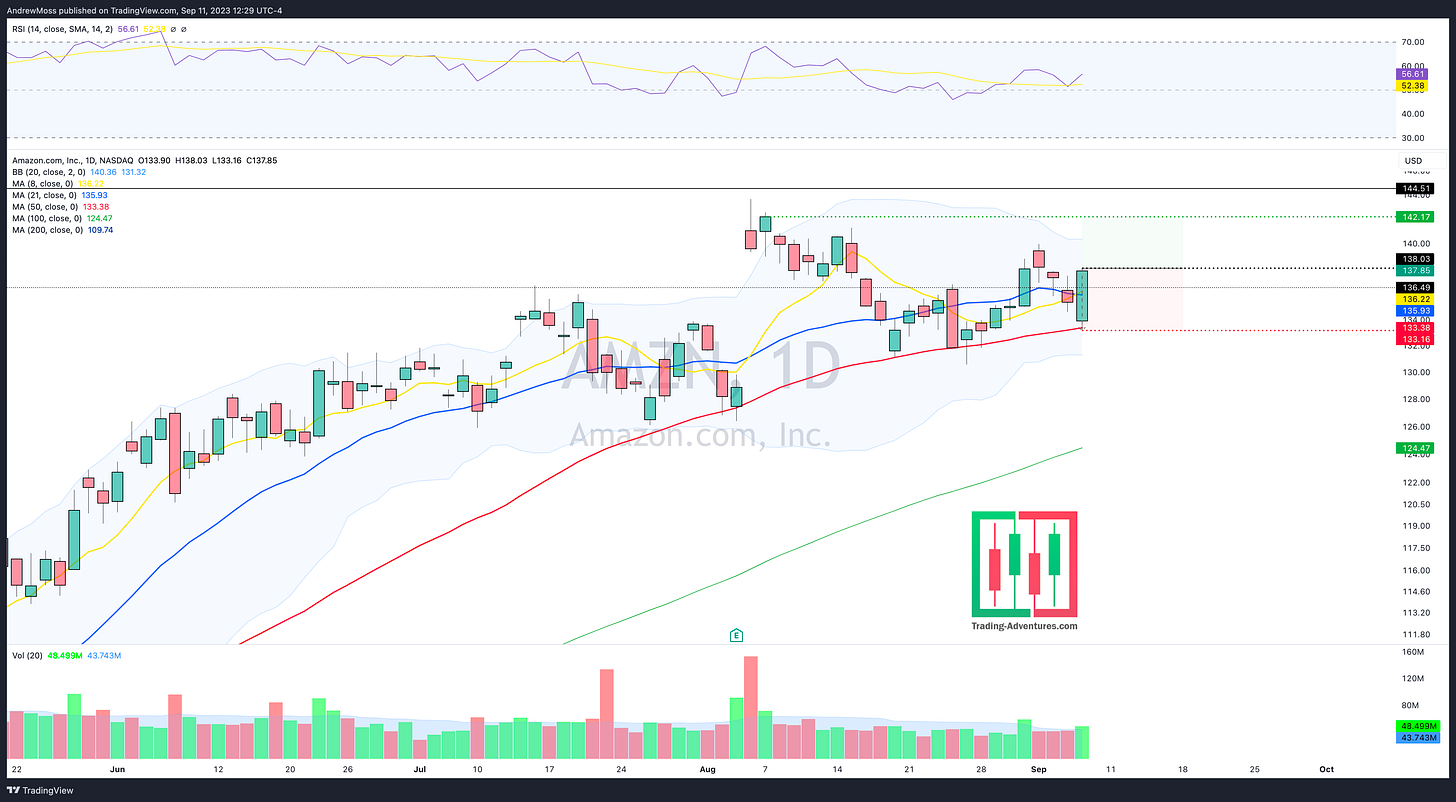
AMZN had a huge reversal bar last week, moving lower and touching the 50-day MA before coming back up past the close of the previous two days. These abrupt changes can be good signals to take a long position. But with such a large move already in place, some traders may have been hesitant to take a position due to the wide risk between the potential entry price and the suitable stop level, nearly $5.
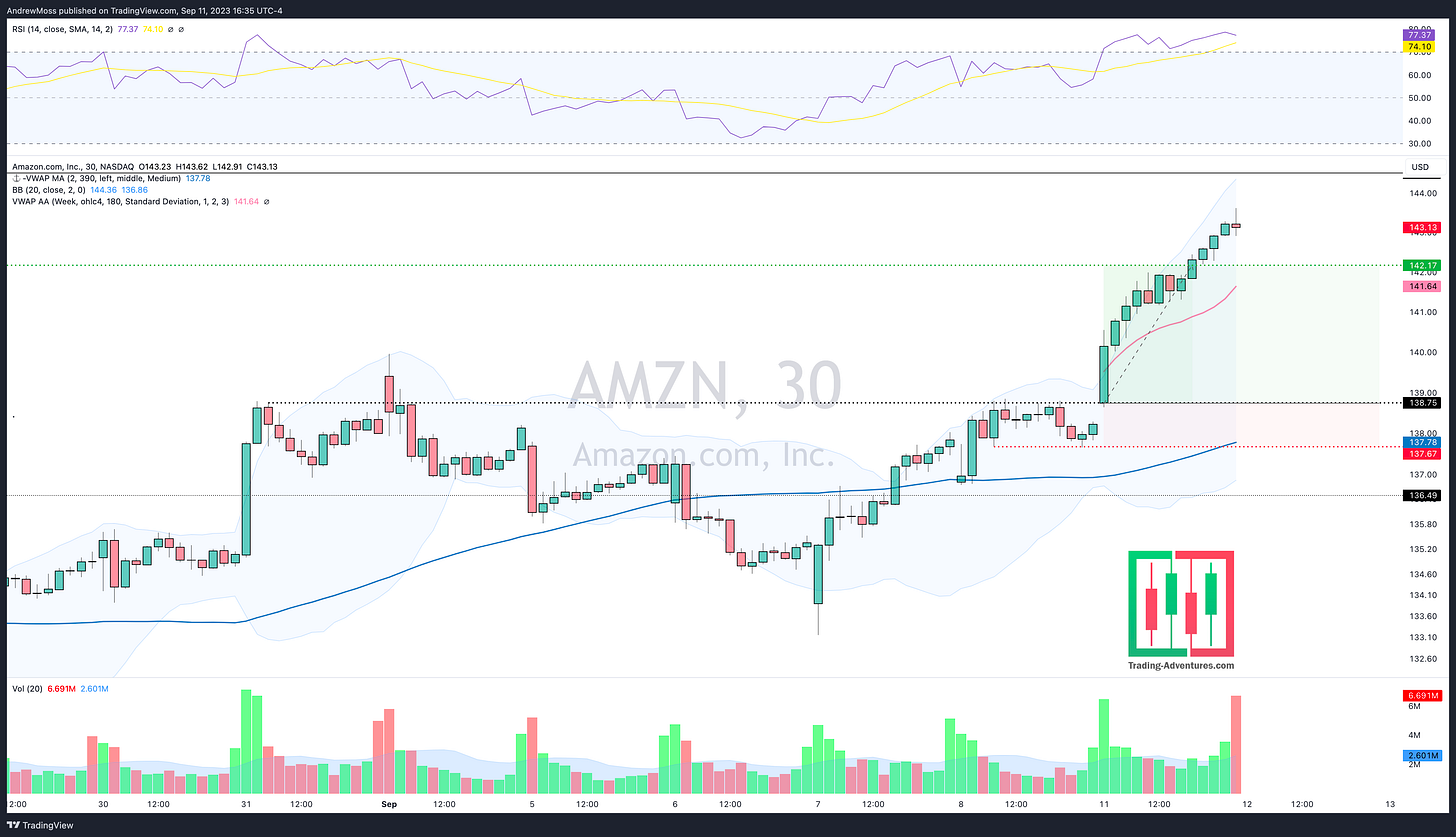
Looking at the 30-minute chart we can improve the trading game plan by observing the price action near recent pivot highs and the consolidation action just ahead of that level.
When the stock jumped it rose quickly to the resistance level and then consolidated well for several hours. This set up the potential breakout well and gave a tighter risk management level for the protective stop.
These examples demonstrate a principle that works across many different styles and timeframes.
Weekly > daily
Daily > 30-minute
Hourly > 2-minute
The approach is the same. Use one timeframe to identify the potential move and trade setup. Then zoom in to a smaller timeframe to fine-tune for precision entries and risk management.
The Charts
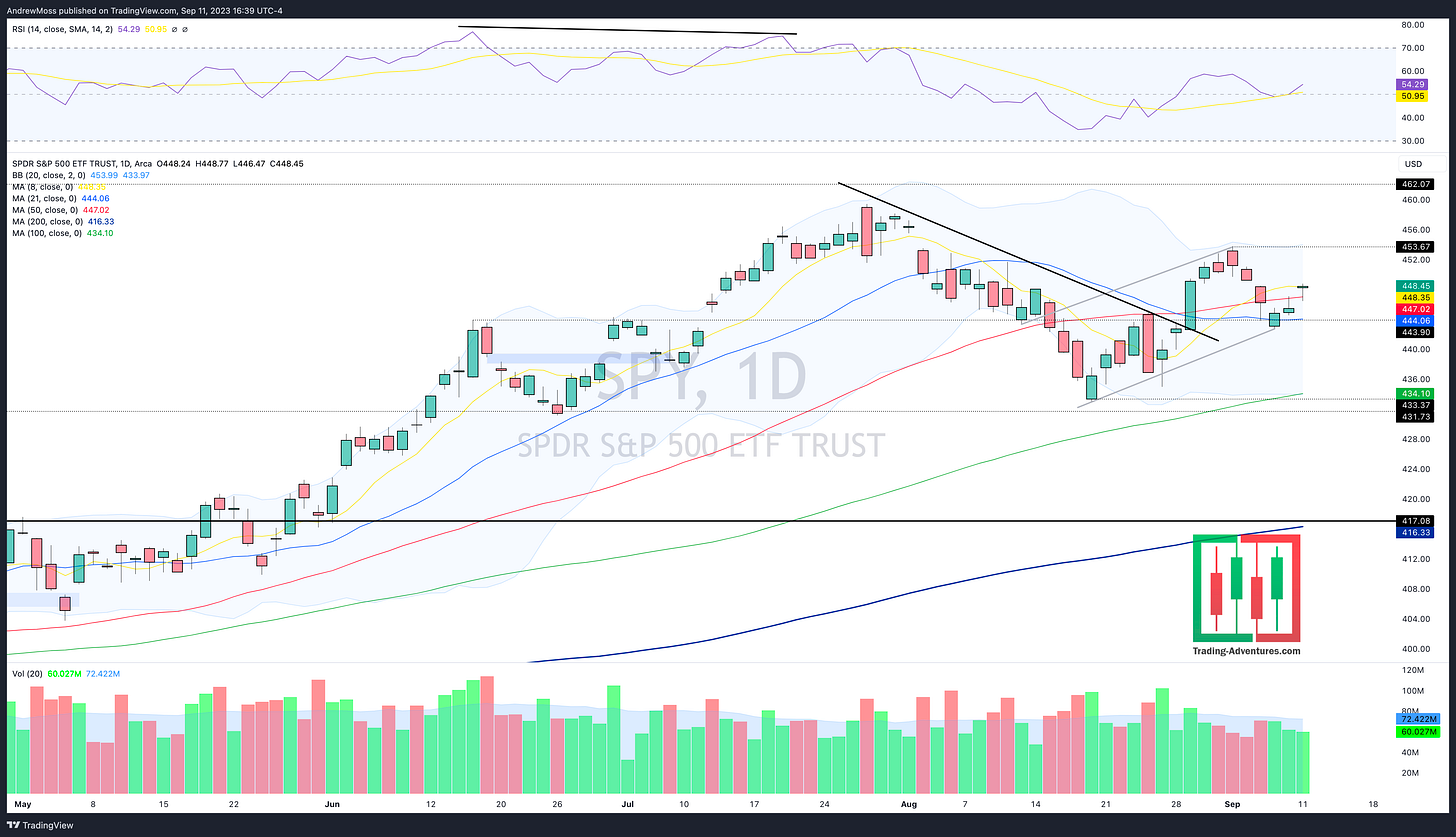
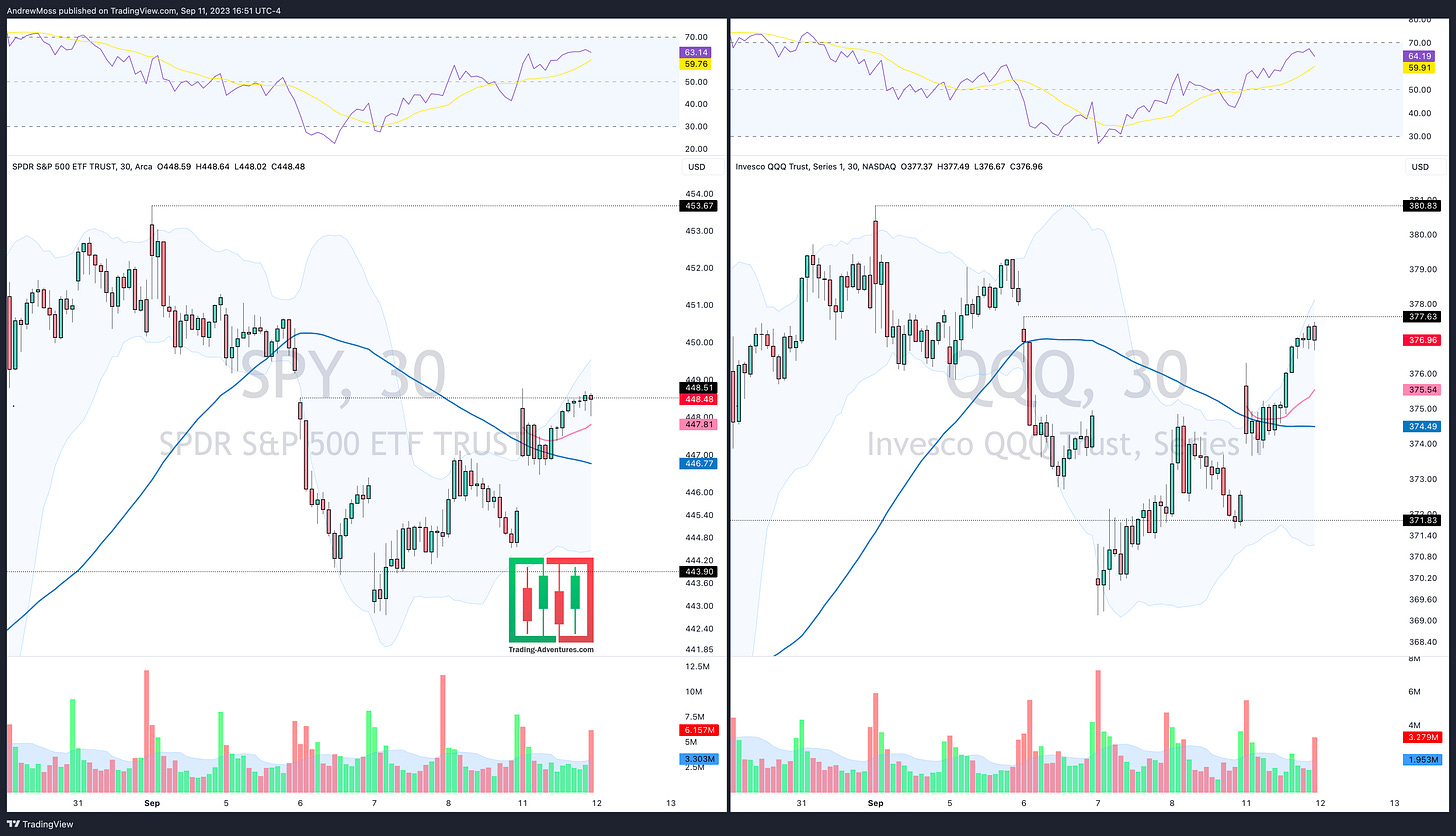
SPY moved around on either side of the 50-day MA this morning before rallying to close the day above the 8-day MA. That leaves it above all of the key moving averages and opens the door for more movement higher.
Now we can focus on the $453.67 pivot overhead with the 8/21/50-day MAs as potential support below.
QQQ made similar progress and will need to clear the $380.83 pivot next.
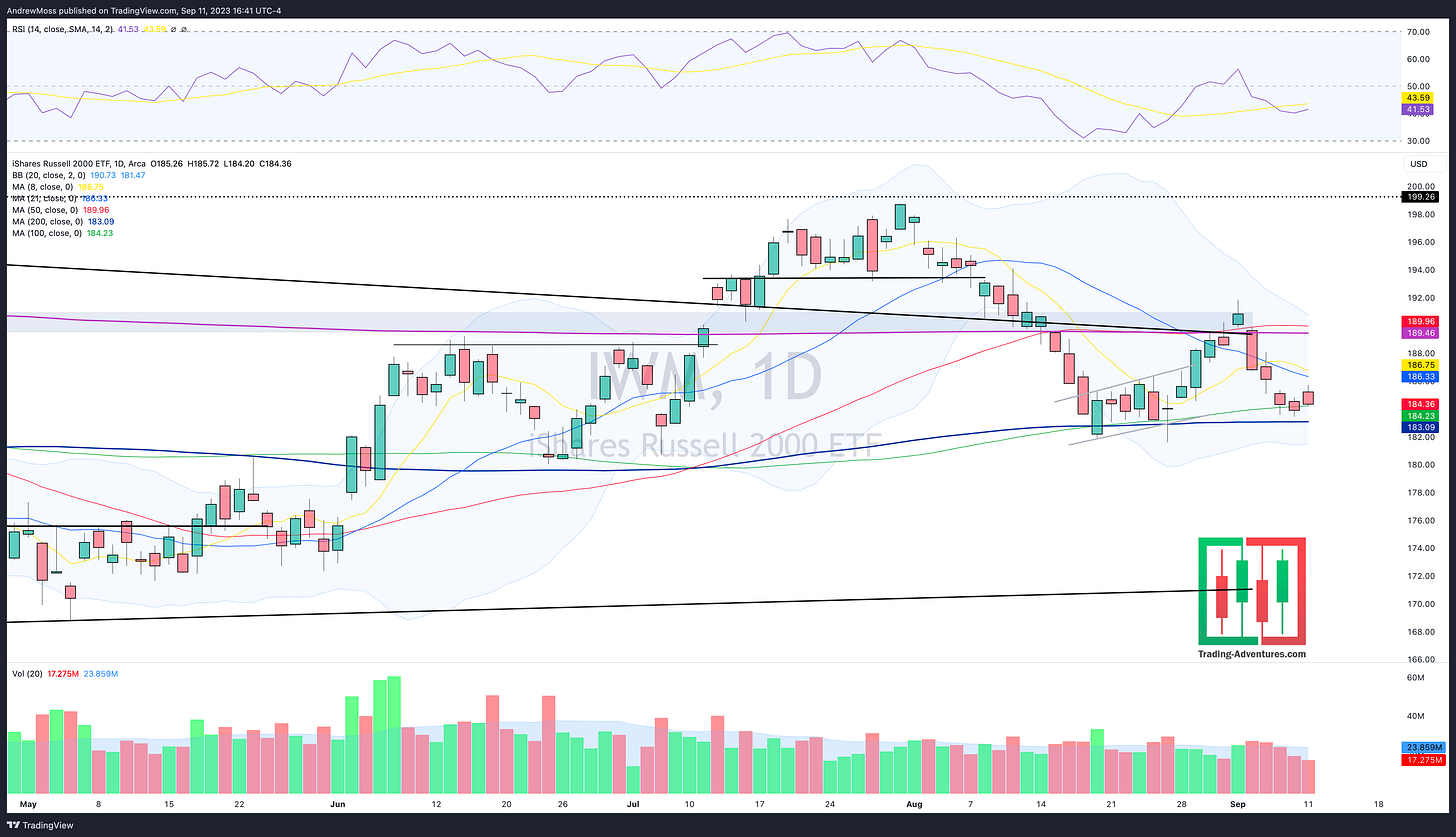
IWM has been the ugly index and today didn’t change that. Looking for positives; it did stay above the 100-day MA and Friday’s close.
Now the 100 and 200-day MAs need to continue to be support. And a move higher will have to test the 8/21/50-day MAs.
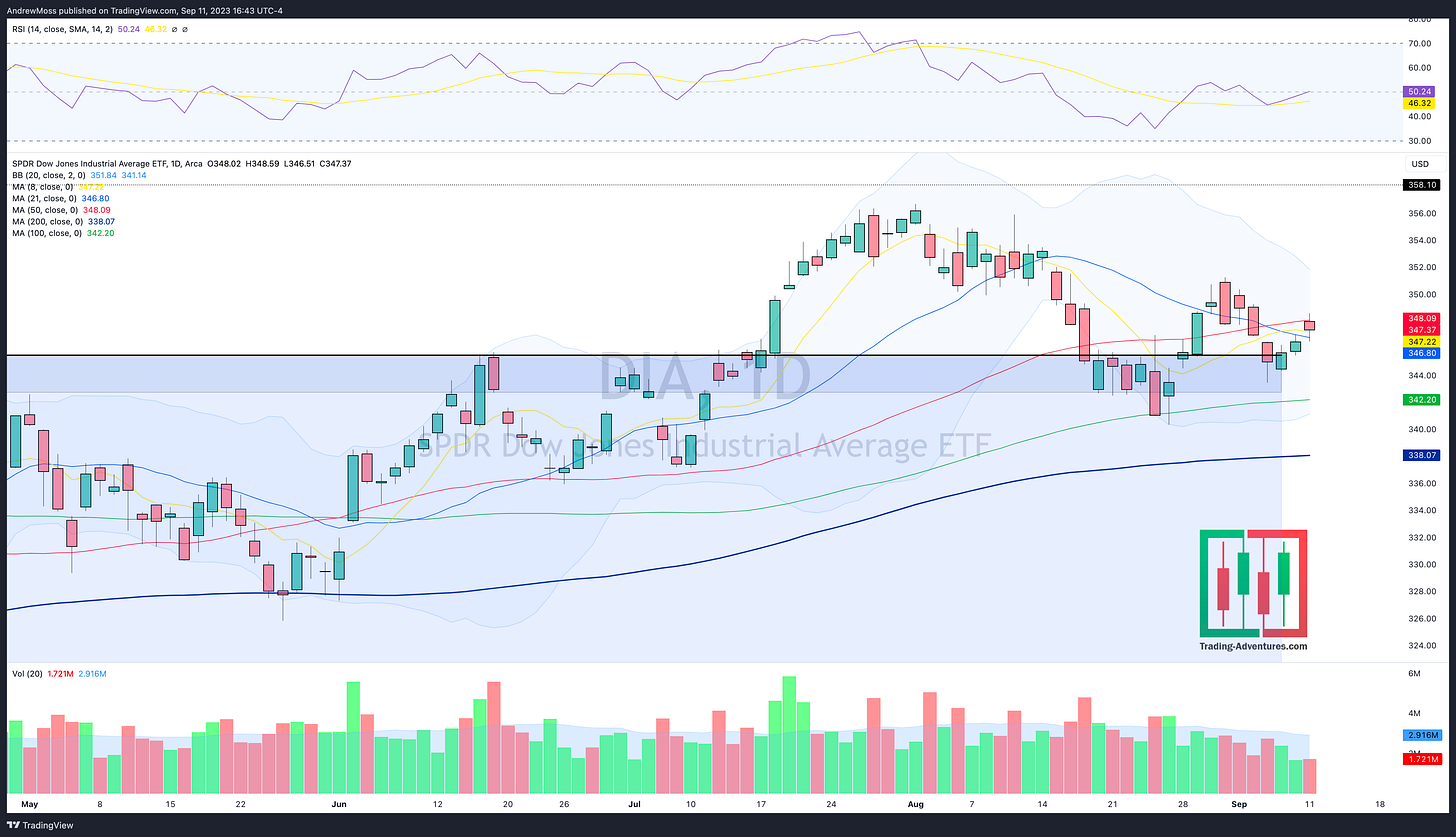
DIA Is higher from Friday’s close and now between the 8 and 50-day MAs. Hope for saving the failed breakout isn’t lost yet.
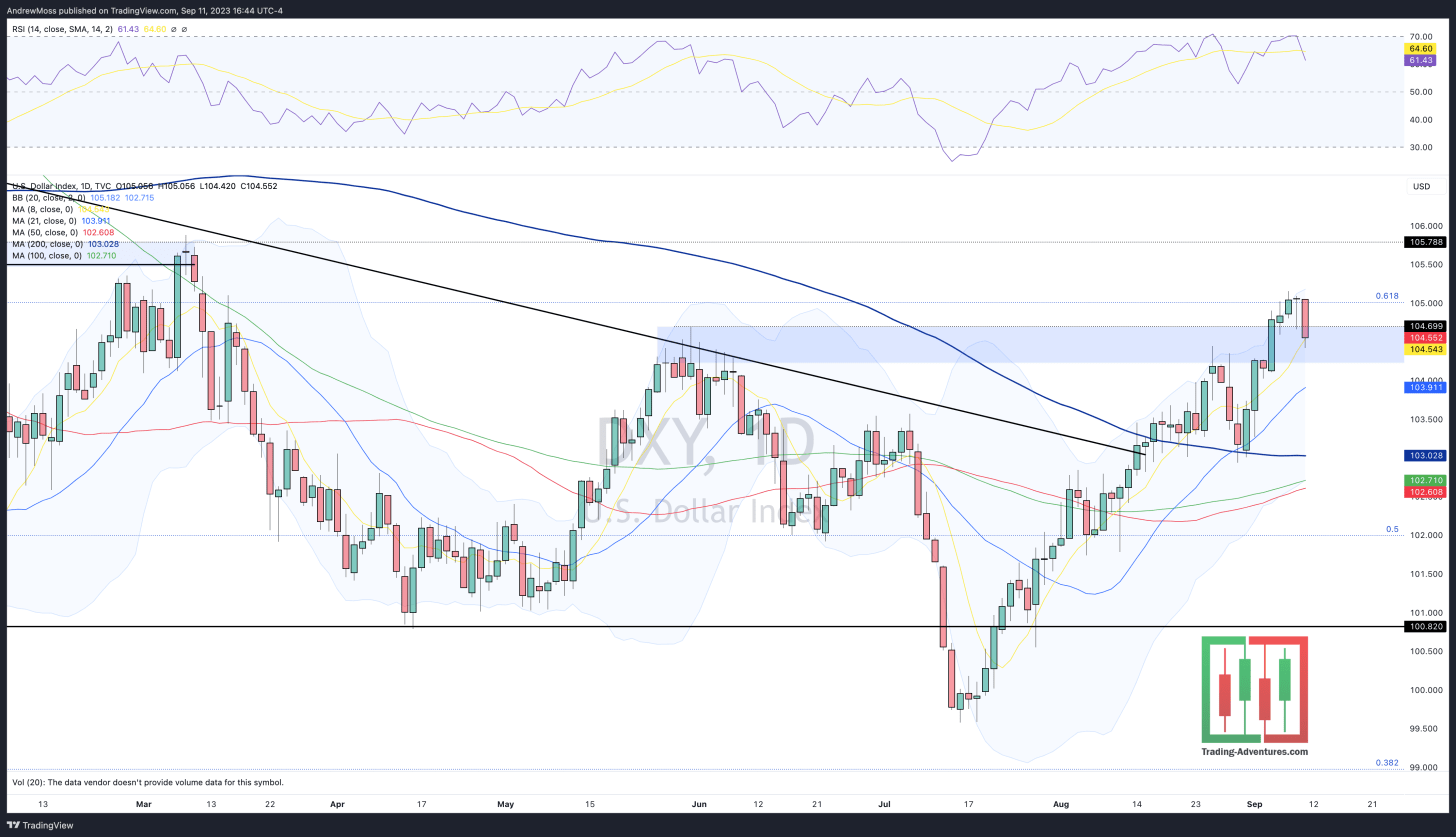
DXY A rest for the US Dollar contributed to stocks’ ability to move higher. It’s on the 8-day MA and in a previous congestion zone now. Follow-through lower will be welcomed by stock bulls.
The Closing Bell
Stocks continue to build momentum higher and add the case that the bottom of this summer-time dip has been made.
To watch more closely, take a look at the 30-minute chart and the 5-day MA. We start the week testing that average and moving higher and into some pivots.
More updates on Twitter/X (follow here) throughout the week. We do have CPI data coming Wednesday. And we’ll check in here again Thursday to see how things have progressed.
The Disclosures
***This is NOT financial advice. NOT a recommendation to buy, sell, or trade any security. The content presented here is intended for educational purposes only.
Andrew Moss is an associated member of T3 Trading Group, LLC (“T3TG”) a SEC registered broker/dealer and member of FINRA/SIPC. All trades placed by Mr. Moss are done through T3TG.
Statements in this article represent the opinions of that person only and do not necessarily reflect the opinions of T3TG or any other person associated with T3TG.
It is possible that Mr. Moss may hold an investment position (or may be contemplating holding an investment position) that is inconsistent with the information provided or the opinion being expressed. This may reflect the financial or other circumstances of the individual or it may reflect some other consideration. Readers of this article should take this into account when evaluating the information provided or the opinions being expressed.
All investments are subject to the risk of loss, which you should consider in making any investment decisions. Readers of this article should consult with their financial advisors, attorneys, accountants, or other qualified investors prior to making any investment decision.
POSITION DISCLOSURE
September 11, 2023, 4:00 PM
Long: NFLX, QQQ, SPY, TSLA
Short:
Options symbols are denoted as follows:
Ticker, Date, Call/Put, Strike Price
Example: VXX1218C30 = VXX 12/18 Call with a $30 strike


