Zooming Out
Monday Market Update October 30, 2023
The Markets
As traders, we can get hyper-focused on the minute-to-minute action. Which can lead to the proverbial missing the forest for the trees. To counteract that we simply need to expand our field of view. This is easily done by considering multiple timeframes on the charts.
I the primary view is a daily chart, go to the weekly. Look at weeklies mostly. Then move to the monthly charts.
Zooming out for perspective is a critical part of my process. As primarily a swing trader, daily and 30-minute charts are my main tools. Weekly charts are the next logical view.
For that reason, every Saturday morning I publish a list of weekly charts on X (formerly Twitter). You may have seen it mentioned in these pages.
For today’s update, the market action doesn’t change the overall technical picture much since we looked at the Break Down last Thursday. And since I don’t know how many readers view the weekly chart thread regularly, I thought I’d share that analysis here.
Weekly Chart Thread
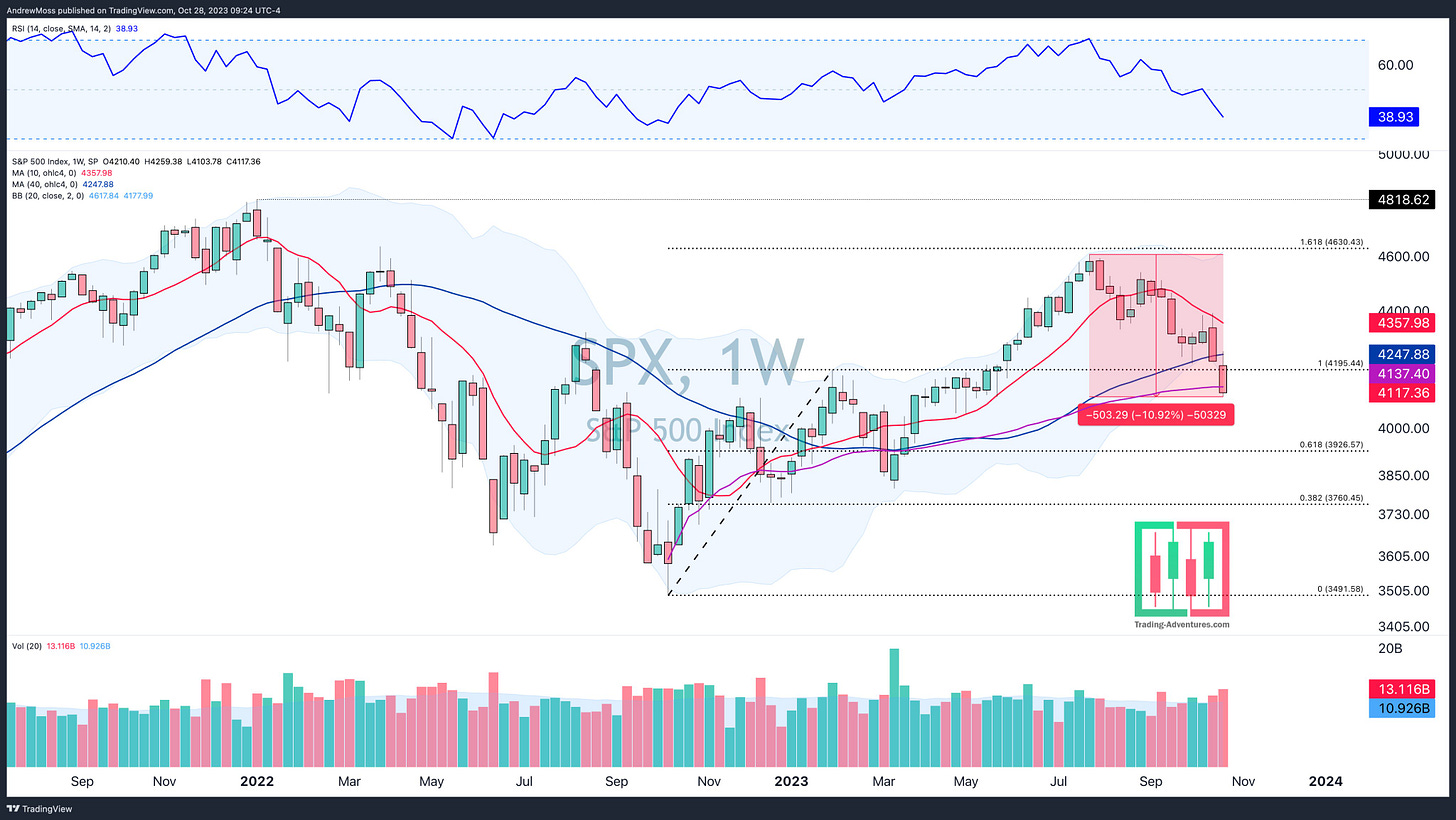
SPX
The Bears showed up last week sending the SP500 down.
It is now:
Below the 40-week MA
Below the $4200 breakout
Below the 10/2022 low AVWAP
Into correction territory -10%
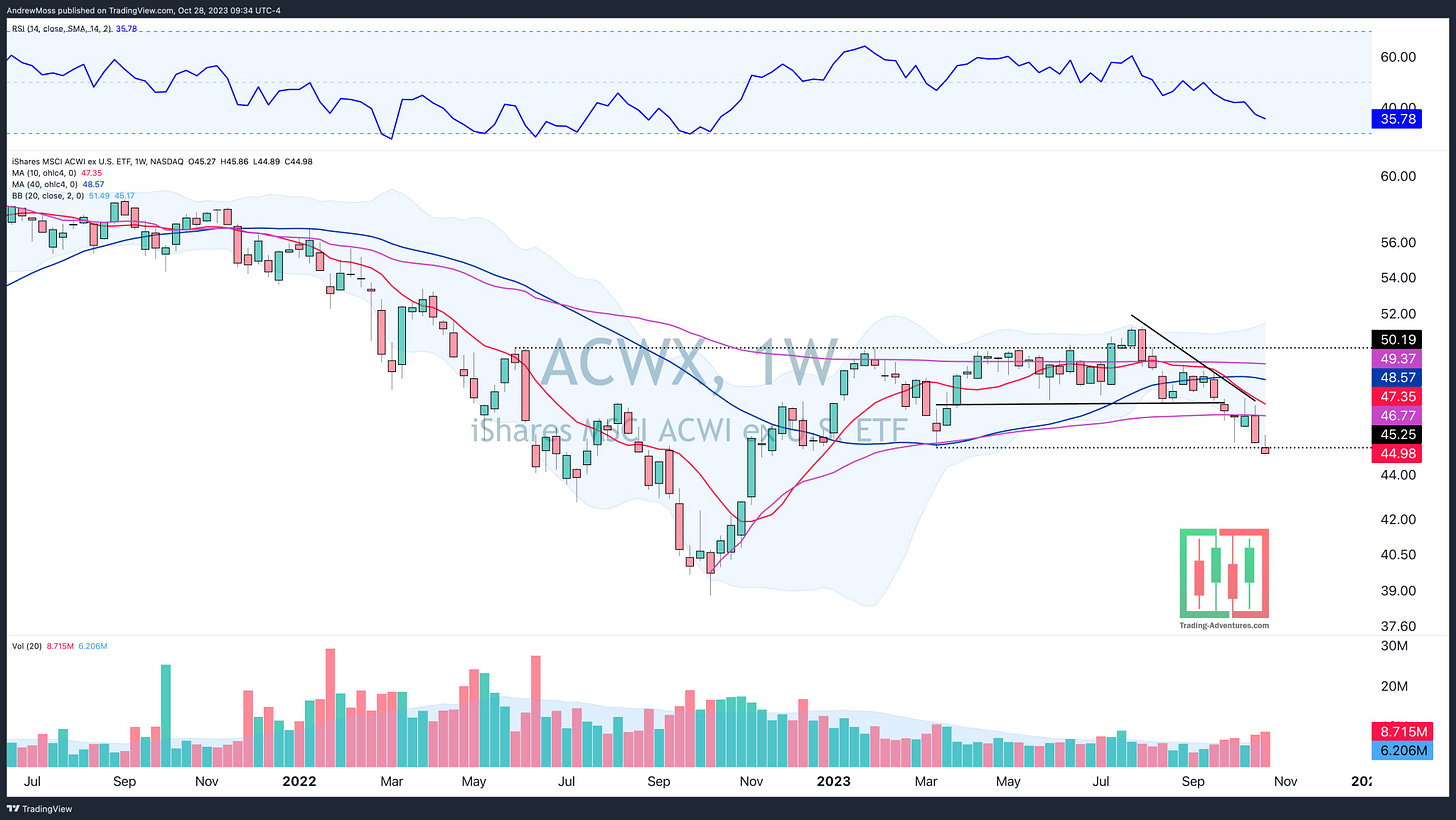
ACWX
The Rest Of The World went down too. The $44.25 pivot did not provide support. Plenty of room below and RSI has not yet reached oversold status.
TLT
Treasury Bonds caught a bid this week as volume continues to be well above average. Still no sign of a meaningful reversal yet though.
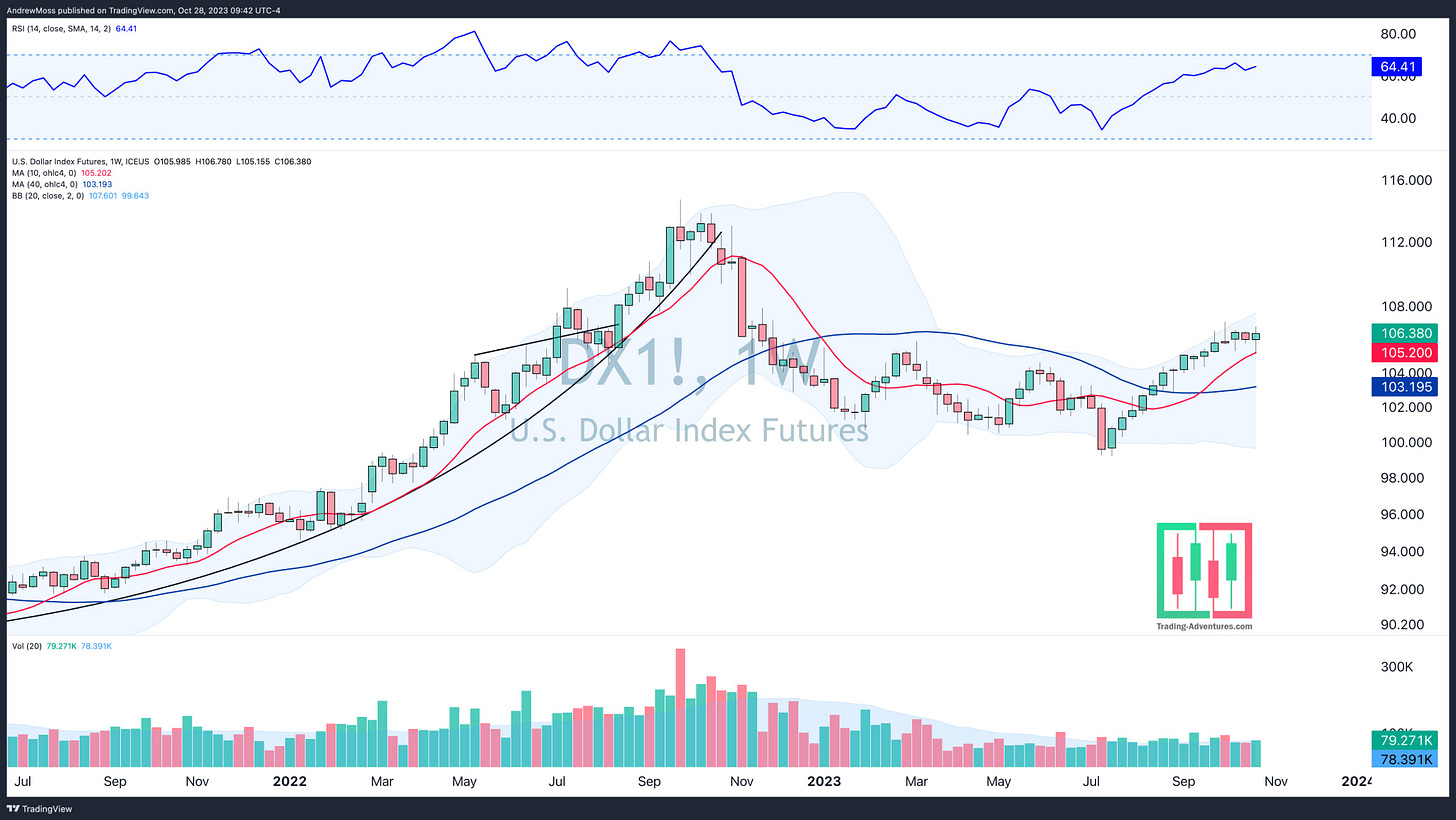
DXY
US Dollar Futures were flat for the 3rd week.
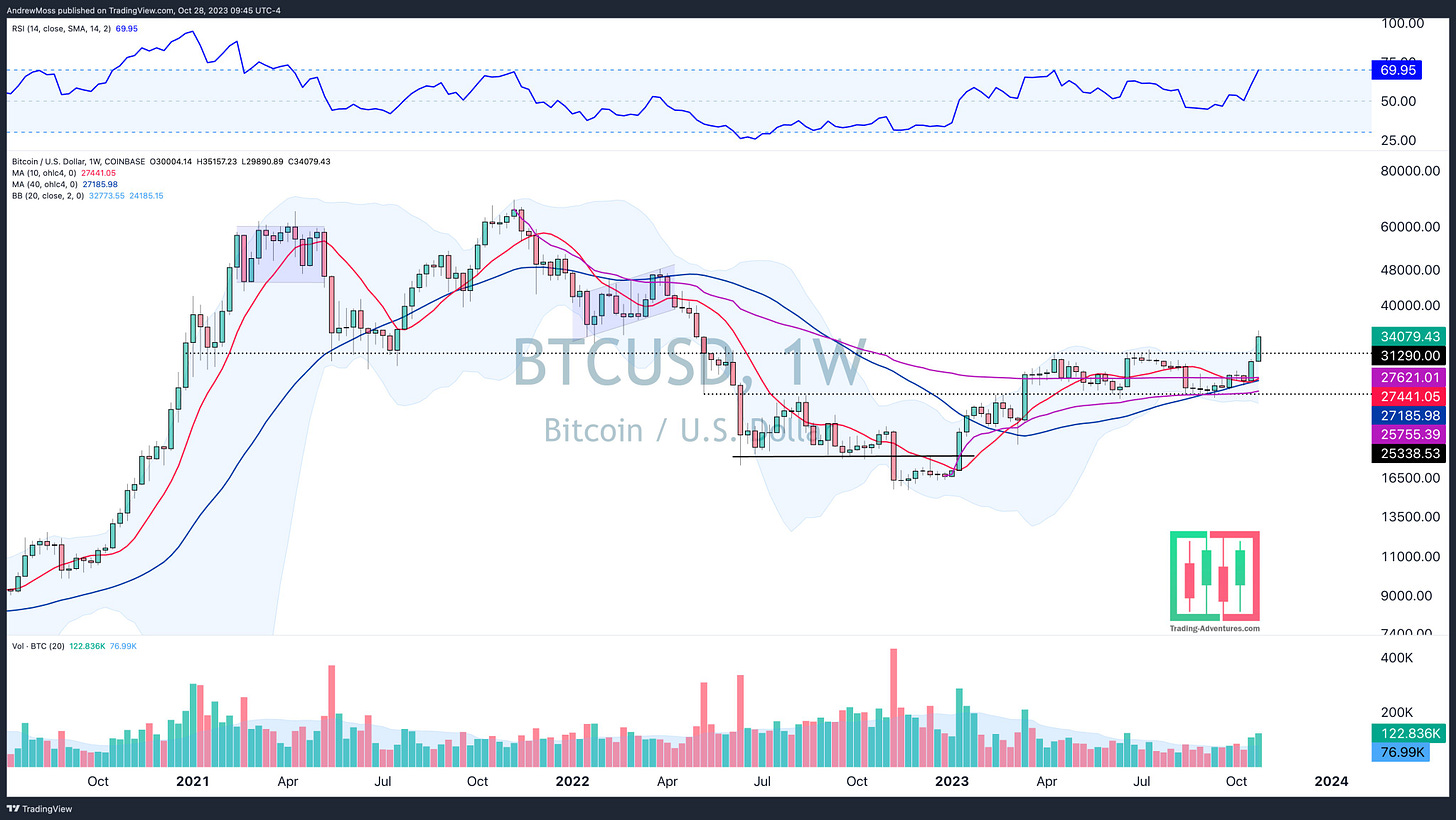
BTCUSD
Bitcoin momentum continued and it finally broke out of its 8-month range.
A Look At Market Breadth
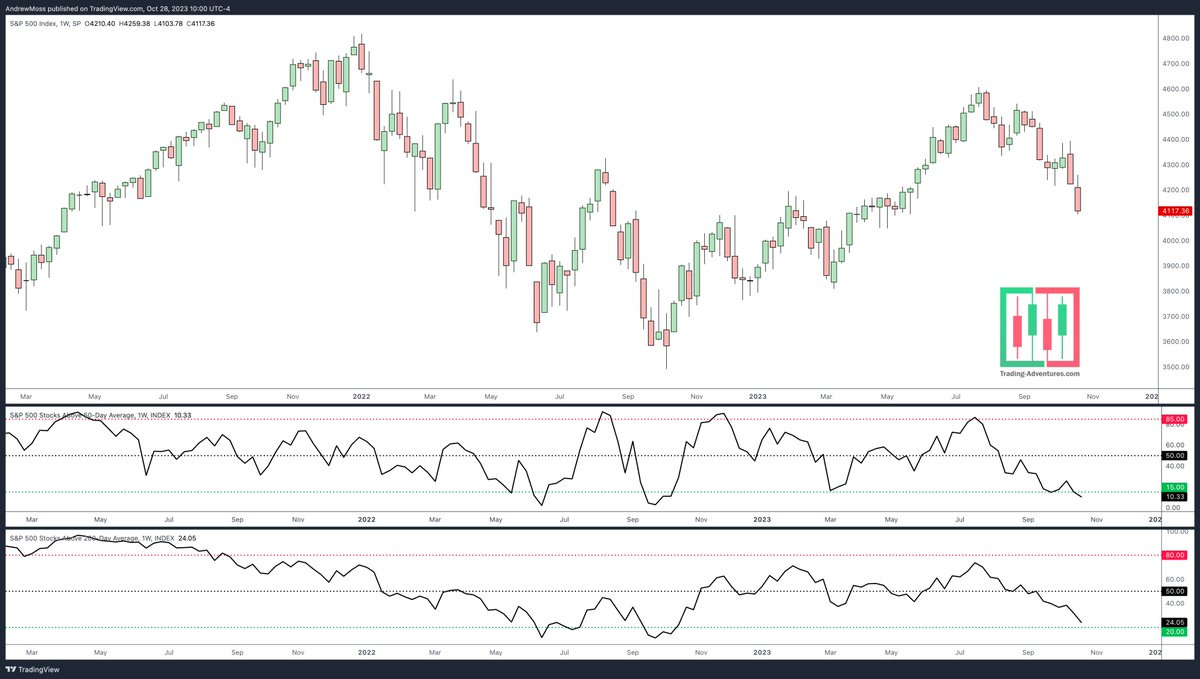
The percentage of SP500 stocks above their 50 and 200-day MAs is low.
Only 10% are above the 50-day MA
Less than 24% are above the 200-day MA
Getting pretty washed out.
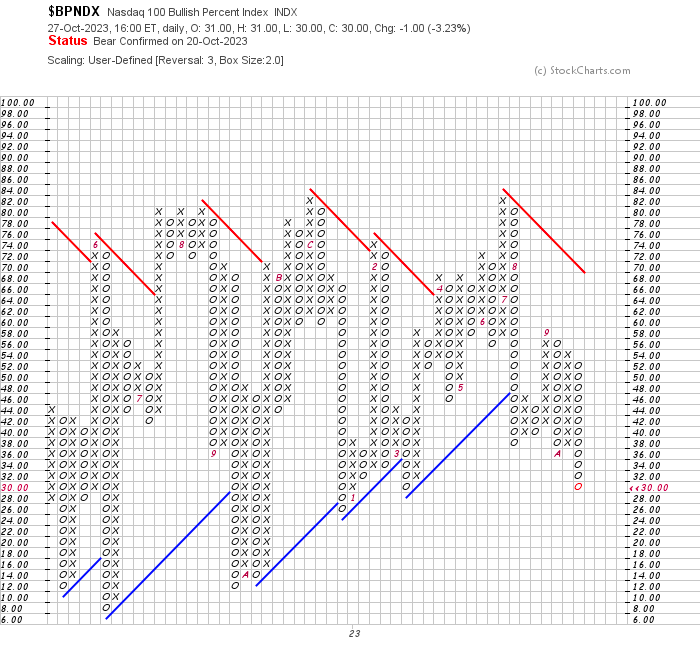
Bullish Percent Indexes measure the % of stocks showing a buy signal on a Point & Figure chart. When few stocks are on a buy signal, that means many must be showing a sell signal. When many stocks have already been sold, buyers may be closer to stepping in.
BPSPX = 23
NASDAQ 100 stocks QQQ
BPNDX = 30
BPNYA = 29.42
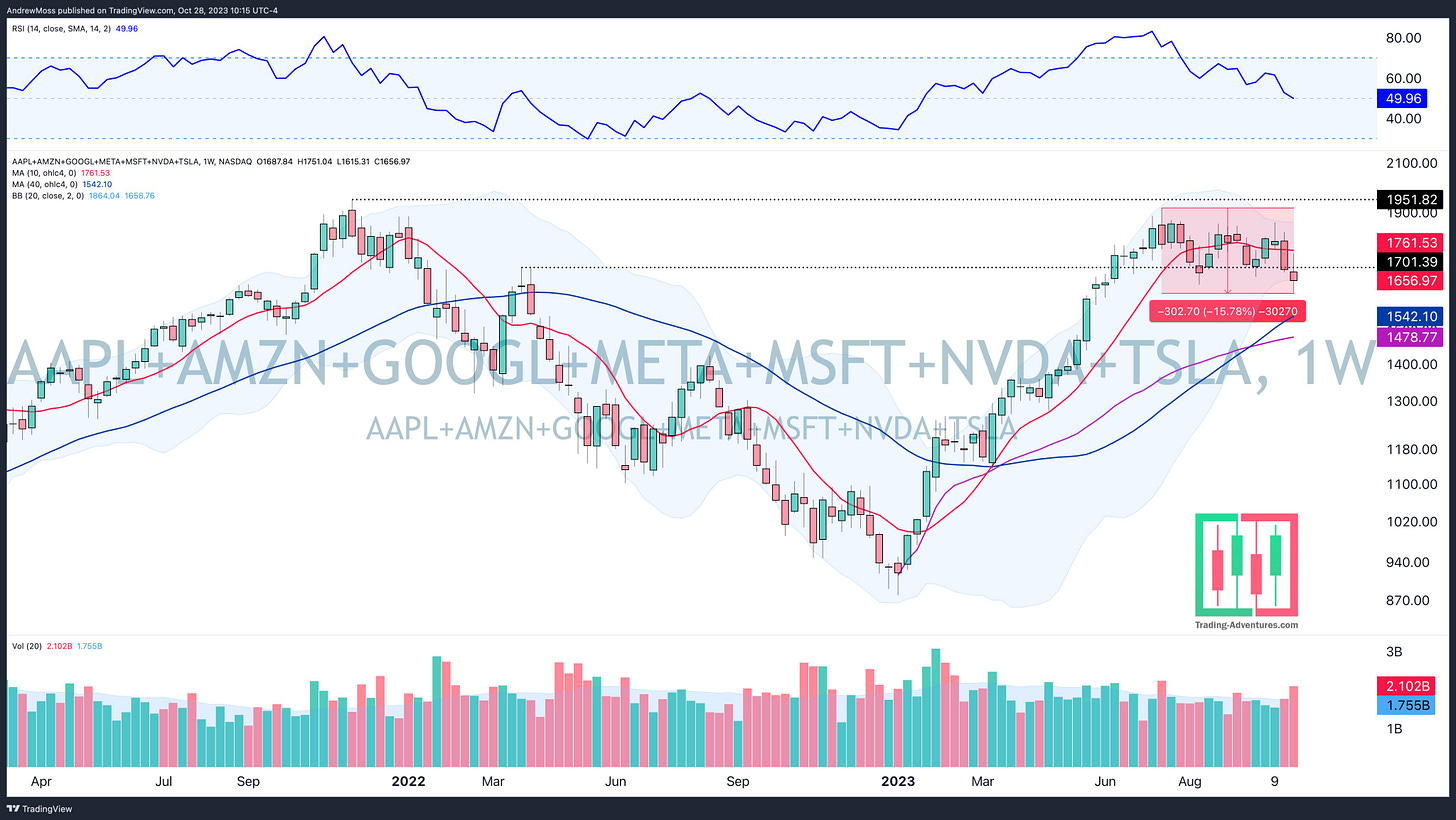
Stocks are broadly getting sold. Even the Magnificent 7 are finally coming down. AAPL AMZN GOOGL META MSFT NVDA TSLA
This is a custom index of those 7 stocks, equally weighted. It’s down as much as -15.78% from recent highs made in June.
Putting it all together
Breadth is weak
Indexes are down 10% or more
Few stocks are above their 50 and 200-day MAs
Few stocks show a PnF buy signal
Even the leaders are getting sold
Not saying the bottom is in. However, often all of these boxes must be checked before we can look for a bottom. Now they have been.
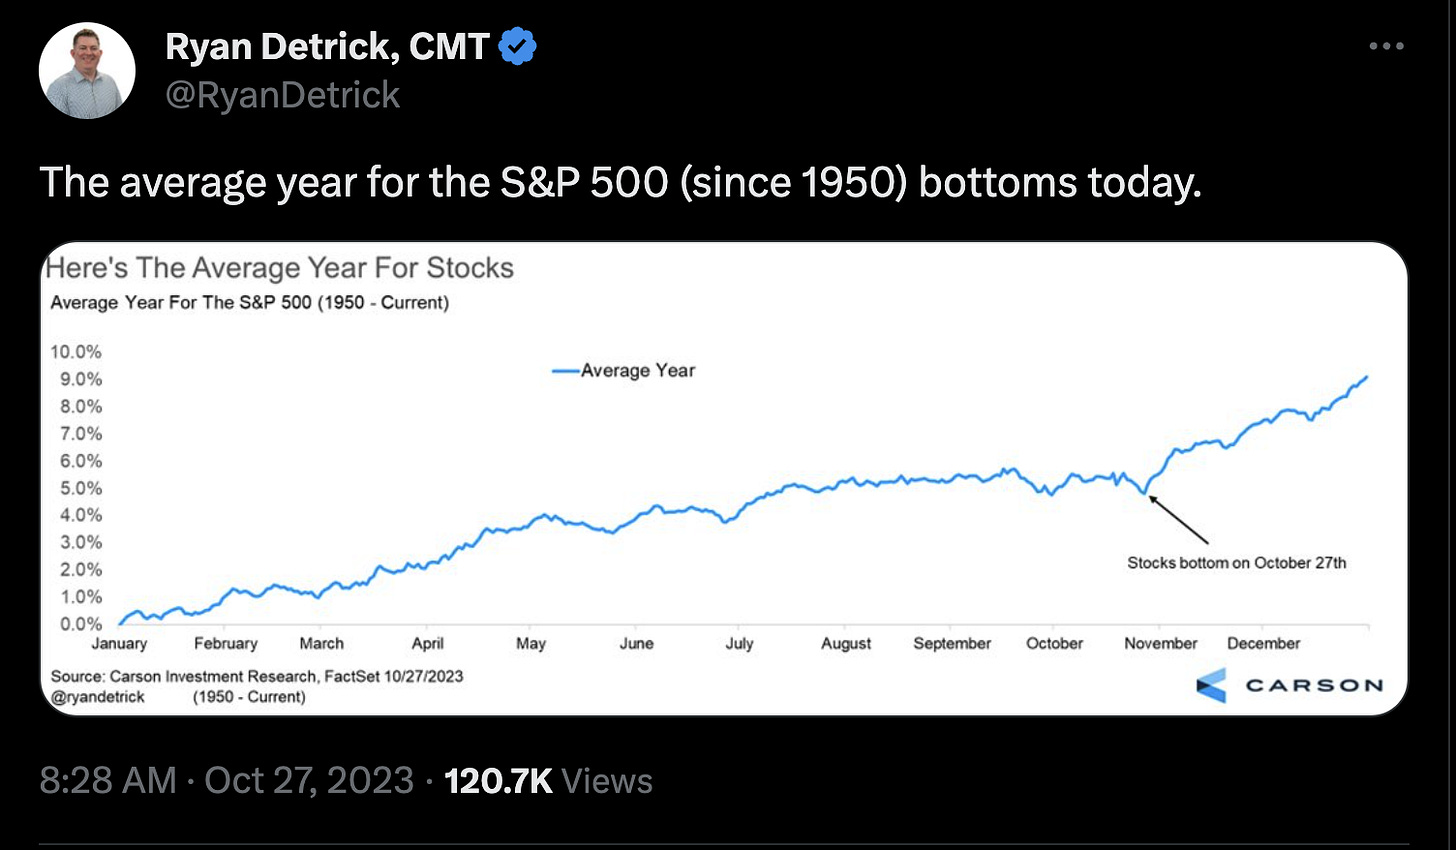
Now consider this. In a year that has tracked the seasonal patterns so well, would it really be surprising if it kept doing that through year-end?
There will be bounces. It’s not if, but when.
Who knows which one will end up being the bottom? It’s impossible to declare until after the fact.
Don’t predict.
Do follow the price and keep an open mind.
Those are many, but not all of the charts from the weekly rundown. You can view the rest here - Weekly Charts on X
If you don’t check it every Saturday, I do suggest it. Or do your own weekly charts. Either way, analyzing multiple timeframes is s critical task.
The Charts
One chart for the daily update today.
VT - Vanguard Total World Stock Index
Since Thursday’s update, we saw stocks dip sharply Friday. Today there is a relief rally. We’ll see whether it holds up to the slew of earnings and economic data coming this week.
The Closing Bell
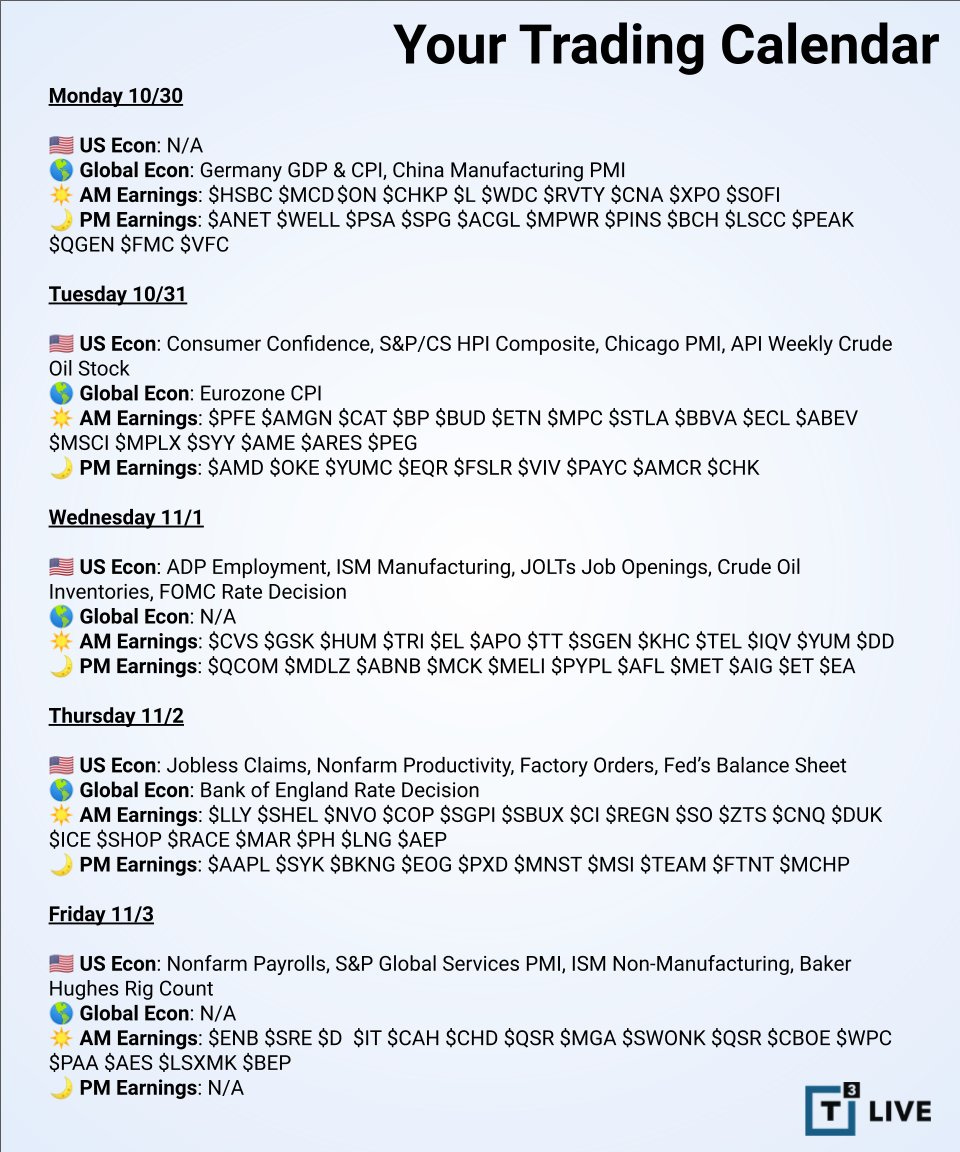
The calendar is busy.
We have earnings from Pfizer, Amgen, Caterpillar, AMD, Qualcomm, Paypal, and of course the big one on Thursday, Apple.
We also have Jerome Powell and the FOMC on Wednesday.
And Nonfarm Payrolls Friday.
Back with more later this week.
The Disclosures
***This is NOT financial advice. NOT a recommendation to buy, sell, or trade any security. The content presented here is intended for educational purposes only.
Andrew Moss is an associated member of T3 Trading Group, LLC (“T3TG”) a SEC registered broker/dealer and member of FINRA/SIPC. All trades placed by Mr. Moss are done through T3TG.
Statements in this article represent the opinions of that person only and do not necessarily reflect the opinions of T3TG or any other person associated with T3TG.
It is possible that Mr. Moss may hold an investment position (or may be contemplating holding an investment position) that is inconsistent with the information provided or the opinion being expressed. This may reflect the financial or other circumstances of the individual or it may reflect some other consideration. Readers of this article should take this into account when evaluating the information provided or the opinions being expressed.
All investments are subject to the risk of loss, which you should consider in making any investment decisions. Readers of this article should consult with their financial advisors, attorneys, accountants, or other qualified investors prior to making any investment decision.
POSITION DISCLOSURE
August 24, 2023, 4:00 PM
Long: UNH1103C530
Short:
Options symbols are denoted as follows:
Ticker, Date, Call/Put, Strike Price
Example: VXX1218C30 = VXX 12/18 Call with a $30 strike






Right , Mike Webster big post was about that also , when in doubt- zooming out helps to see much bigger pics . Thanks for the reminder
good post Andrew.. are you a bit concerned that TLT is continuing to sink.. this higher long term yields - will put even MORE pressure on present value discount rate models for stocks.. and for those companies that do need to borrow money the WACC becomes higher.. all putting even greater pressure on stocks and the consumer of course