CPI > PPI > TMI?
Weekend Market Review February 17, 2023
The Markets
Just when it looked like the markets were about to get over the “waiting for the next hot announcement” habit another inflation measure hit and we just couldn’t help ourselves.
CPI (the Consumer Price Index) was announced Tuesday morning. It was a little hotter than expected. But the market shrugged it off.
PPI (the Producer Price Index) was announced Thursday morning, likewise coming in a bit higher than anticipated. That drove stocks down initially but then an impressive rebound carried prices back up near the higher end of the week’s range.
Then, late in the day, Fed Official James Bullard hinted at the possibility of another 50 bps rate hike (as opposed to 25 bps) and stocks erased the rally.
Brian Lund summarized thusly:
Today we learned something important about the current state of the market; it can only shrug off one bad piece of macro data per day, but not two.
That selling carried through into today and now this Friday looks very much like last Friday. And once again, we’ve seen a strong rally into the end of the day giving yet another instance of classic bull market action.
The previous Friday gave way to a strong move the following (this past) Monday. We will have to wait and see what the holiday-shortened week brings.
Technically, the picture was at risk of degrading a bit with SPY below its 21 EMA, and both it and the 8 EMA now rounding over and pointing lower. But the late-day rally carried it back above the 21 EMA.
QQQ and IWM were even stronger as they never even dipped below the 21 EMA at all.
Again, the late-day rally is a show of strength for the bulls. But this market hasn’t had much of a habit of making anything obvious. So we could see action in either direction next week.
One thing remains constant. Like the Fed, the market continues to be very data-dependent. Each announcement, press conference, and economic news item has been anticipated, pounced on, or cowered around.
TMI - Too much information
At some point, enough will be enough and the short-term, news-driven fluctuations will give way to larger, macro themes. We may not be there yet. But maybe we’re getting a little closer.
Being able to shrug off one piece of data is better than none.
A quick check on seasonality:
JC Parets points out that this is exactly what we should expect in February.
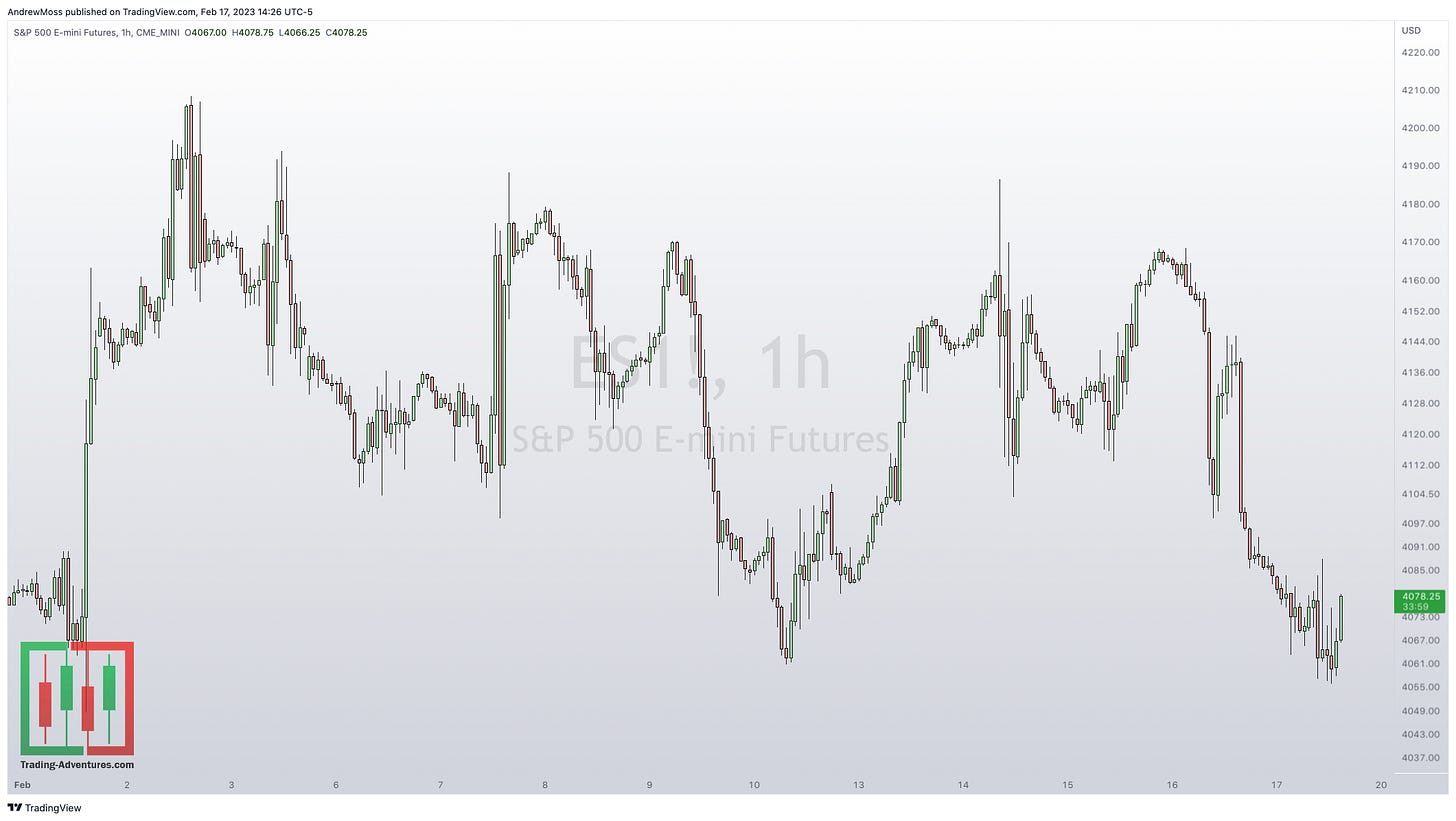
He goes on to compare to a chart of SP Futures for the month, which is recreated here.
Pretty decent similarity to the historical norm.
The Charts
SPY - Moved below the 21 EMA and last Friday’s low before rallying to close stronger.
QQQ - Is stronger and stayed above its 21 EMA and last Friday’s low.
IWM - Is also stronger and holds above the support zone.
DIA - Potential red flag as the Dow 30 broke the uptrend line. However, closing above $335 and the 50-day MA shows strength. So its still a bit undecided here.
DXY - The Dollar has been rising but not in an explosive fashion. See if today’s reversal gives way to lower prices next week.
VIX - Continues to chop around, rising into announcements, and falling once the unknown becomes known.
Wrapping it up
Don’t forget the weekend weekly charts - a great chance to zoom out and consider the bigger picture.
Find it here every Saturday morning. @Andy__Moss on Twitter
And tell a friend!
***This is NOT financial advice. NOT a recommendation to buy, sell, or trade any security. The content presented here is intended for educational purposes only.
Andrew Moss is an associated member of T3 Trading Group, LLC (“T3TG”) a SEC registered broker/dealer and member of FINRA/SIPC. All trades placed by Mr. Moss are done through T3TG.
Statements in this article represent the opinions of that person only and do not necessarily reflect the opinions of T3TG or any other person associated with T3TG.
It is possible that Mr. Moss may hold an investment position (or may be contemplating holding an investment position) that is inconsistent with the information provided or the opinion being expressed. This may reflect the financial or other circumstances of the individual or it may reflect some other consideration. Readers of this article should take this into account when evaluating the information provided or the opinions being expressed.
All investments are subject to risk of loss, which you should consider in making any investment decisions. Readers of this article should consult with their financial advisors, attorneys, accountants or other qualified investors prior to making any investment decision.
POSITION DISCLOSURE
February 14, 2023 4:00 PM
Long: BABA0224C105, META0303C175, SE0224C70
Short:
Options symbols are denoted as follows:
Ticker, Date, Call/Put, Strike Price
Example: VXX1218C30 = VXX 12/18 Call with a $30 strike


