

Hitting the pause button
Weekend Market Review February 10, 2023

The Market
Stocks hit the pause button today.
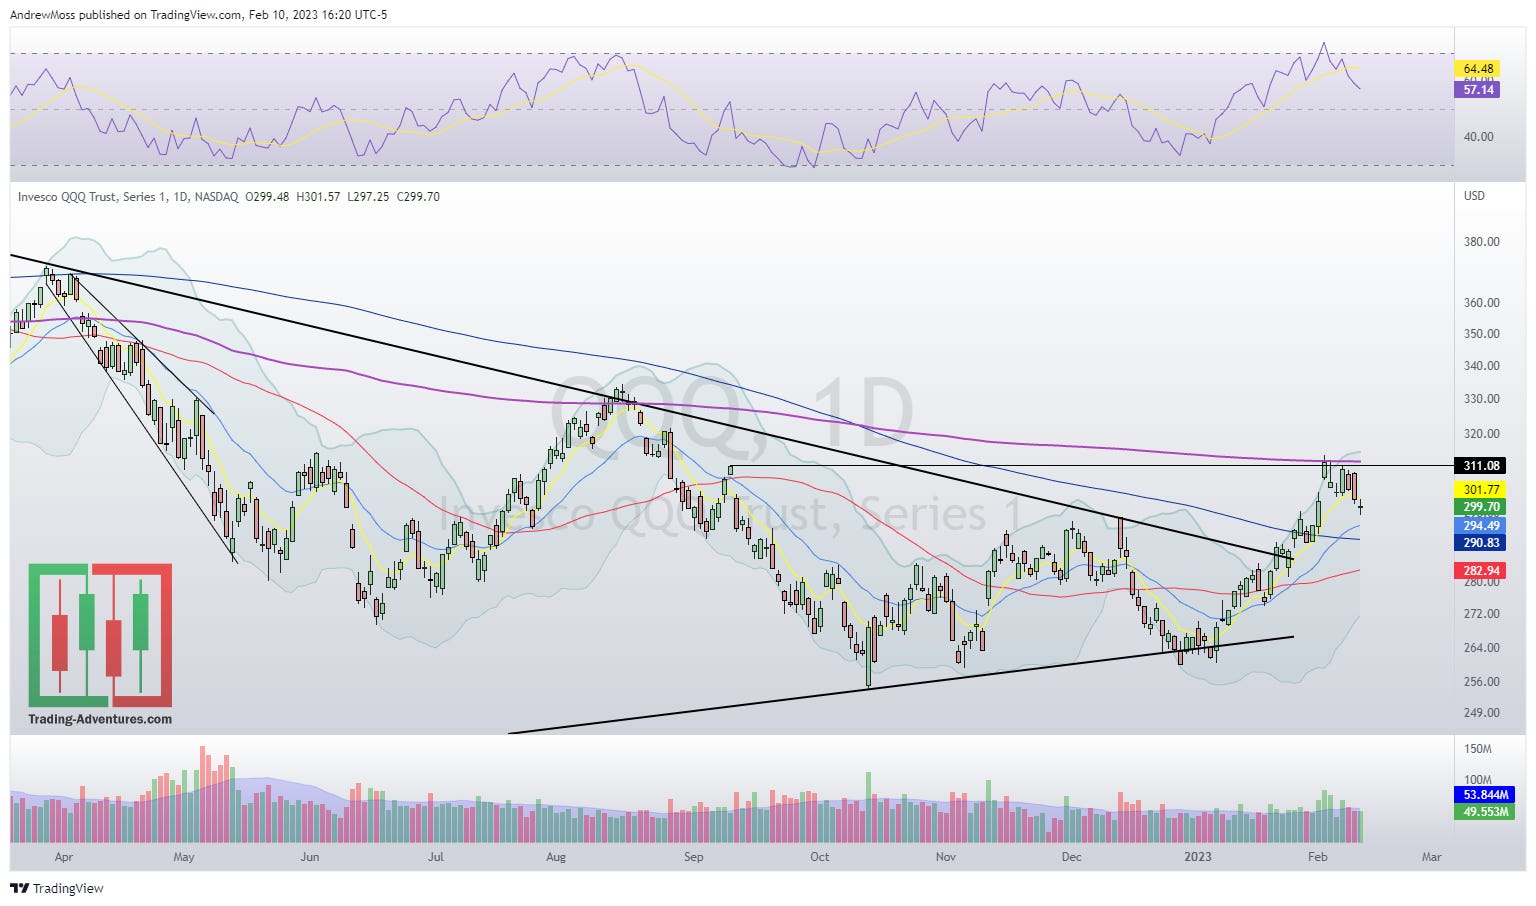
They’ve moved a long way in a short time. Over 20% in just about a month for $QQQ.
So this pullback wasn’t unexpected.
Remember this from last week?
Many are reconfirming or reestablishing their bearishness. Some say this rally is out of gas, mainly citing fundamental and economic reasons. They may be right. There are always a million reasons why “stocks can’t go up from here.”
We can do well by avoiding prediction and letting the charts tell us. And so far the indexes are holding above the 21-day EMA, and maybe even trying to bounce a bit.
The question now, once again, is how do we deal with CPI on Tuesday?
Can we hold here, get through CPI, and resume the uptrend?
Or does the support break and send us lower?
Under the surface, breadth is still strong. The NYSE bullish percents chart (shows the percentage of stocks with a ‘buy signal’ on the point and figure chart) is higher and rising.
Reversals lower and/or levels above 70% do suggest caution. It’s not there yet.

The percentage of SP 500 stocks above the 50 and 200-day moving averages has ticked lower but is still above the halfway mark.
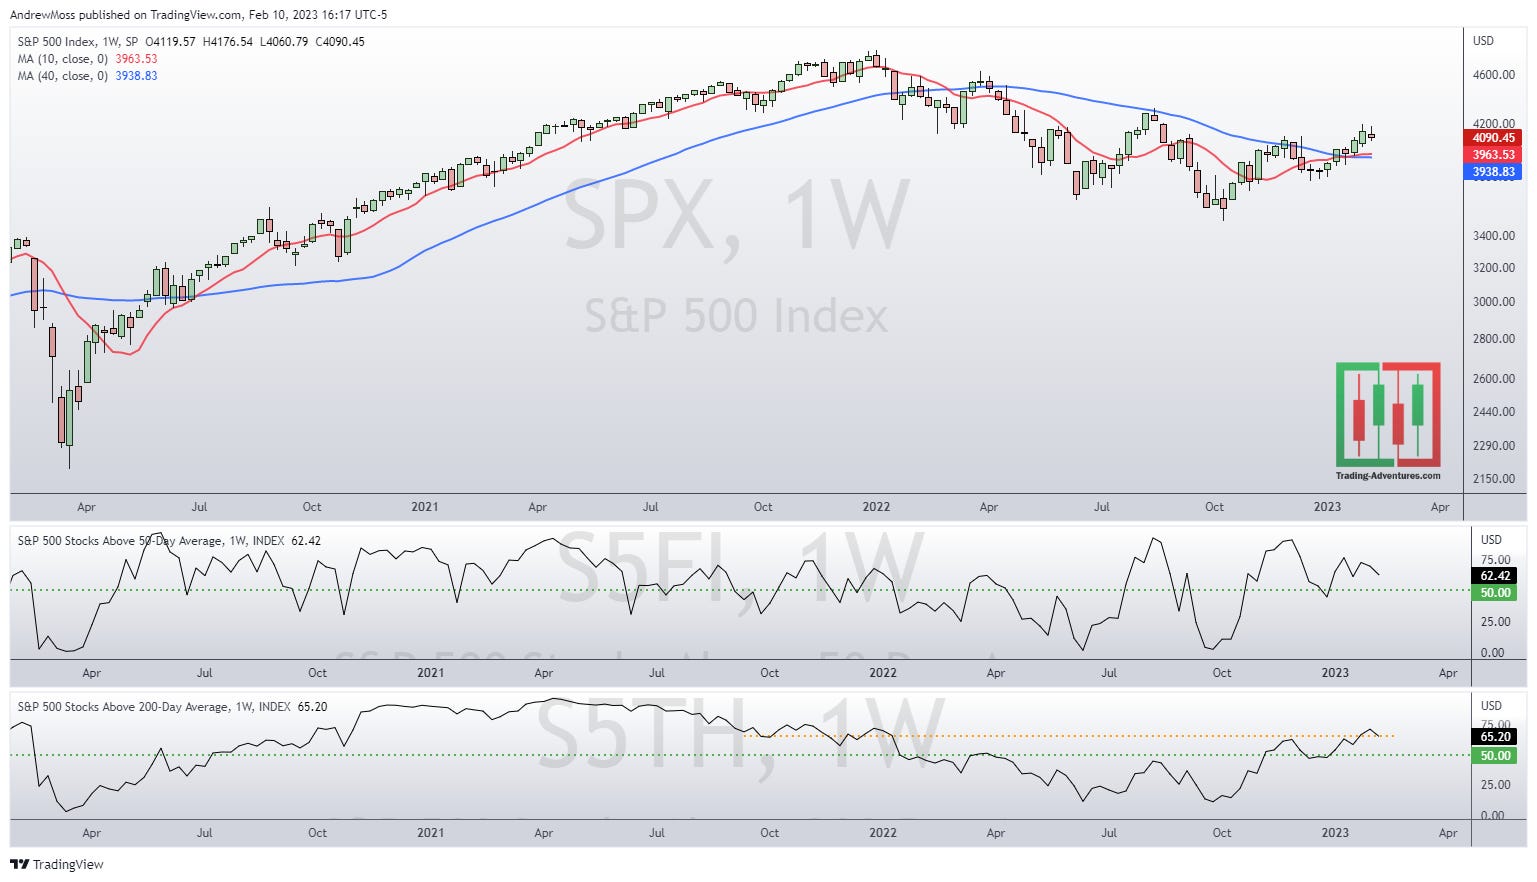
Seasonality, while strong for the complete year, does suggest some weakness in the later part of this month.

The Charts
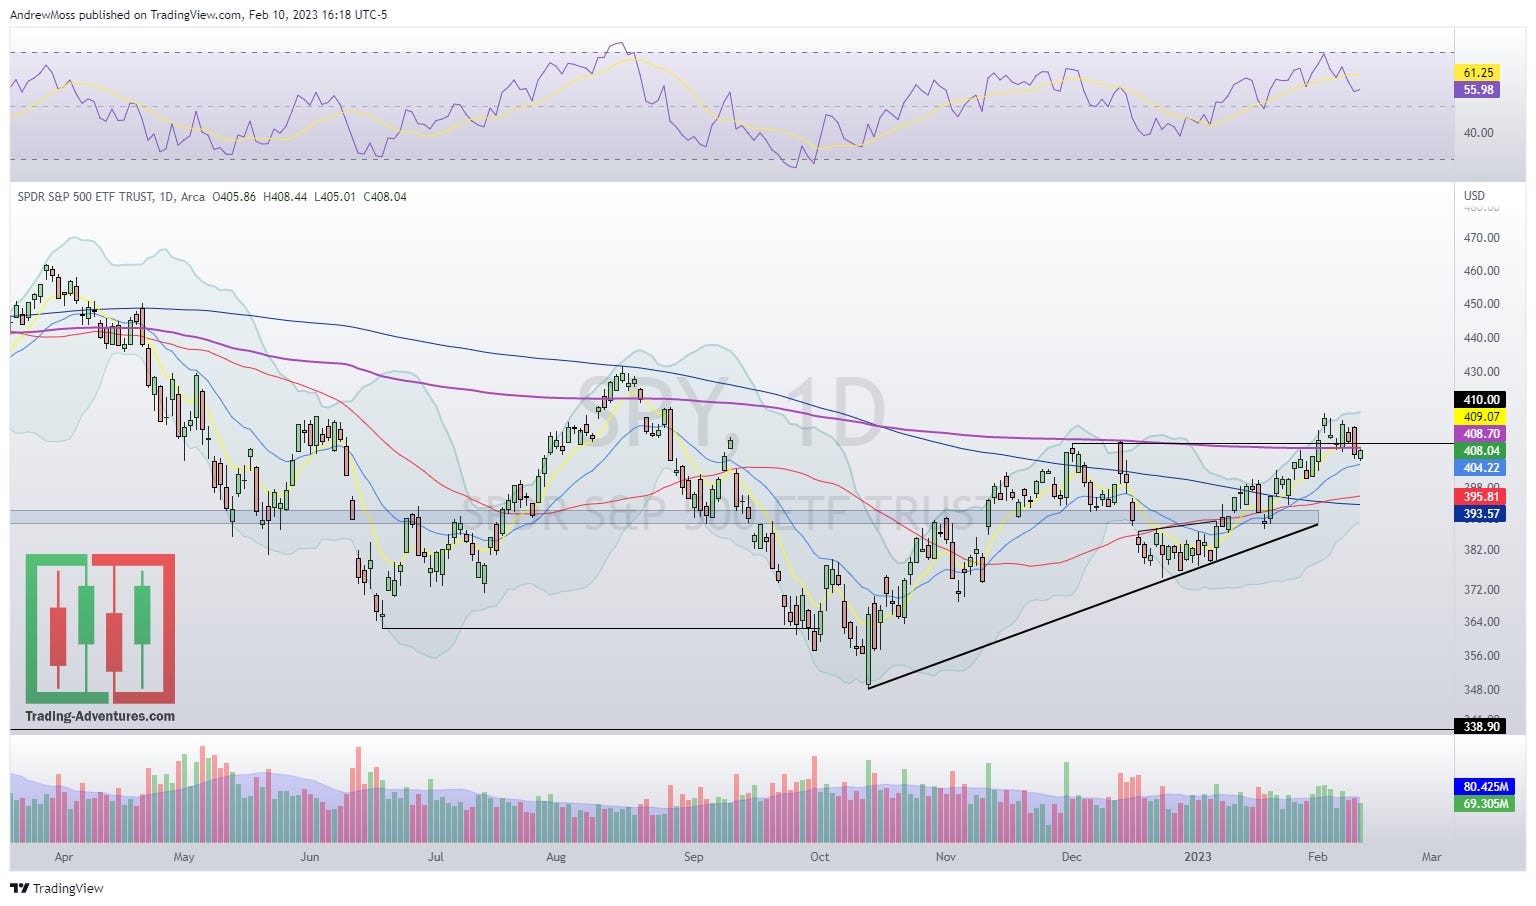
SPY is back below
the all-time high anchored VWAP
the 8-day EMA
the 410 pivot
The 21-day EMA is just below.
QQQ is so far contained within similar parameters.
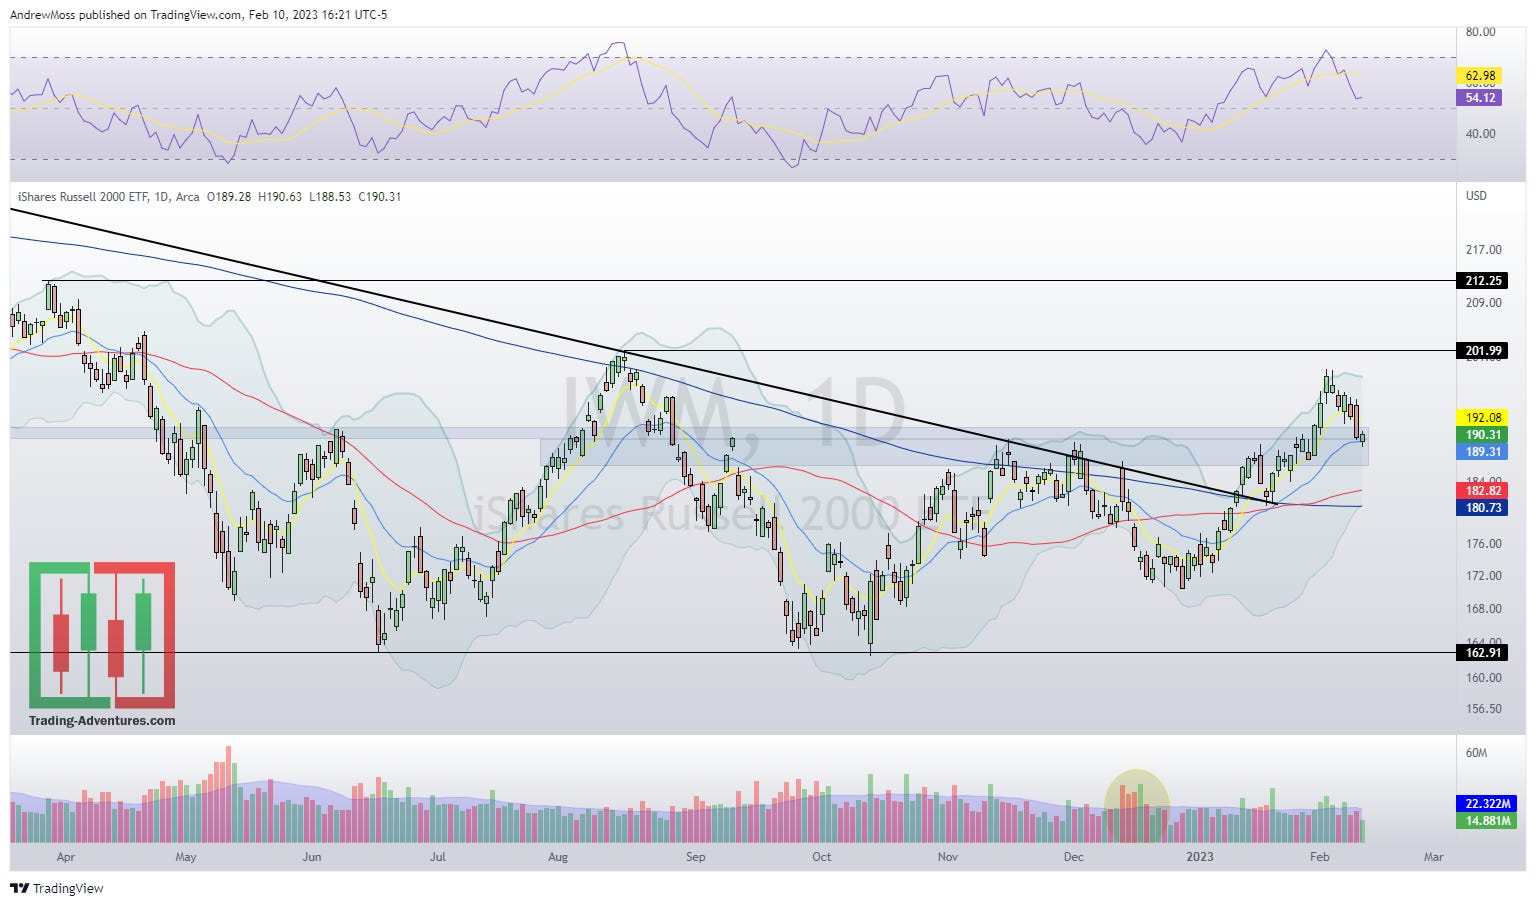
IWM has made a decent pullback from recent highs. Now it’s trying to bounce from the 21 EMA and the 189-191 support/resistance zone. If it can hold here and resume higher next week that would be a very bullish sign.
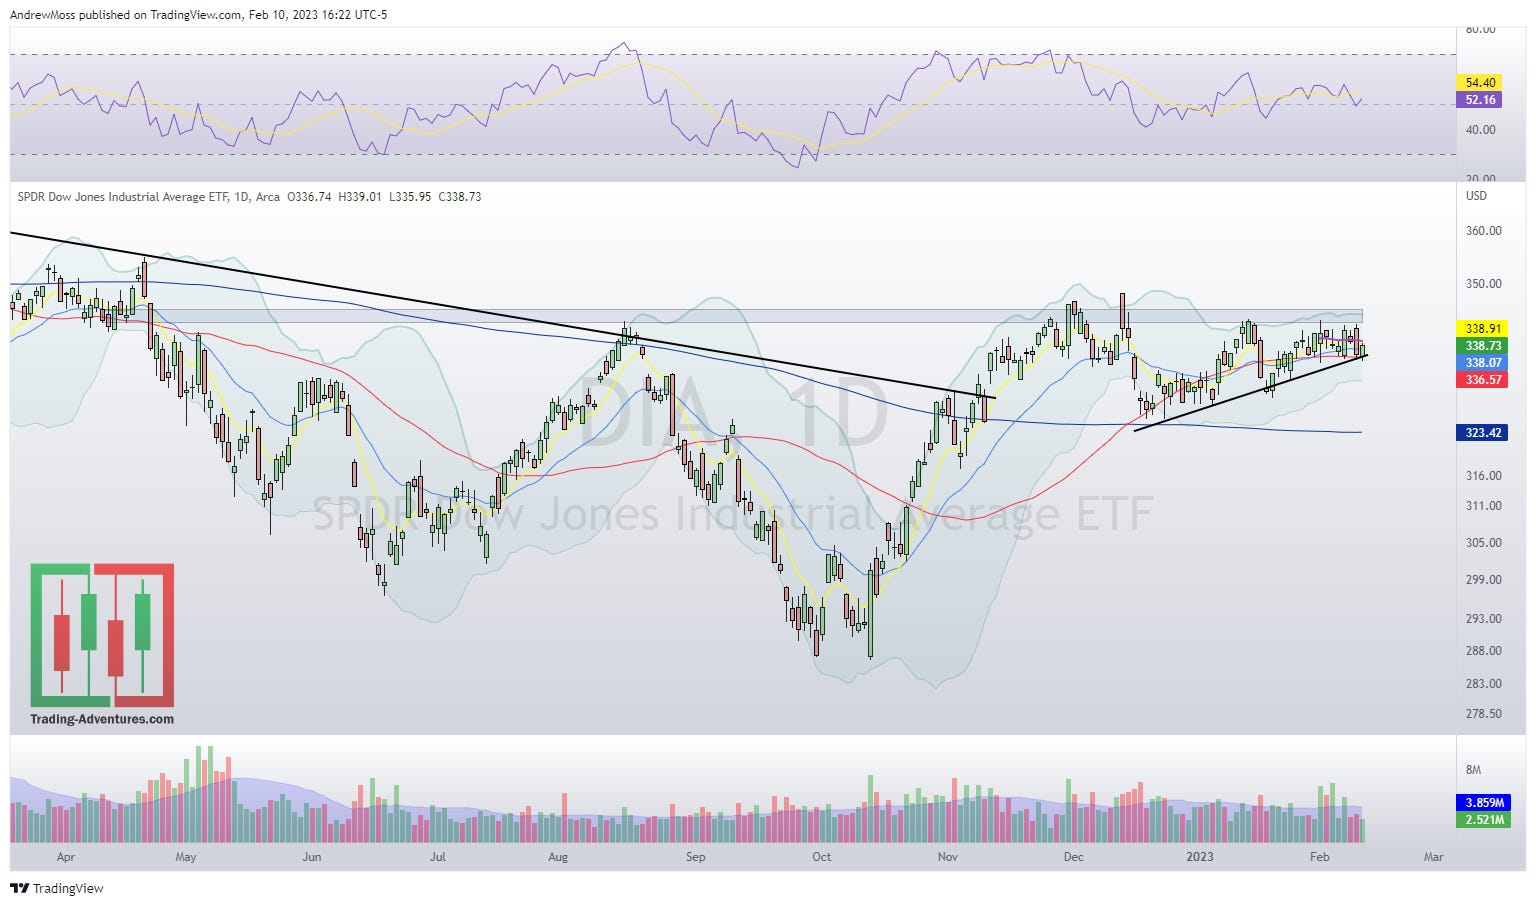
DIA is still relatively quiet while holding the short-term uptrend.
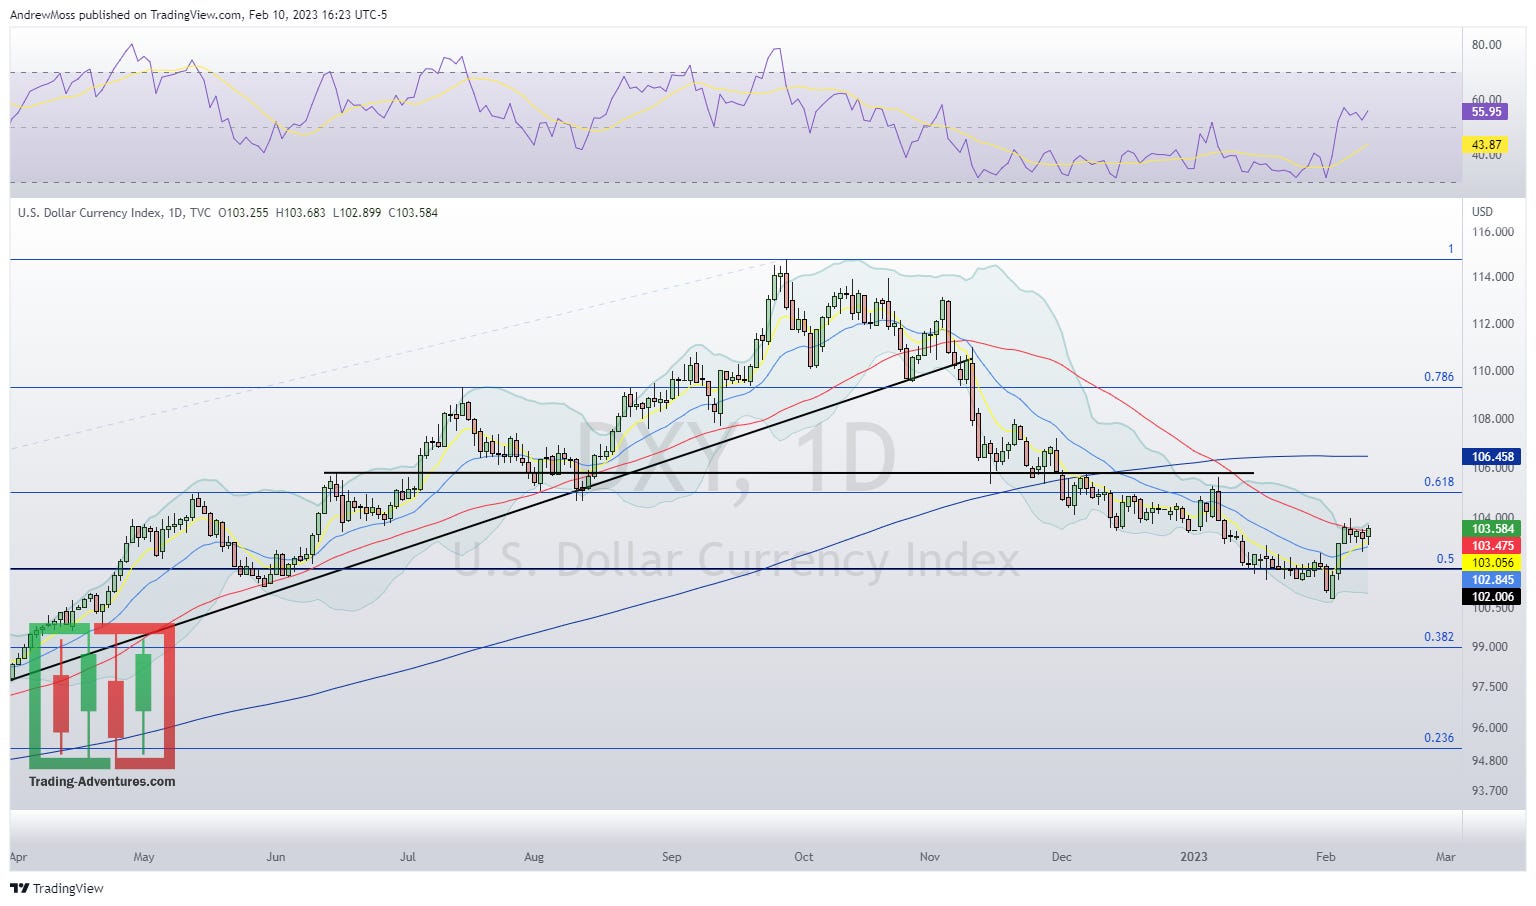
DXY The US Dollar is potentially a concern. It’s making a bullish-looking pattern (bearish for stocks) here and a breakout and move higher would likely be a headwind for stocks.
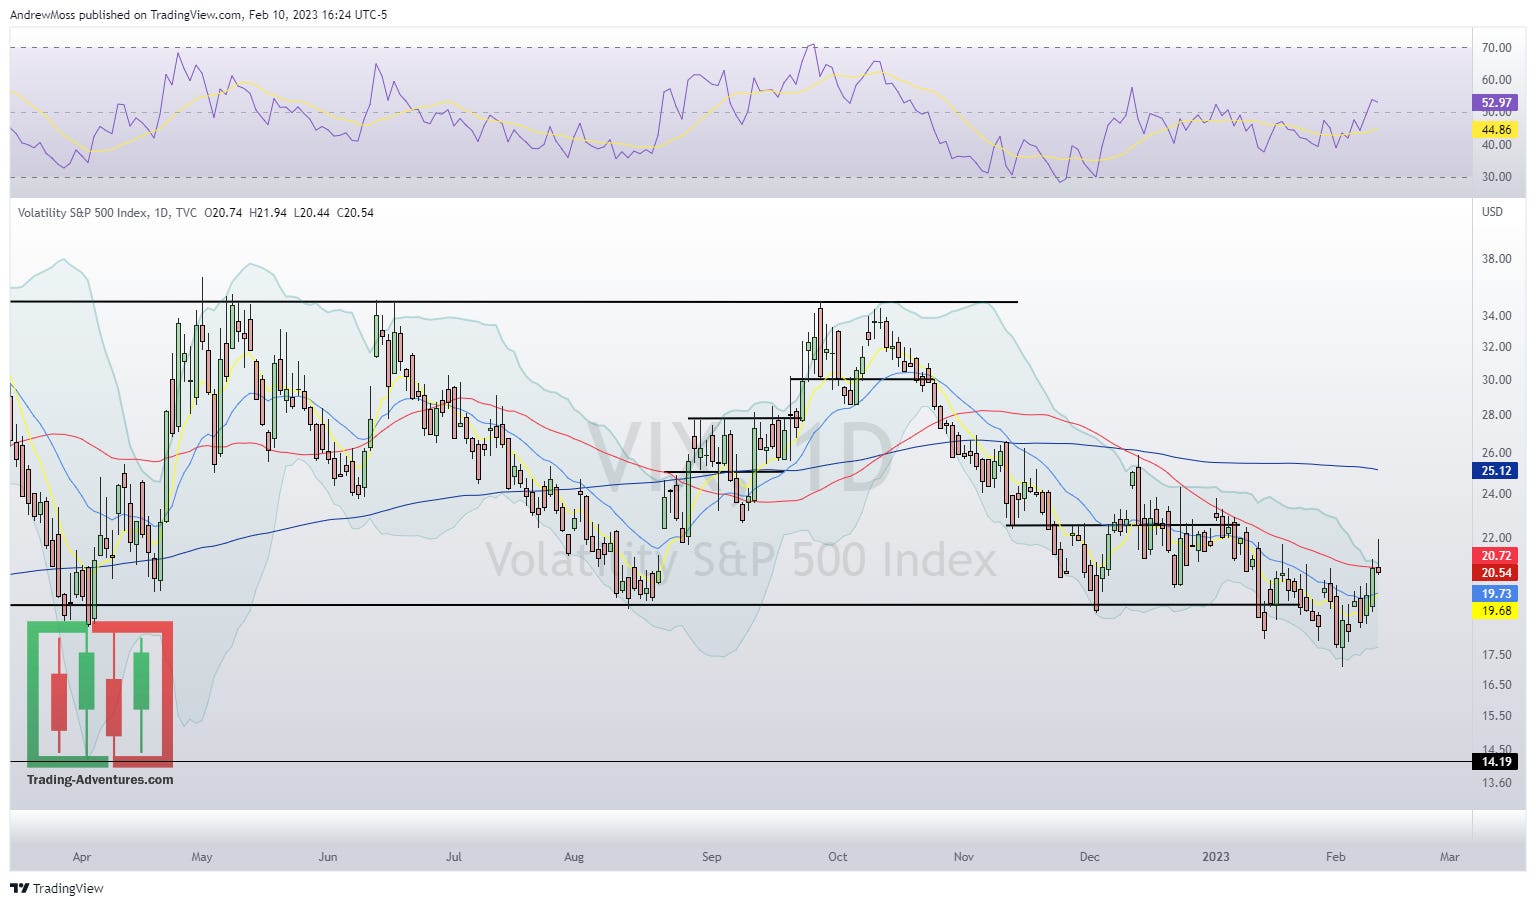
VIX Volatility has risen mildly. One explanation is that as more and more long stock exposure is added people have to put on more hedges for protection, which drives VIX up. Whatever the case, it is still relatively low and quiet.
So now, once again, we wait.
Don’t expect much on Monday as all eyes will be on CPI data coming Tuesday morning at 8:30 AM.
Happy Valentines Day!
Weekly charts in the morning.
Come join me. Ask questions. Tell a friend!
And have a great weekend!
***This is NOT financial advice. NOT a recommendation to buy, sell, or trade any security. The content presented here is intended for educational purposes only.
Andrew Moss is an associated member of T3 Trading Group, LLC (“T3TG”) a SEC registered broker/dealer and member of FINRA/SIPC. All trades placed by Mr. Moss are done through T3TG.
Statements in this article represent the opinions of that person only and do not necessarily reflect the opinions of T3TG or any other person associated with T3TG.
It is possible that Mr. Moss may hold an investment position (or may be contemplating holding an investment position) that is inconsistent with the information provided or the opinion being expressed. This may reflect the financial or other circumstances of the individual or it may reflect some other consideration. Readers of this article should take this into account when evaluating the information provided or the opinions being expressed.
All investments are subject to risk of loss, which you should consider in making any investment decisions. Readers of this article should consult with their financial advisors, attorneys, accountants or other qualified investors prior to making any investment decision.
POSITION DISCLOSURE
February 10, 2023 4:00 PM
Long: AMD0224C82, META0224C180, QQQ0214P295
Short:
Options symbols are denoted as follows:
Ticker, Date, Call/Put, Strike Price
Example: VXX1218C30 = VXX 12/18 Call with a $30 strike