Is The Market Getting Tired?
Market Update July 2, 2024
Note: Thank you for reading this article a day behind the regular schedule. The summertime calendar keeps things jumping. Your patience and flexibility are noticed and appreciated.
Also, given the Independence Day holiday-shortened week, this will be the only post for the week.
The Markets
Market breadth and participation have been a hot topic for months.
It’s funny how, as the stock indexes continue to make new highs, ‘we’ continue to scour the data for signs of trouble. This is not in reference to the ‘perma bears’ and persistent ‘doom and gloomers.’ There’s no sense concerning ourselves with their opinions. But, even optimists and generally bullish investors, traders, and analysts are always on the lookout for signs of trouble.
Perhaps that comes with a proper risk management attitude.
So, let’s take a look beneath the surface and see what’s going on outside of the top stocks.
First, the percentage of stocks in the SP 500 that are trading above their 50 and 200-day moving averages. We know the leaders are doing well, but what about the other ~493 stocks?
After peaking so far for 2024, near the very beginning of the year, these numbers have been in decline. Currently, less than 200 of the SP 500 stocks are trading above their 50-day moving averages. Approximately 325 are above their 200-day MAs.
Room for improvement.
Next, let’s look at the small and mid-cap indexes and the equal-weight versions of the SP 500 and NASDAQ 100.
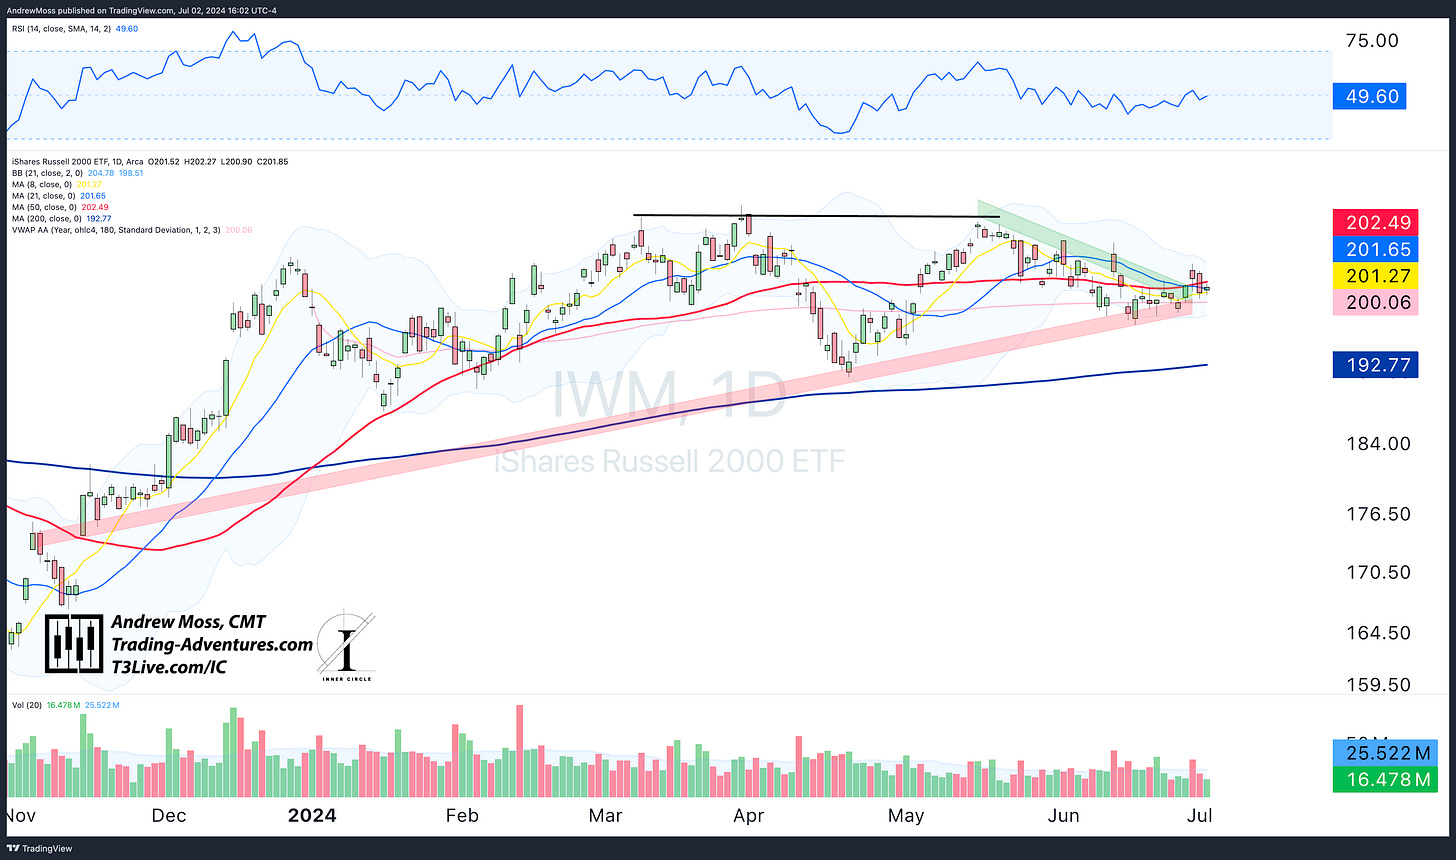
We checked on these index ETFs recently (June 24th), noticing that all of them were in consolidation patterns with fairly simple interpretations of the implications. Breaking out higher would likely lead to further upside, while the opposite would hold true for a break down lower.
Here’s the updated version.
IWM waited until the last possible day to present a breakout move higher. But, true to form, the move leaves much to be desired and could even look like a failure at this point.
MDY is also pushing the limits of the consolidation pattern and looks much closer to breaking down than up.
RSP has broken lower, violating trendline support dating back to December ‘23. The year-to-date anchored VWAP is just below $162 for potential support. If that doesn’t hold, a trip to the $158.83 pivot looks likely.
QQEW is the black sheep. Still pushing the upper limits, trading near its highs, and holding up better than the previous three.
So, it’s a mixed bag. There is no overly bearish information here, but it’s not exactly representative of a market that is firing on all cylinders.
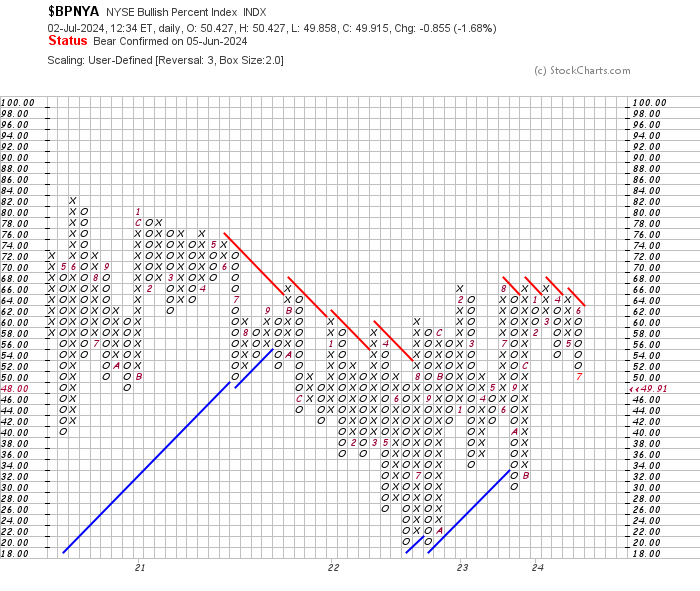
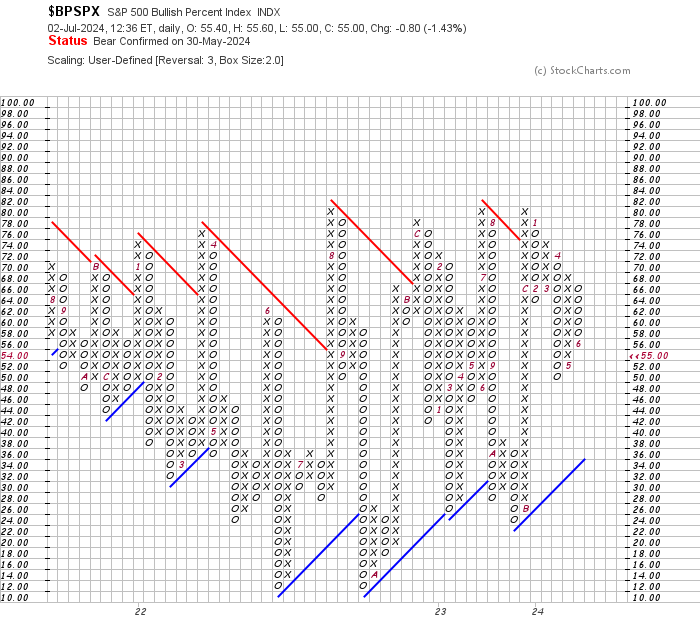
Finally, a look at the bullish percent indexes. These represent the percentage of stocks in a certain group that are trading on a Point & Figure buy signal.
The most commonly cited version is the NYSE Composite - $BPNYA.
This one has been unable to make further upside progress since hitting 66% in early 2023. Now, it has added another box lower, showing that fewer stocks in the NYSE are on buy signals. Current level — 49.91%.
$BPSPX — The SP 500 version is also in a ‘middling’ phase. The high 70s/low 80s have been the cap for years, which is not unusual. Currently, the index is in decline, clocking in at 55%.
$BPNDX — Once again, the tech-focused NASDAQ is the strongest of the bunch. Though slightly off the recent highs, this index is still in a column of X’s and is near downtrend resistance. A move to 64% or beyond would be a vote of confidence for QQQ, signaling that more individual stocks have achieved a ‘buy signal.’
Another mixed bag.
So, is breadth a concern?
It is to the extent that a prudent investor/trader/analyst is always in a risk management mindset and on guard for new warning signals.
However, there are no blaring caution sirens or bells sounding off. If that changes, you will read about it here.
The Charts
Competing factors: Charts of SPY and QQQ showed double-top potential after Monday’s rally failed precisely at the recent highs, adding to the argument that stocks are due for a rest.
Conversely, the first two weeks of July are historically some of the most bullish days of the year.
Today’s action had something for everyone. The futures started in the red overnight, and then stocks opened lower before mounting a strong rally into the close and taking prices right back to the highs.
The markets do not care about our reasons and justifications for rest and pullbacks.
SPY puts in a new ‘highest daily close ever’ after opening lower and climbing steadily higher all day.
QQQ likewise puts in a new closing high on a perfect green candle.
BTCUSD is trying to maintain its strength from the year-to-date AVWAP bounce. But after yesterday’s trip to the declining 21-day MA, it is selling off to retest the 8-day MA. Medium to long term: still a bullish consolidation.
Short term: mixed, to be determined.
The Trade
It’s a holiday week. Markets will close early at 1:00 PM tomorrow and will remain closed all day Thursday. Expect very light action on Friday, as many will be gone for a long weekend.
So, the trade?
Long: Apple pie, Hot Dogs, and Fireworks
For those of you in the USA, have a safe and memorable July 4th holiday.
See you all next week.
Elevate Your Trading
Education, training, and support for your Trading Adventure.
Options Trades - Weekly trade ideas are delivered to your email or text messages in language you can easily understand.
Check out EpicTrades from David Prince and T3 Live. Epic Trades from David Prince
Community - Are you an experienced trader seeking a community of professionals sharing ideas and tactics? Visit The Inner Circle, T3 Live’s most exclusive trading room - designed for elite, experienced traders.
The Inner Circle at T3 Live
Prop Trading - Or perhaps you are tested and ready to explore a career as a professional proprietary trader? 3 Trading Group has the technology and resources you need.
Click here to start the conversation:
T3TradingGroup.com
The Disclosures
***This is NOT financial advice. This is NOT a recommendation to buy, sell, or trade any security. The content presented here is intended for educational purposes only.
Andrew Moss is an associated member of T3 Trading Group, LLC (“T3TG”), an SEC-registered broker/dealer and member of FINRA/SIPC. All trades placed by Mr. Moss are done through T3TG.
Statements in this article represent that person’s opinions only and do not necessarily reflect those of T3TG or any other person associated with T3TG.
Mr. Moss may hold an investment position (or may be contemplating holding an investment position) that is inconsistent with the information provided or the opinion being expressed. This may reflect the financial or other circumstances of the individual, or it may reflect some other consideration. Readers of this article should consider this when evaluating the information provided or the opinions being expressed.
All investments are subject to the risk of loss, which you should consider in making any investment decisions. Readers of this article should consult with their financial advisors, attorneys, accountants, or other qualified investors before making any investment decision.
POSITION DISCLOSURE
July 2, 2024, 4:00 PM
Long: AAPL, IBIT
Short:
Options symbols are denoted as follows:
Ticker, Date, Call/Put, Strike Price
Example: VXX1218C30 = VXX 12/18 Call with a $30 strike


