


Keep 'em Guessing
Market Update November 2, 2023
The Markets
False starts and failed moves have been this market’s modus operandi recently. This time last week the possibility of a failed Break Down mentioned.
Now here we are with the SP500 back well over $4200 after a very strong four-day move.
Markets are funny like that.
It started (somewhat) with the realization that AMD’s earnings were okay. After trading down briefly in the after-hours session, and after the earnings report, the stock turned around. Wednesday it led the market higher rising by nearly 10%.
An additional boost, and the more important news to the whole market came when Jerome Powell spoke at 2:30 yesterday. Leaving the Fed Funds Rate unchanged was no surprise. Everyone expected that.
It was the language used and his comments in the press release that were the focus of traders. Bull fever kicked in, rates backed off, and stocks took off higher.
Now the indexes have come a long way in a short time and are nearing some trendlines.
More in the charts below.
The Charts
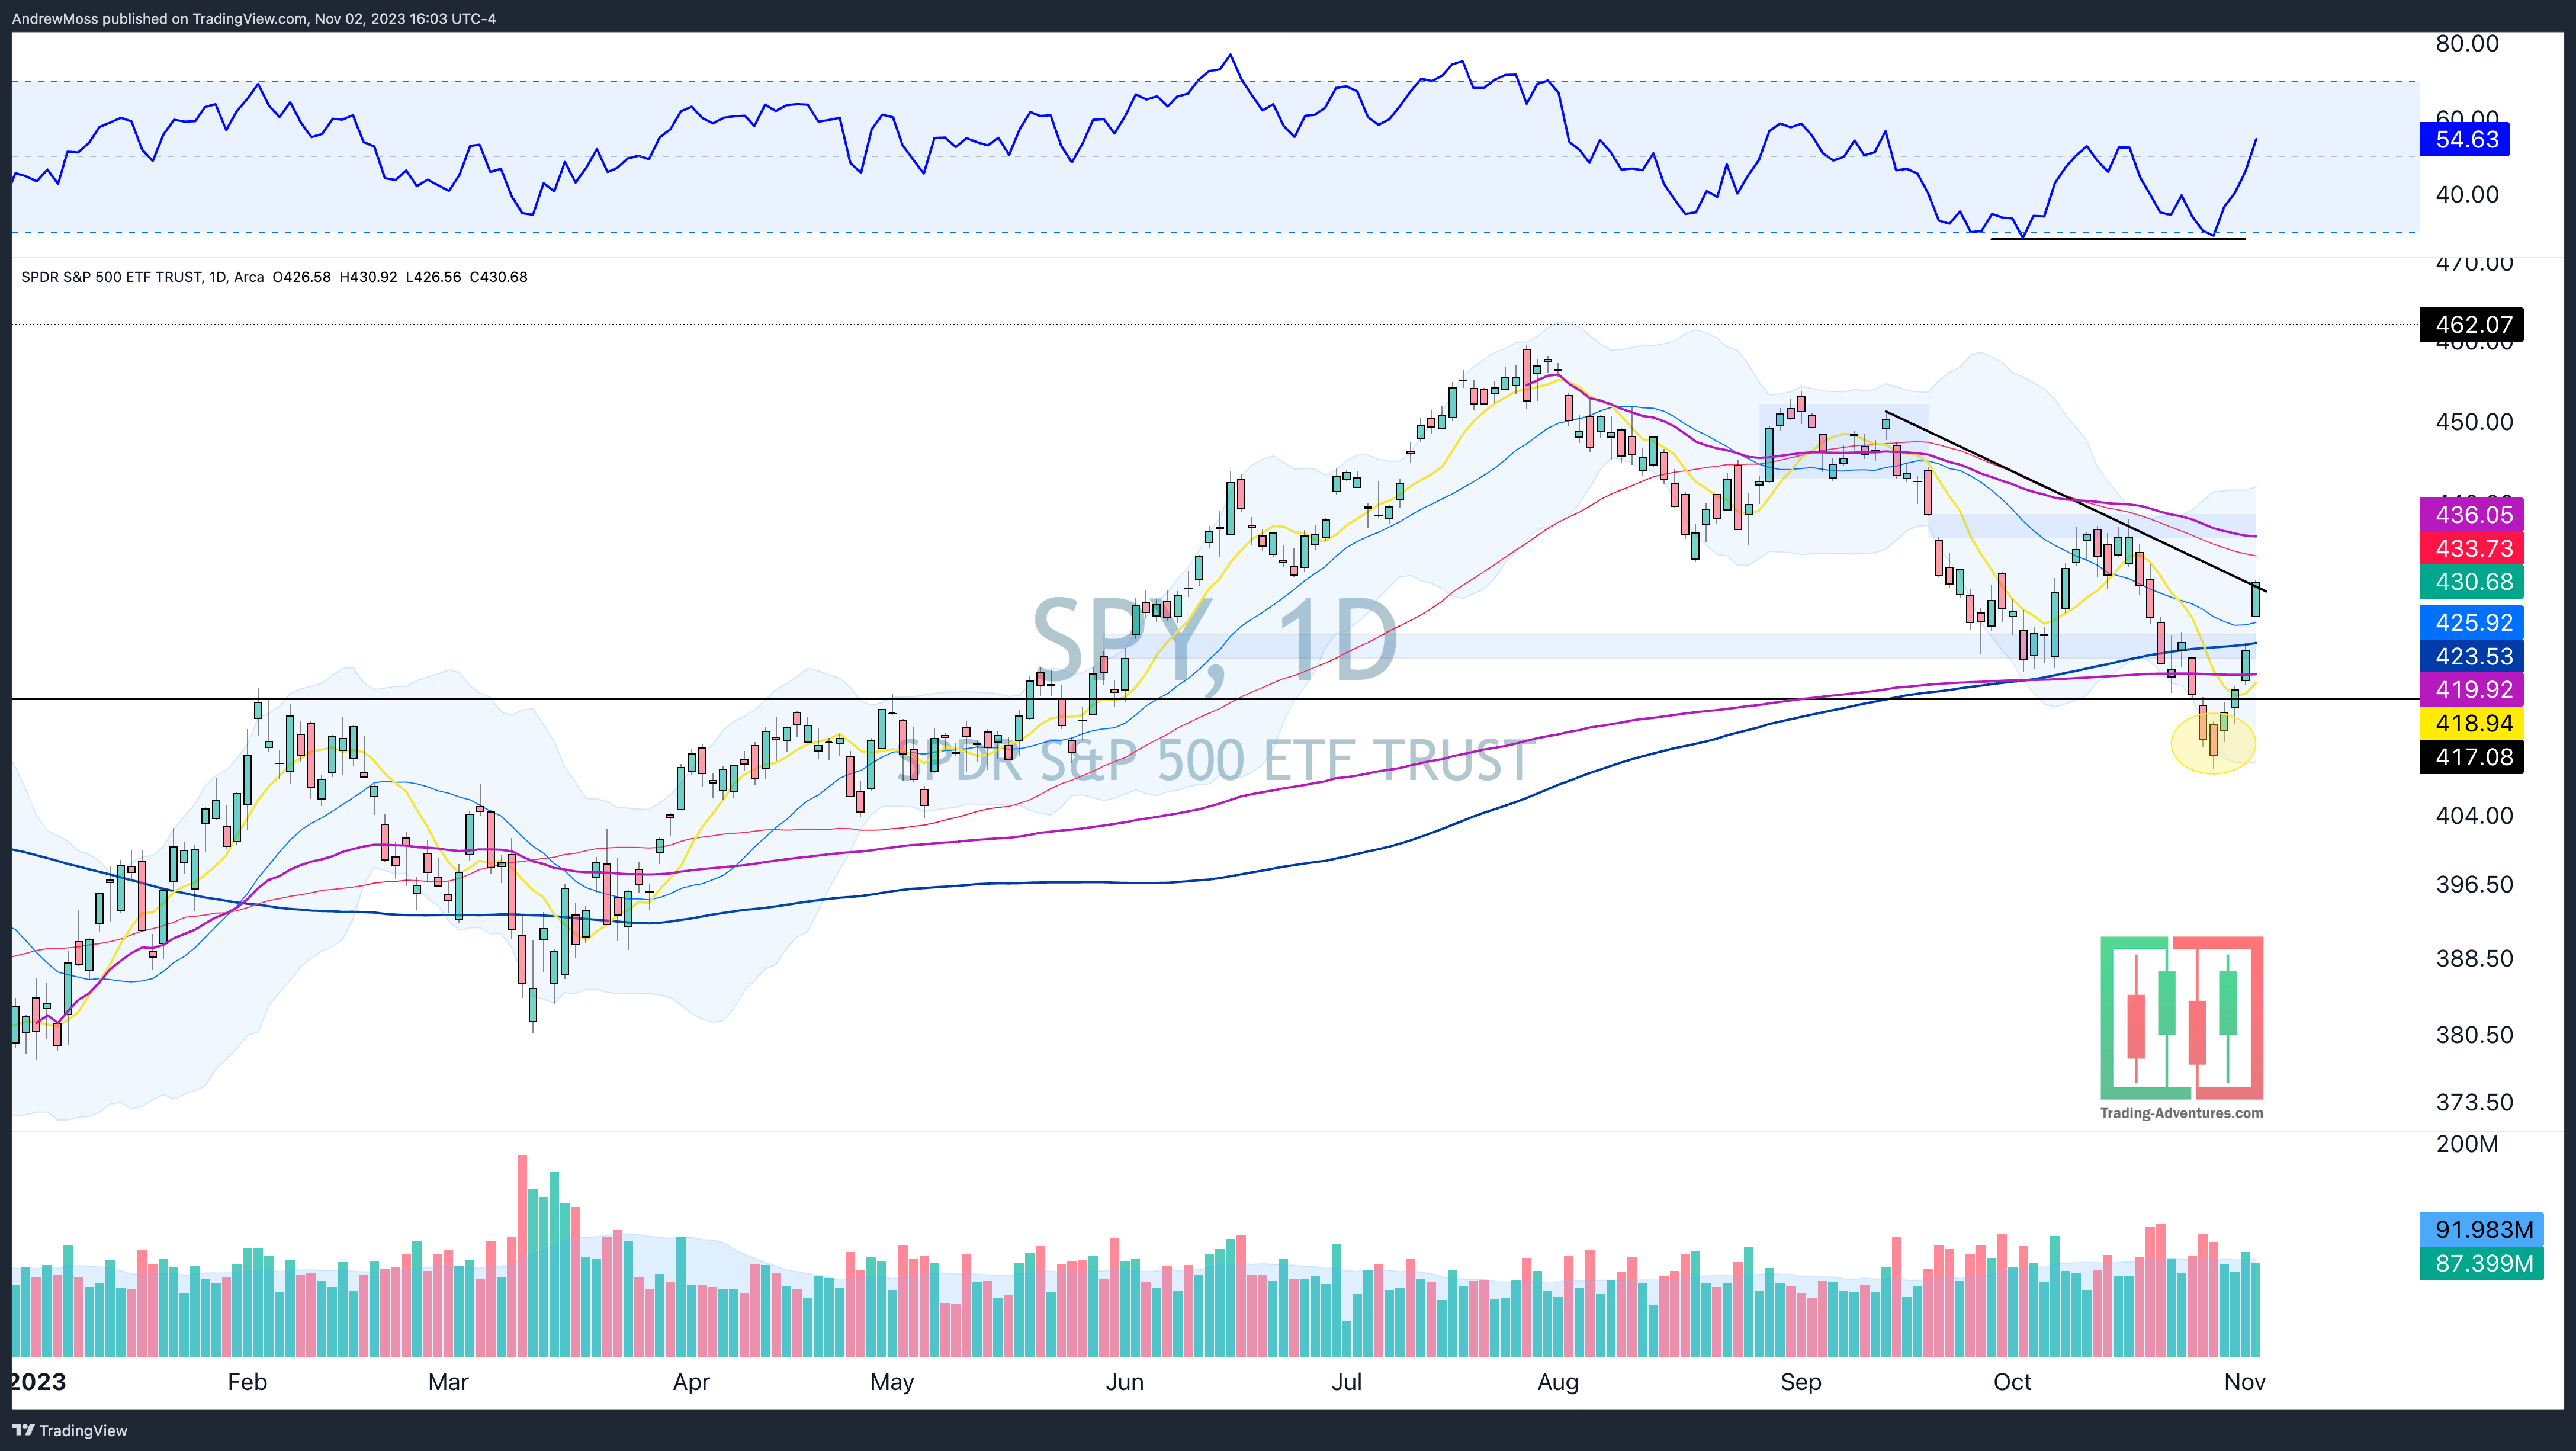
SPY is up 5% in 4 days and the failed breakout has materialized. As it touches the trendline today we start to get a feel for potential resistance. That is the first test. Next up is the 50-day MA, followed by the July high anchored VWAP, and then the previously pesky gap area at $435 to $439ish.
Underneath, a move back below the moving averages and the $417 breakout/breakdown line would be damaging and more likely to have a lasting effect the second time around.
QQQ is into its 50-day MA and could be in for a test of the downtrend line near $370.

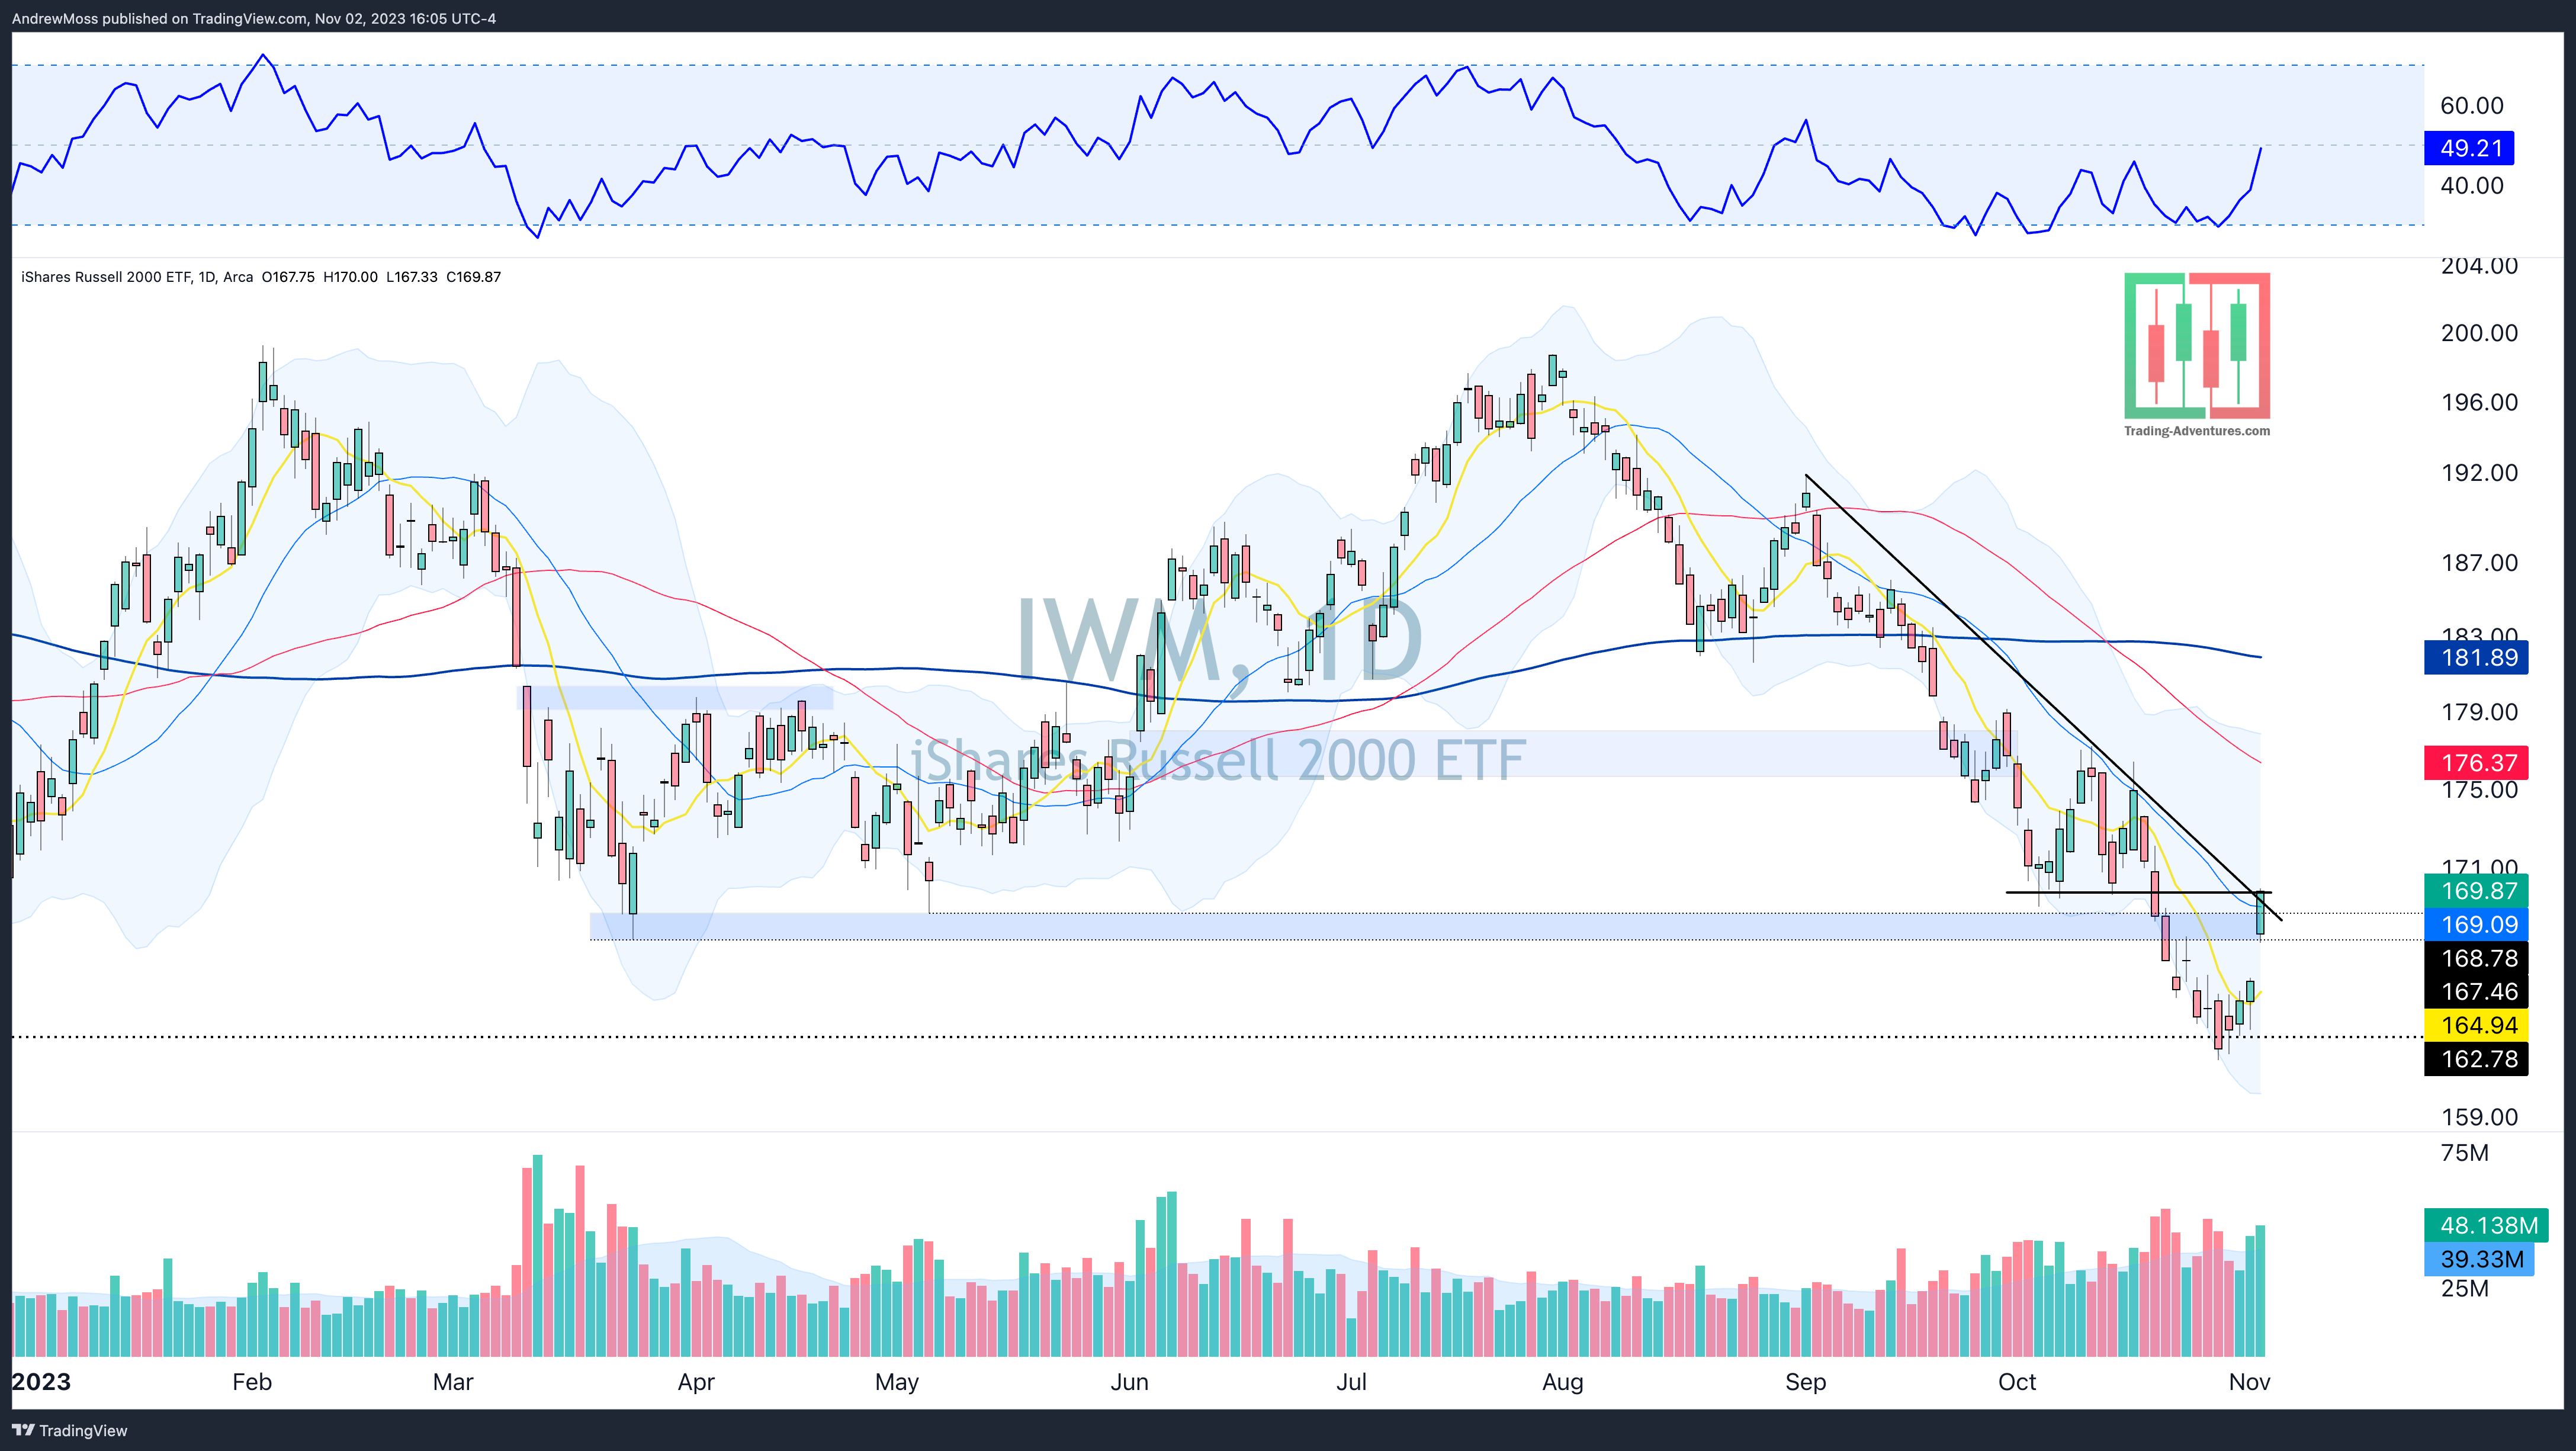
IWM has cleaned itself up nicely and is back above the support/resistance zone, over the 21-day MA, and through the downtrend line. $170-$171 is the last layer of resistance to work through in the very short term.
DIA is quickly back to the flat 200-day MA and managed to close above. The 50-day is next up near $339, followed by pivot support/resistance over $340.

TLT is notable not only for the large gap up but also for the possibility of the 8-day MA crossing back above the 21-day. While that move has resulted in quick failure on many previous attempts it is still worth watching as a signal of potentially returning strength.

DXY The Dollar looked ready for a sizeable move higher after breaking out of the large daily bull flag. But that move has fizzled and gotten messier now. It’s below the 8 and 21-day MAs now. A move down through the 50-day MA would help stocks.

Bonus Chart
AAPL is another example of a downtrend line coming into play. Apple reports earnings at 4:30 today and the options market is pricing in roughly a $6 move. The move higher would take it over the trending and a pivot level, leaving the chart looking bullish. Lower by that much would have it testing the 200-day MA once again.
We’ll see how it goes.

The Closing Bell
These strong moves are a welcome relief to the dismal views that were showing up late last week.
Now it could get trickier though.
Worth repeating; False starts and failed moves have been this market’s modus operandi recently.
What we need to see now is sensible consolidation followed by another leg up. History and seasonality are still factors.
The Disclosures
***This is NOT financial advice. NOT a recommendation to buy, sell, or trade any security. The content presented here is intended for educational purposes only.
Andrew Moss is an associated member of T3 Trading Group, LLC (“T3TG”) a SEC registered broker/dealer and member of FINRA/SIPC. All trades placed by Mr. Moss are done through T3TG.
Statements in this article represent the opinions of that person only and do not necessarily reflect the opinions of T3TG or any other person associated with T3TG.
It is possible that Mr. Moss may hold an investment position (or may be contemplating holding an investment position) that is inconsistent with the information provided or the opinion being expressed. This may reflect the financial or other circumstances of the individual or it may reflect some other consideration. Readers of this article should take this into account when evaluating the information provided or the opinions being expressed.
All investments are subject to the risk of loss, which you should consider in making any investment decisions. Readers of this article should consult with their financial advisors, attorneys, accountants, or other qualified investors prior to making any investment decision.
POSITION DISCLOSURE
November 2, 2023, 4:00 PM
Long: QCOM
Short:
Options symbols are denoted as follows:
Ticker, Date, Call/Put, Strike Price
Example: VXX1218C30 = VXX 12/18 Call with a $30 strike