

Key Reversal Day
Weekly Market Update - March 8, 2024
The News - Semiconductor Stocks Can Go Down
Today, the much-anticipated Nonfarm Payroll Data came, and stocks took off higher. IWM was breaking out again and looked well on its way to the next pivot high, near $212. Large-cap indexes SPY and QQQ were up strongly, and the market-leading chipmakers were screaming higher.
AMD was up more than 8% over yesterday’s close, while NVDA and SMCI were each up more than 5%.
The Markets
Then it changed.
Stocks reversed course, resulting in a negative day for the indexes. The previously mentioned semiconductor stocks closed down -1.89%, -5.55%, and -1.70%, respectively.


There didn’t appear to be any particular event or news item as a catalyst. They just turned lower.
Stocks do that all the time, often without warning.
We can’t often predict precisely when and where the turns will come. That’s why we constantly monitor levels, looking at the next potential resistance, pivots, moving averages, anchored VWAPs, etc., as they follow the price up from underneath.
These are our guides for managing risk and assessing the potential rewards.
When the recent market leaders (AMD, NVDA, and SMCI) turn, it is a signal to be on alert for turns in other areas. After all, the whole market has been largely following these stocks for weeks. Why would that change now?
So, we have a key reversal day or a day to take notice.
Does it lead to further selling? Only time will tell.
For now, it does tell us to be a bit more cautious.
To be clear, this is not a call for the top. There are still a multitude of bullish factors in play for the medium and longer term.
This is simply a notation of the potential change in short-term character.
Let’s look at the weekly charts.
The Charts
SPY has had a wide-ranging week, resulting in a doji candle. Indecision. However, it is accompanied by a very overbought RSI and a DeMark 9 sell setup.
Reversal likely.
Potential support is at the 10-week MA near $492, followed by the pivot high at $479.98.

QQQ is not quite a bearish engulfing candle, but it does have the DeMark 9 setup.
Reversal likely.
Potential support comes in first at the 10-week MA, then the $408.71 pivot.

IWM is technically breaking out. However, the manner in which it has done so is not very convincing. The move has been slow, with many false starts, and it has already given back much of the gains.
Reversal is possible. However, we must also be mindful that a bullish rotation into small caps while the large caps are sold is possible. That would be a very bullish indicator for the medium and longer term.

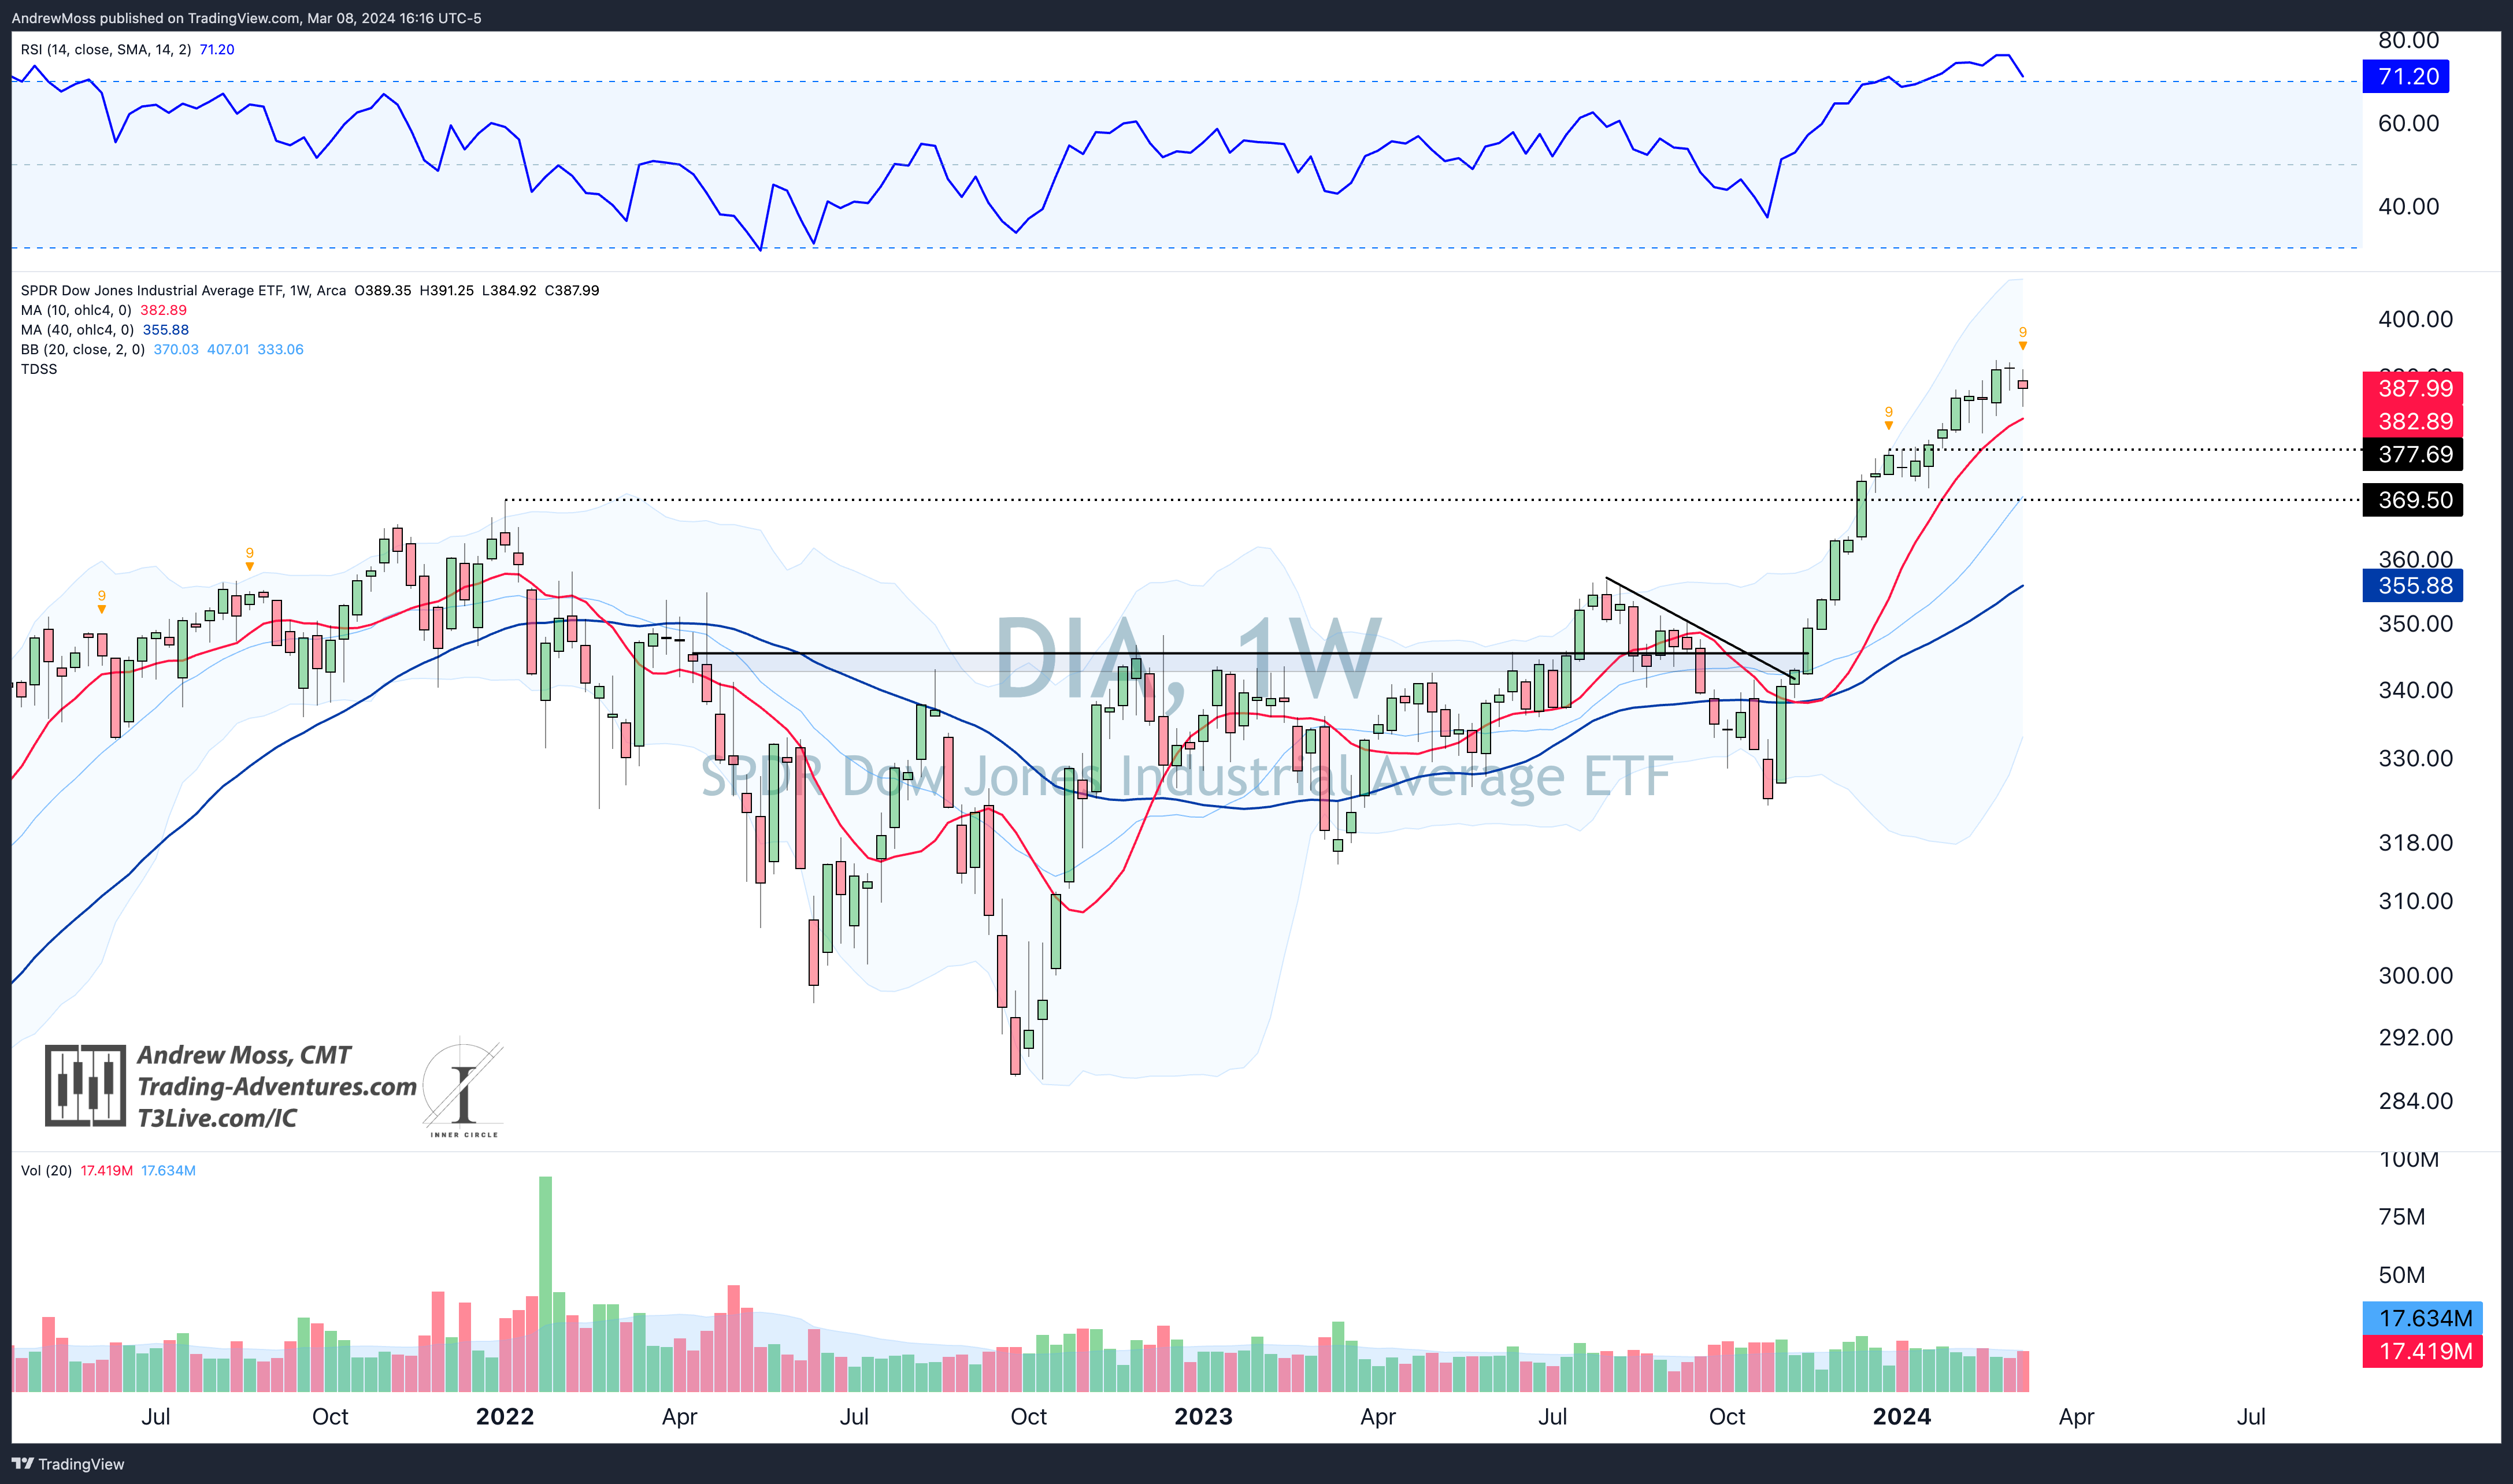
DIA is lower on the week and gives the DeMark 9 sell setup. Further downside is likely. The 10-week MA is potential support near $383, followed by a pivot near $377, while the 40-week is miles away, in the mid $350s.
TLT Bonds are showing a breakout, which gives rate relief.

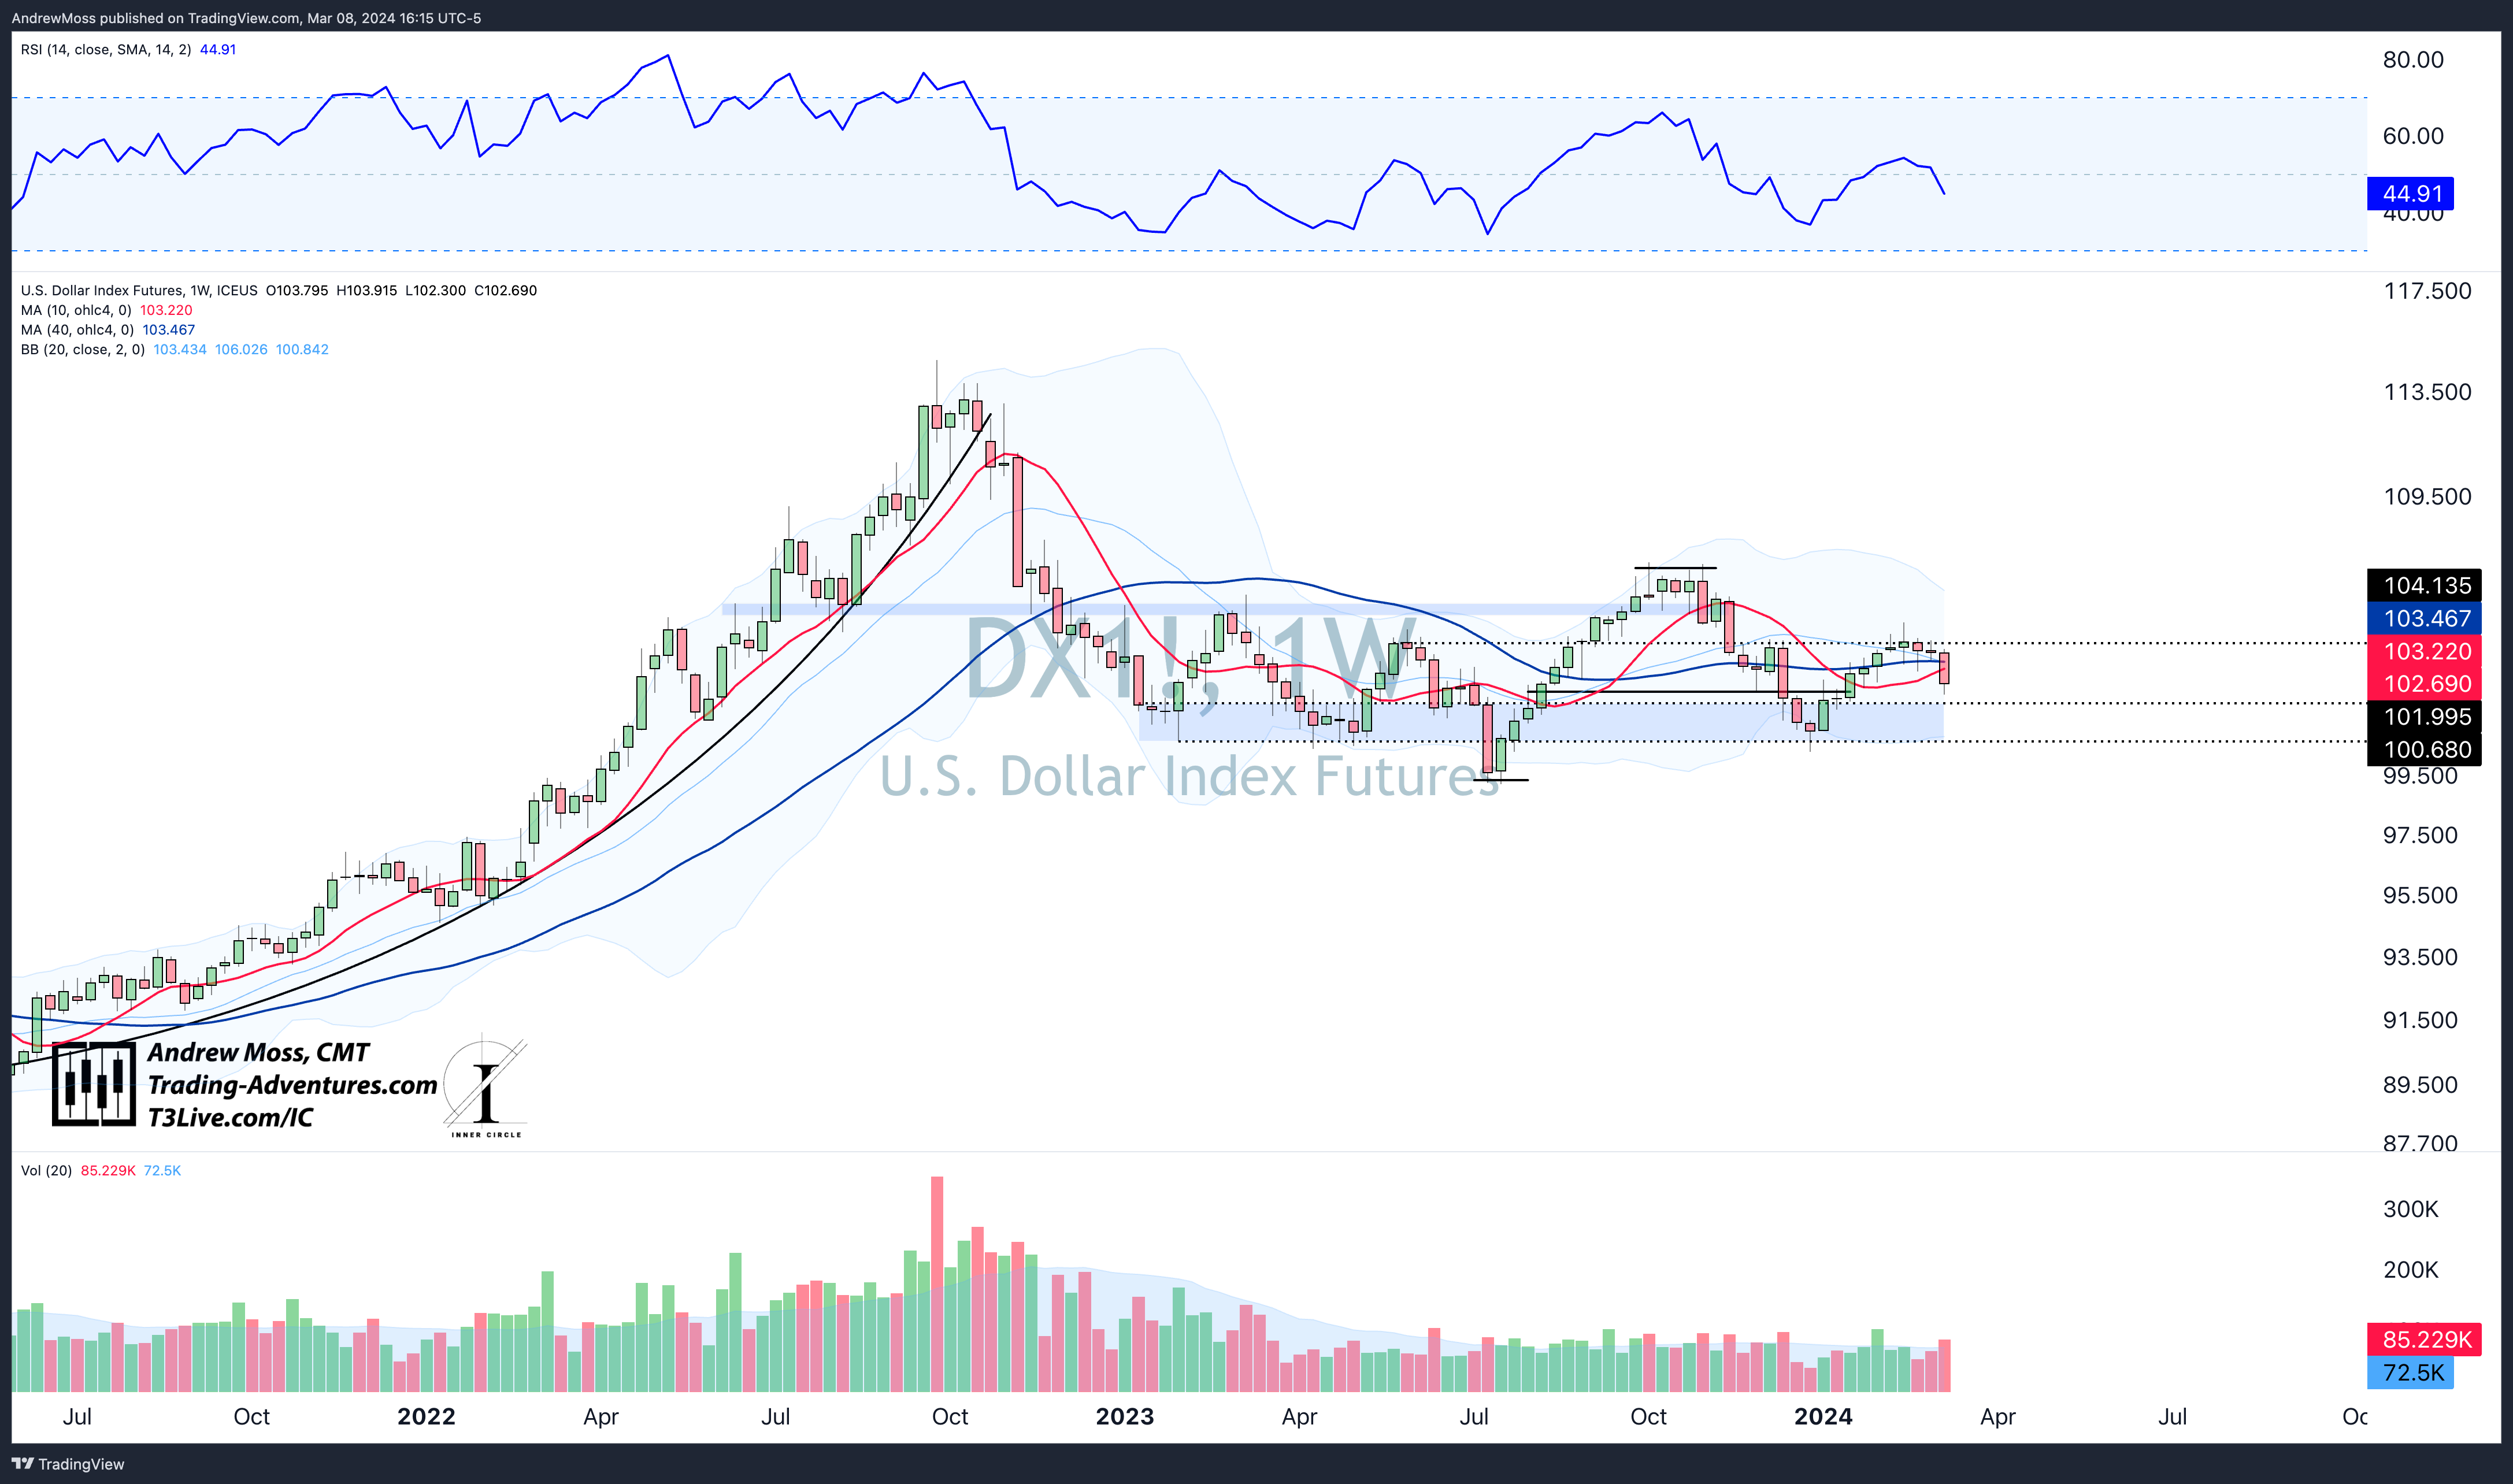
DXY US Dollar futures are lower on the week.
BTCUSD Bitcoin is breaking out. Risk appetite is still present, which supports the case for bullish rotation.

The Closing Bell
The charts are clear. Look for more near-term downside in the indexes—nothing more, at least for now.
It’s important to be an observer and let the chart sequences play out. Some are perma-bears and are always calling for catastrophe. Some missed this historic move and are praying for a pullback and a chance to buy the dip.
The best traders will observe what is and adjust accordingly.
Pick your strategy wisely.
More weekly charts on X in the morning. Have a look and share your thoughts and observations, too.
Or do so right here, in the comments.
Elevate Your Trading
Education, training, and support for your Trading Adventure.

Options Trades - Weekly trade ideas are delivered to your email or text messages in language you can easily understand.
Check out EpicTrades from David Prince and T3 Live. Epic Trades from David Prince
Community - Are you an experienced trader seeking a community of professionals sharing ideas and tactics? Visit The Inner Circle, T3 Live’s most exclusive trading room - designed for elite, experienced traders.
The Inner Circle at T3 Live
Prop Trading - Or perhaps you are tested and ready to explore a career as a professional proprietary trader? 3 Trading Group has the technology and resources you need.
Click here to start the conversation:
T3TradingGroup.com
The Disclosures
***This is NOT financial advice. This is NOT a recommendation to buy, sell, or trade any security. The content presented here is intended for educational purposes only.
Andrew Moss is an associated member of T3 Trading Group, LLC (“T3TG”), an SEC-registered broker/dealer and member of FINRA/SIPC. All trades placed by Mr. Moss are done through T3TG.
Statements in this article represent that person’s opinions only and do not necessarily reflect those of T3TG or any other person associated with T3TG.
Mr. Moss may hold an investment position (or may be contemplating holding an investment position) that is inconsistent with the information provided or the opinion being expressed. This may reflect the financial or other circumstances of the individual, or it may reflect some other consideration. Readers of this article should consider this when evaluating the information provided or the opinions being expressed.
All investments are subject to the risk of loss, which you should consider in making any investment decisions. Readers of this article should consult with their financial advisors, attorneys, accountants, or other qualified investors before making any investment decision.
POSITION DISCLOSURE
March 8, 2024, 4:00 PM
Long: IMNM, MDB0315P370, MNMD0315C10, SPY0315P505, VKTX0419C80
Short:
Options symbols are denoted as follows:
Ticker, Date, Call/Put, Strike Price
Example: VXX1218C30 = VXX 12/18 Call with a $30 strike