Mid-Week Market Update December 21, 2022
Holiday Edition
The Markets
Five days of selling finally gave way to some positive price action for stocks.
In the weekend review, we examined the market’s downside extension and the possibility of a bounce.
Note - Read these posts for an explanation of extension and price equilibrium.
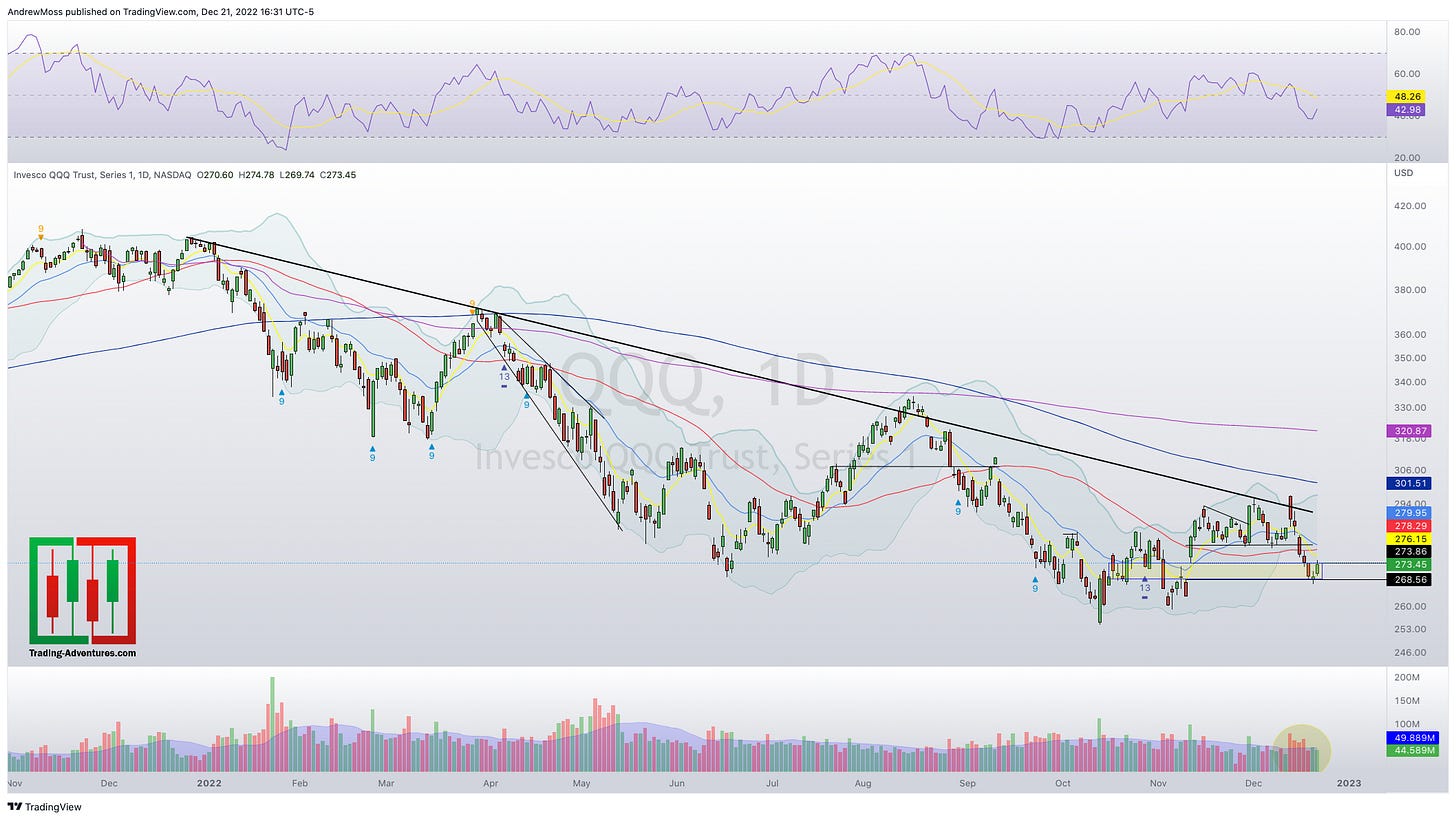
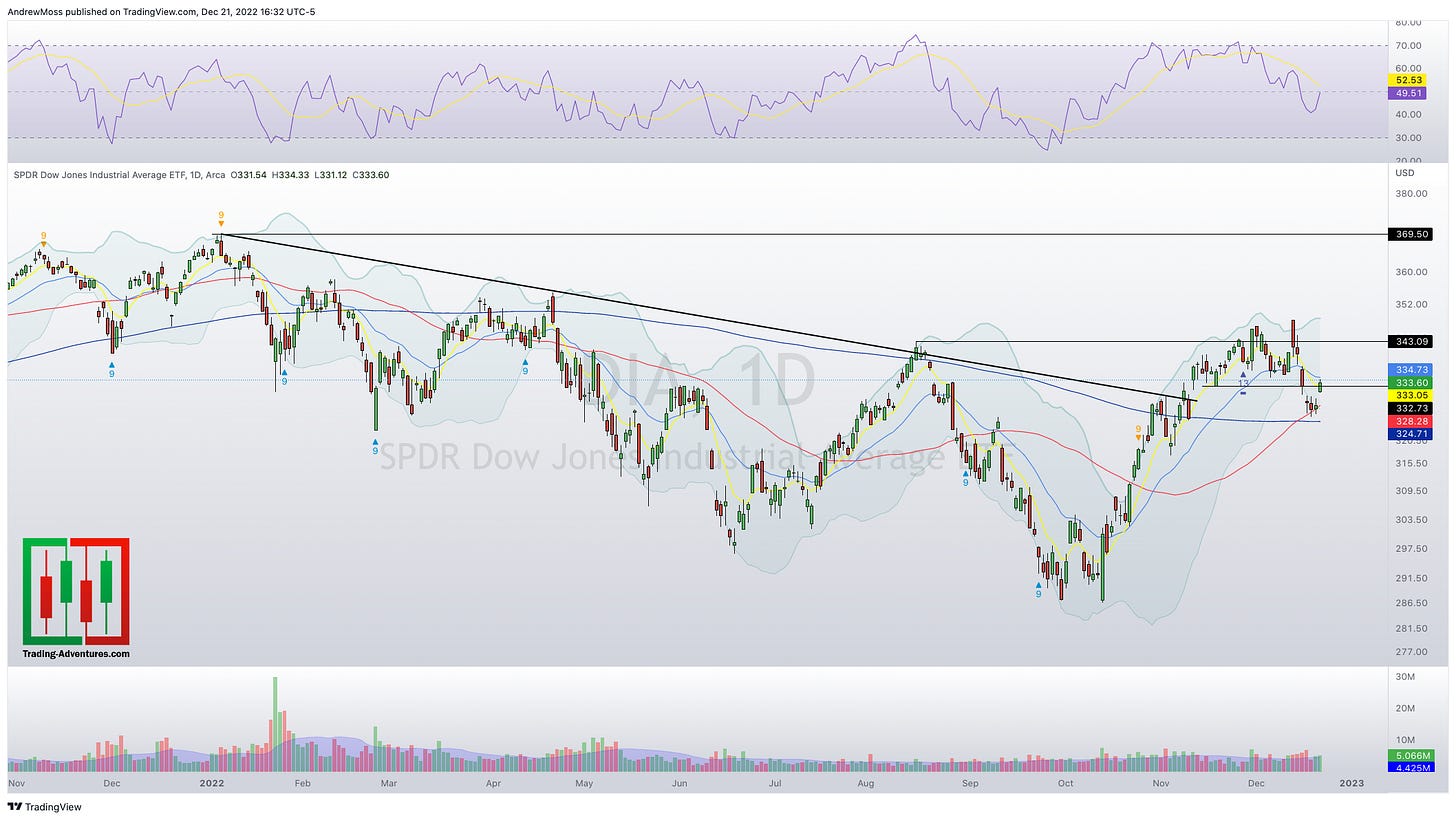
The bounce move has occurred in line with expectations. Three of the four major indexes are back near the equilibrium area. Now we look to what’s next.
If they are to continue higher, and if Santa Claus is to deliver his namesake rally, there is potentially significant resistance to clear.
SPY levels to watch
YTD low anchored VWAP (purple line)
50-day simple moving average (red line)
8-day exponential moving average (yellow line)
$388-$391 support/resistance zone (blue shaded area)
21-day exponential moving average (light blue line)
Volume, though often an overlooked component, will add to the challenge.
The 5-day selloff from 12/13-19, had higher than average volume on four of those days. Prices have bounced with much lower volume this week suggesting the possibility that prices may have stopped going down not from an increase in buyers, but from a decrease in sellers.
For a meaningful rally to occur, not only do we want to see prices surpassing all of the tests above, but to do so with much more volume than we've seen so these last two sessions.
The Charts
Click to enlarge
SPY
QQQ
IWM
DIA
DXY
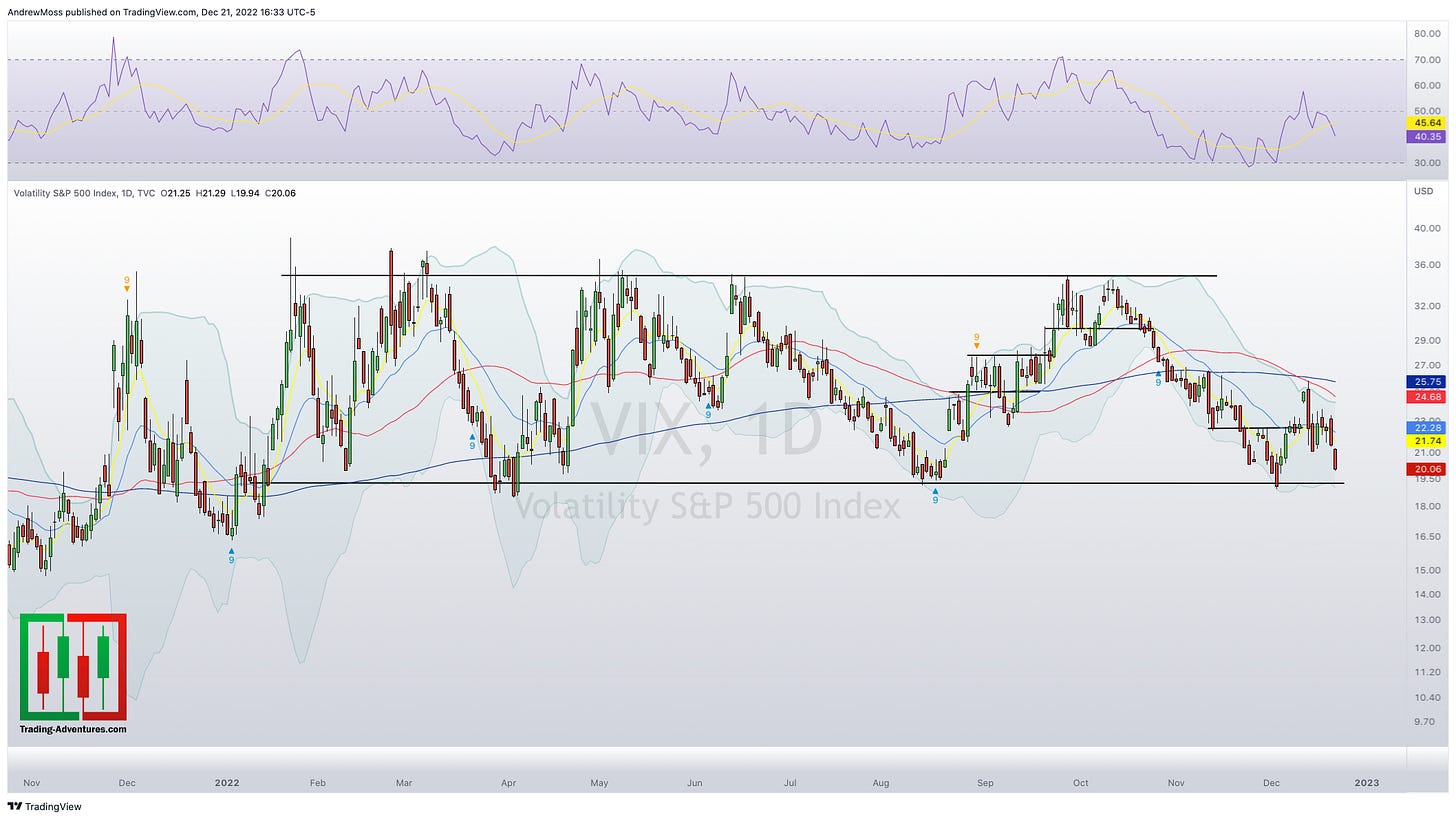
VIX
Whether we get a Santa Claus Rally or not (and remember he doesn't come to Wall St. until after Christmas) I hope you have a blessed season with loved ones. There won't be a Weekend Market Review this Friday, but I'll still have the weekly charts on Twitter Saturday morning.
Until next week;
Merry Christmas!
Happy Hanukkah!
Joyful holidays to you no matter how you celebrate!
***This is NOT financial advice. NOT a recommendation to buy, sell, or trade any security. The content presented here is intended for educational purposes only.
Andrew Moss is an associated member of T3 Trading Group, LLC (“T3TG”) a SEC registered broker/dealer and member of FINRA/SIPC. All trades placed by Mr. Moss are done through T3TG.
Statements in this article represent the opinions of that person only and do not necessarily reflect the opinions of T3TG or any other person associated with T3TG.
It is possible that Mr. Moss may hold an investment position (or may be contemplating holding an investment position) that is inconsistent with the information provided or the opinion being expressed. This may reflect the financial or other circumstances of the individual or it may reflect some other consideration. Readers of this article should take this into account when evaluating the information provided or the opinions being expressed.
All investments are subject to risk of loss, which you should consider in making any investment decisions. Readers of this article should consult with their financial advisors, attorneys, accountants or other qualified investors prior to making any investment decision.
POSITION DISCLOSURE
December 7, 2022 4:15 PM
Long: AMZN217C90, SNAP217C9, QQQ, SPY, TSLA1230C150
Short: AMZN217C105, SNAP217C13
Options symbols are denoted as follows:
Ticker, Date, Call/Put, Strike Price
Example: VXX1218C30 = VXX 12/18 Call with a $30 strike


