Not so fast...
Weekend Market Review January 20, 2023
Last week, momentum and breadth thrusts were all the rage. SPY was back above the 200-day moving average. Bulls were starting to rumble and snort. Early Tuesday the market looked like it wanted to give some follow-through.
But this market has been nothing if not shifty and evasive. So it slipped out of the spotlight and back down to find some support.
So far that support is holding and the week has ended on a high note with SPY right back at the 200-day.
It may not be the breakout many were hoping for. But a quick rebound from the sharp selloff is encouraging.
The Charts
Click to enlarge
SPY continues to consolidate, working its way further into the apex of this triangle. While the resolution, of course, could move in either direction, breadth and seasonality lend to the bullish case. RSI staying above 50 on this pullback is helpful too.
Support has held in the expected areas outlined in Wednesday’s Mid-Week Market Update. The bullish sequence is still active.
QQQ bounced well and is up the most for the day, and the week.
IWM is lagging and has some catching up to do. But a successful retest of the breakout (if that is what the ends up being) is an added bullish sign.
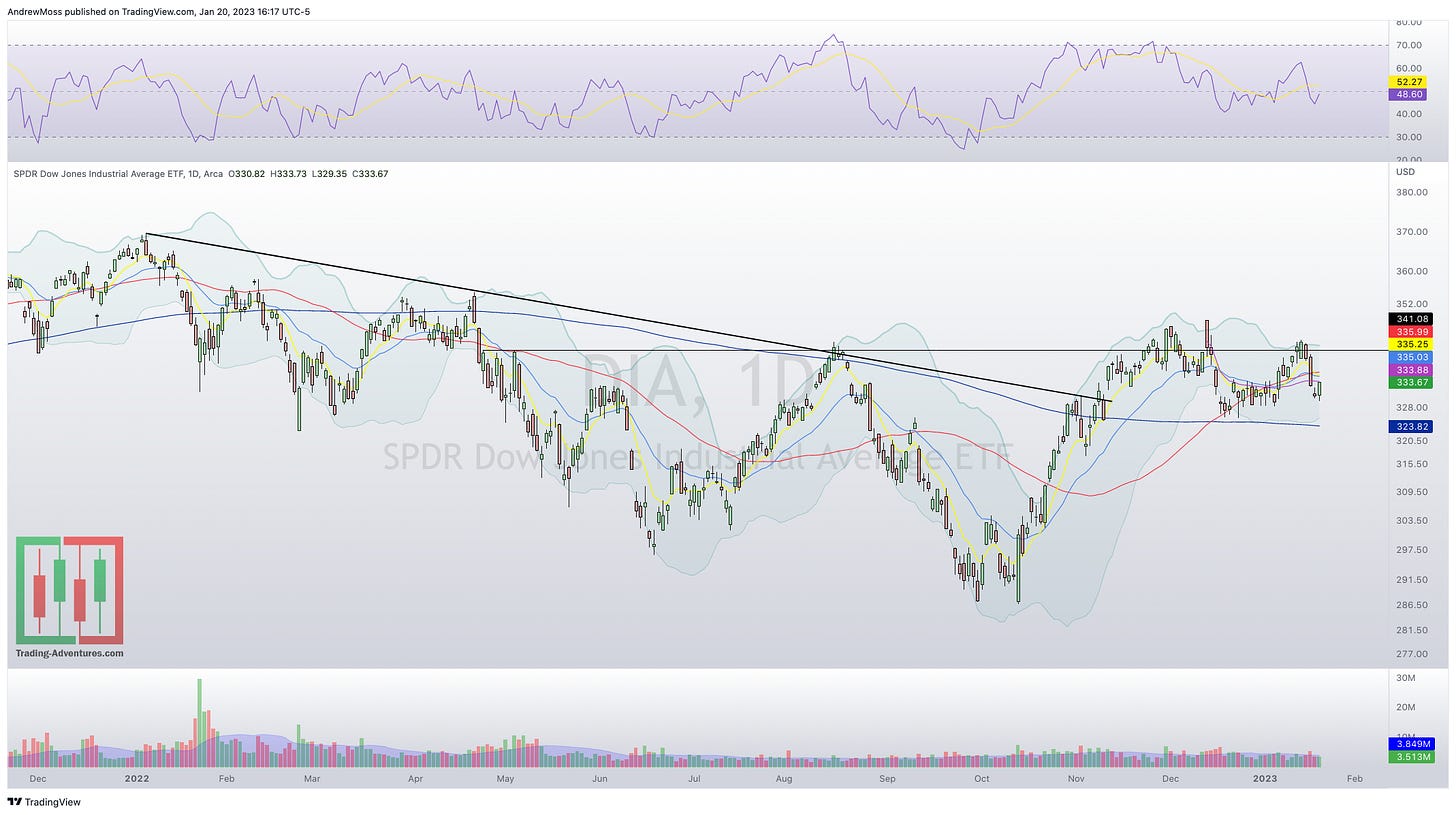
DIA lags a bit on the week. Red flag or rotation? Time will tell.
DXY continues to ride along the 50% retracement level
VIX spiked a bit but hasn’t been threatening
An astute reminder from another market veteran with more years of experience than almost anyone.
No matter how smart.
No matter how experienced.
No matter how good or bad the chart may look.
No one knows what’s going to happen.
The thing that everyone is focused on rarely happens exactly as expected.
Things that everyone thinks are unlikely or even impossible happen all the time.
That’s all for now. Thanks for reading, sharing, and subscribing.
Have questions? Or is there something you’d like to see more of here?
The lines are always open. Reply to this email (if that’s where you’re reading), leave a comment, or better still, @ me on Twitter where I share timely updates throughout the week.
And as always, weekly charts will be there in the morning.
Enjoy the weekend!
***This is NOT financial advice. NOT a recommendation to buy, sell, or trade any security. The content presented here is intended for educational purposes only.
Andrew Moss is an associated member of T3 Trading Group, LLC (“T3TG”) a SEC registered broker/dealer and member of FINRA/SIPC. All trades placed by Mr. Moss are done through T3TG.
Statements in this article represent the opinions of that person only and do not necessarily reflect the opinions of T3TG or any other person associated with T3TG.
It is possible that Mr. Moss may hold an investment position (or may be contemplating holding an investment position) that is inconsistent with the information provided or the opinion being expressed. This may reflect the financial or other circumstances of the individual or it may reflect some other consideration. Readers of this article should take this into account when evaluating the information provided or the opinions being expressed.
All investments are subject to risk of loss, which you should consider in making any investment decisions. Readers of this article should consult with their financial advisors, attorneys, accountants or other qualified investors prior to making any investment decision.
POSITION DISCLOSURE
January 20, 2023, 4:00 PM
Long: AMZN0203C100, PINS0203C27.5, PINS0217C27.5
Short:
Options symbols are denoted as follows:
Ticker, Date, Call/Put, Strike Price
Example: VXX1218C30 = VXX 12/18 Call with a $30 strike


