Trading Adventures

Trading Adventures

Share this post

Trading Adventures
Trading Adventures
Revisiting SPY $380
User's avatar
Discover more from Trading Adventures
I write about charts & trading | Chartered Market Technician, Pro Trader, and former Senior Portfolio Manager at Morgan Stanley | simplifying technical analysis | not investment advice
Over 1,000 subscribers
Already have an account? Sign in

Revisiting SPY $380

Andrew Moss, CMT's avatar
Andrew Moss, CMT
May 23, 2022
1

Share this post

Trading Adventures
Trading Adventures
Revisiting SPY $380
Share

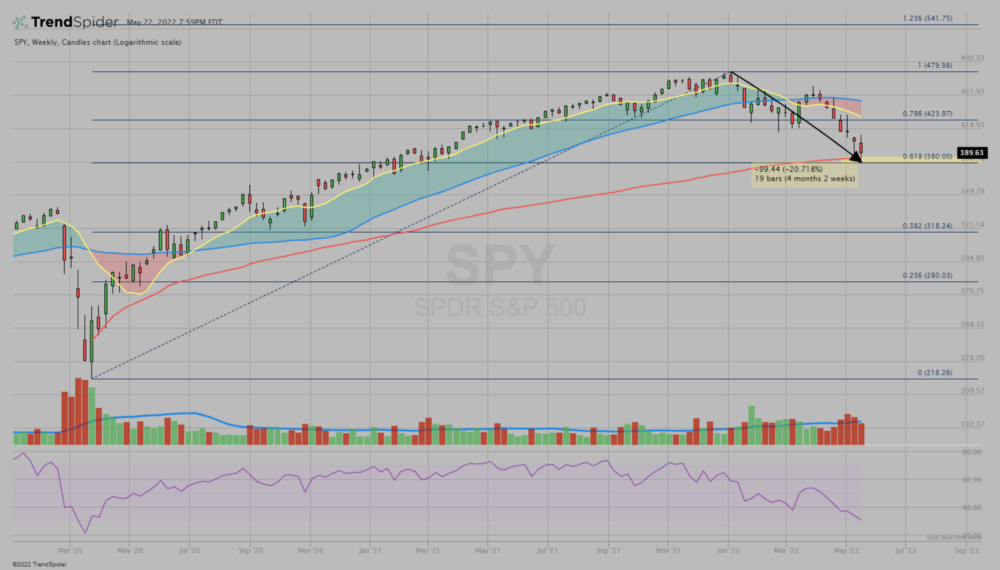
In this entry on May 3rd I laid out a possible route for SPY to move to $380 citing these factors:

So why 380?

It coincides with the Covid low anchored VWAP

It’s at the 38.2% Fibonacci retracement of the bull move. We’ve already seen these levels in $QQQ and $IWM. They are trading there now.

And it would make a nice round -20% selloff and achieve the “official” definition of a bear market.

Last week that target was reached on a move to $380.54. (While I find it fascinating that the 38.2% Fibonacci retracement is precisely $380.00, I’m not at all concerned that we missed it by $0.54.)

$SPY Weekly

$QQQ weekly showing a move to the VWAP anchored at the Dec. 2018 low

So now what?

It looks like time for a bounce to me and I started positioning for one Friday afternoon. Here’s why:

I wrote this note during the Friday session.

12:44 PM I think $SPY and $QQQ could muster up a bounce from these levels. Especially after 7 weeks down. Wow! Add in DeMarks, etc. I’m not long yet. But getting closer I think.

$IWM is the wild card. Pre-covid highs are some support. But there’s a weekly bear flag measured move PO at $163 ish. Hard to see $SPY and $QQQ bouncing soon and $IWM hitting that target. So maybe the pre-covid high holds. Or else all three go lower? We’ll see.

Seven straight weeks of selling is not something that happens very often. Prices don’t go in a straight line forever and now that some key levels have been reached some exhaustion setting in can be expected.

I’m no expert on DeMark indicators, and I do not rely on them for my trading decisions, but since they are designed to indicate trend exhaustion I do pay attention when they show up. You can read more here.

Who really knows whether we get a bounce or not, and how strong it may be. But for me, it looks like a reasonable opportunity to position for one with managed risk. Let’s see how the week goes.


Subscribe to Trading Adventures

By Andrew Moss · Launched 3 years ago
I write about charts & trading | Chartered Market Technician, Pro Trader, and former Senior Portfolio Manager at Morgan Stanley | simplifying technical analysis | not investment advice
1

Share this post

Trading Adventures
Trading Adventures
Revisiting SPY $380
Share

Discussion about this post

User's avatar
In Memory And Appreciation of Dr. Van K. Tharp
I’m very sad to hear of the passing of Dr.
Feb 26, 2022 • 
Andrew Moss, CMT
13

Share this post

Trading Adventures
Trading Adventures
In Memory And Appreciation of Dr. Van K. Tharp
3
2025 Market Outlook
with David Prince
Dec 30, 2024 • 
Andrew Moss, CMT
7

Share this post

Trading Adventures
Trading Adventures
2025 Market Outlook
2
Relative Strength — What Is It? (Really)
Ratio charts. RSI. Ranking systems. Observation. Here’s how traders actually use relative strength — and why the differences matter.
Jun 26 • 
Andrew Moss, CMT
3

Share this post

Trading Adventures
Trading Adventures
Relative Strength — What Is It? (Really)
6

Ready for more?

© 2025 Moss Trading & Technical Analysis
Privacy ∙ Terms ∙ Collection notice
Start writingGet the app
Substack is the home for great culture

Share

Create your profile

User's avatar

Only paid subscribers can comment on this post

Already a paid subscriber? Sign in

Check your email

For your security, we need to re-authenticate you.

Click the link we sent to , or click here to sign in.