Taco Tuesday: Markets, Memes, and a Return to the Charts
A look at price, policy, and patience as markets push higher
Personal Note
👋 Hey everyone!
🕐 It’s been a minute. Over the last few weeks, I’ve taken some intentional time away from the markets and the writing desk—celebrating a big family milestone: my youngest daughter’s high school graduation.
🙏 Thanks to everyone who stuck around while I hit pause. When I mentioned on X yesterday that I’d be back today with an update, the response was enthusiastic—and that’s always appreciated. I’m grateful to be part of a community that’s as interested in these markets as I am.
Let’s get into it.
The Markets
🌮 We’re calling this one Taco Tuesday—not just because it’s Tuesday, but because the meme’s gone mainstream.
TACO stands for “Trump Always Chickens Out,” a term coined by Financial Times columnist Robert Armstrong in early May. It describes a pattern we’ve seen before:
Trump threatens tariffs
Markets flinch
Trump backs off
Prices rebound
Traders have seen this movie before and are increasingly treating it as a setup rather than a scare.
The latest act in the TACO cycle came just last week, when Trump delayed implementation of a 50% EU tariff—giving markets some breathing room and time for speculation to cool. European equities and U.S. sentiment both responded with a sigh of relief.
Zooming out…
Back on May 6, I wrote about SPX retesting “The Line” near 5586—anchored VWAP support combined with the 8- and 50-day MAs. That level held. Since then, we’ve seen a clean, steady advance.
Then on May 10, in the Weekly Charts thread, I flagged widespread indecision:
SPX printed a spinning top candle.
QQQ stalled below its 40-week.
IWM was stuck at the 50% retrace in a rising wedge.
BTC was pushing up, and gold flashed a reversal setup.
Since then? SPX and QQQ resolved higher. IWM broke out. BTC confirmed strength. The gold setup stalled. The Dollar drifted.
A few quiet weeks, a few critical levels respected—and now we’re at new pivot highs.
These are the moments that reinforce a core principle: price is the truth. Not the headlines, not the narratives—just levels, setups, and follow-through.
The Charts
SPY poked its head above the May 19 pivot high today. That makes for a successful retest of the 100/200-day MAs on the recent dip and keeps things pointed at recent highs with all of the key MAs below the price.
RSI is firmly in bullish territory without being overbought. Volume has been close to the average for weeks, and the upper Bollinger Band is beginning to turn higher after flattening out over the last couple of weeks.
The uptrend is resuming.
QQQ is above its 8-day MA (and all the other key MAs) and heading back toward recent highs while the RSI tracks along the 70% line.
Volume is healthy, and the Bollinger Bands are moving steadily higher.
IWM even wants in on the higher action. It hasn’t broken through the recent pivot at $210.13, but it is back over the 100-day MA and an older pivot at $209.27. The 200-day MA near $216 will be the next test higher as long as the 8 and 21-day MAs keep pushing higher from underneath.
DIA moved out of the congestion zone (blue shaded area) to close above its 200-day MA once again, regaining the long-term uptrend. $428.66 is the recent pivot high and would be potential resistance. RSI has plenty of room above as the Bollinger Bands tighten.
TLT was very recently the cause of much heartburn, anxiety, and sleepless nights on Wall Street as it crashed below the $84.89 pivot. Treasury Bond Yields (rising) are still a concern as Treasury Bond prices (falling) search for firmer footing.
This ~$85 area continues to be critical.
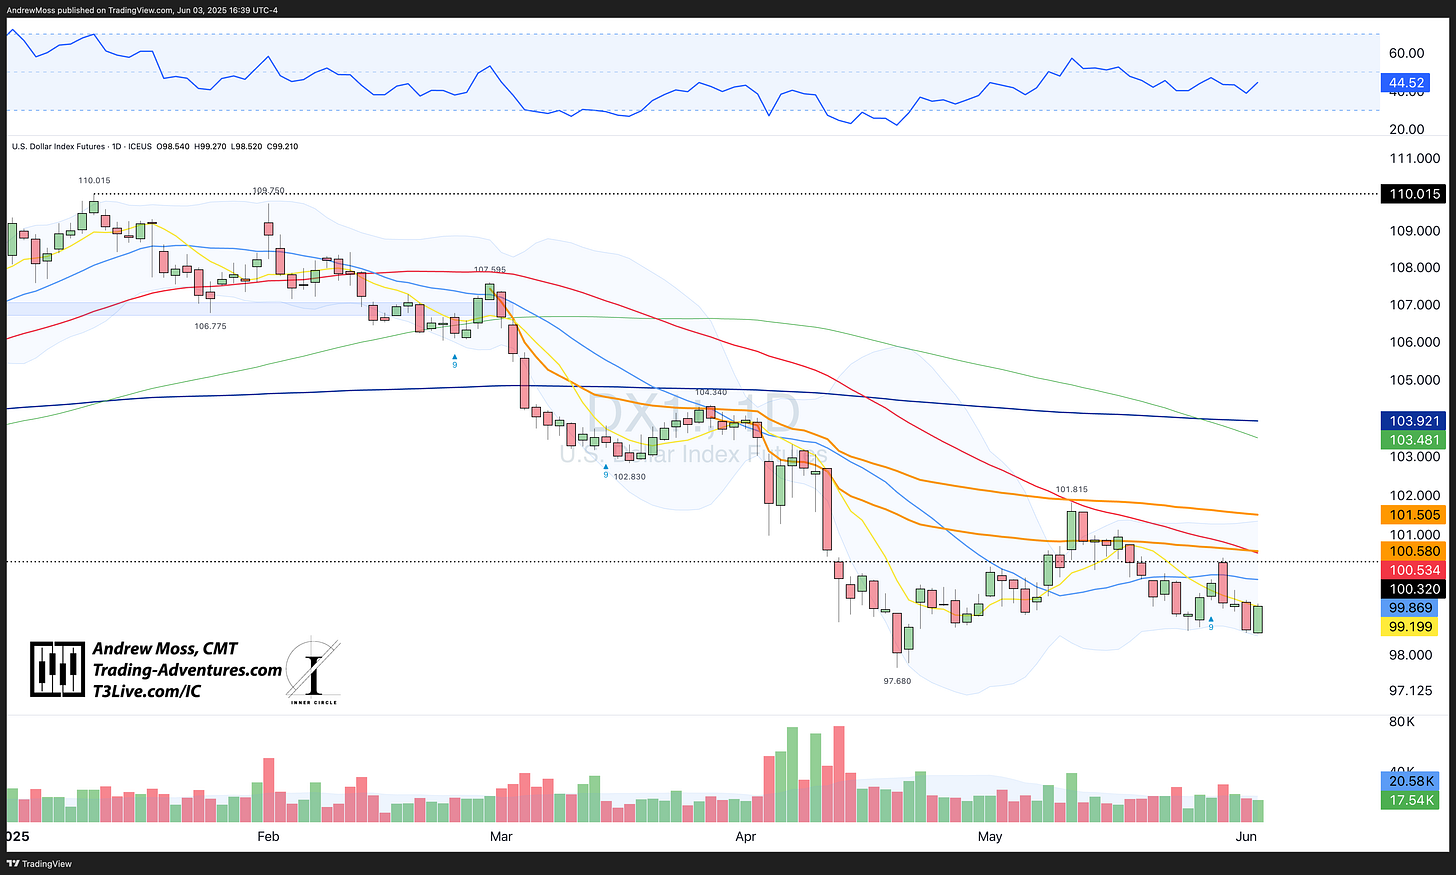
DX1! The Dollar continues to probe its way lower as well. Stocks seem to be fine with that.
BTCUSD Bitcoin, which recently logged a new all-time high at $112,000, is trying to hang in there while forming a potential bear flag just under its 8 and 21-day MAs. A break lower should send it to $102k quickly. That’s where the lower Bollinger Band can be found. Below there, an AVWAP and some MAs are between $95k and $100k.
The Trade
The market’s always sending signals. Right now, those signals point to continuation—not complacency.
The TACO meme highlights an old but useful truth: headlines move fast, price moves cleaner. When policy noise gets loud, the charts still cut through it.
I’m watching a few names for potential continuation or reversion setups—no calls, no hype, just structure and price action. If they develop into something more, we’ll cover it.
Last week, as the market stabilized, EpicTrades caught a clean move in $UNH—calls entered at $10.50 were fully scaled out between $12.85 and $15, with the final trim at $14.12. Textbook execution.
Until then, it’s back to work, back to structure, and back to the charts.
Looking For More?
Elevate Your Trading Adventure Even Further With These Offerings.
EpicTrades Options Newsletter
Real-time trade ideas and insights, providing actionable trading insights focusing on options trades with short-term horizons, aiming to capitalize on weekly market movements.
The approach includes detailed reasoning for trades, specific options, and profit targets. It focuses on quick gains with a minimal time commitment from subscribers.
The Inner Circle
The Inner Circle is a Virtual Trading Floor (VTF) at T3 Live. I’ve been working and trading with this group since 2022. You may have noticed the logo in the watermarks on my charts.
Founded by David Prince and led by him, Rick March, and Kira Turner, the Inner Circle is a community of elite traders, including hedge fund managers, family office heads, corporate executives, financial advisors, and even professional poker players.
Fundamental, Macro, and Technical Analysis all combine to find and discuss the best opportunities in current markets.
The Disclosures
***This is NOT financial advice. This is NOT a recommendation to buy, sell, or trade any security. The content presented here is intended for educational purposes only.


