The Markets
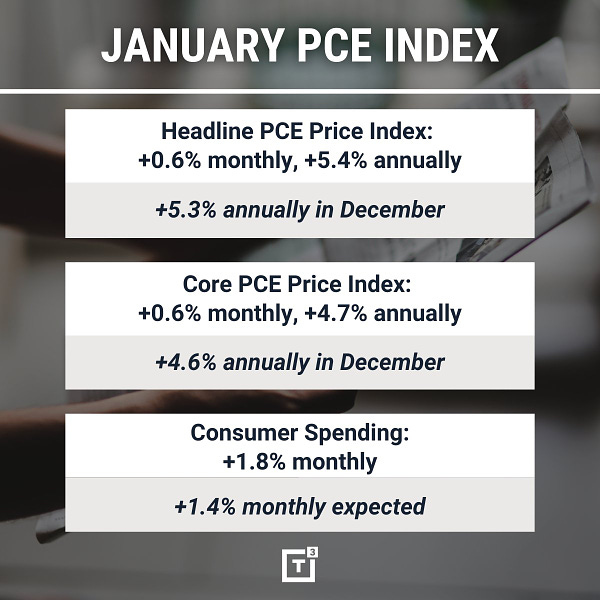
This morning we got the latest installment of, “The Most Important Thing” in the form of the PCE.
And what is PCE, you ask?
A shortened acronym for Personal Consumption Expenditures Price Index.
It is supposedly the Federal Reserve’s preferred measure of inflation. The US Bureau of Economic Analysis defines it as….
The results:
PCE rising = Stocks falling.
That news took stocks down and QQQ was down more the -2% and slightly below its 200-day moving average at one point; an event that seemed to become a forgone conclusion over the last couple of days.
Let’s get to the charts.
The Charts
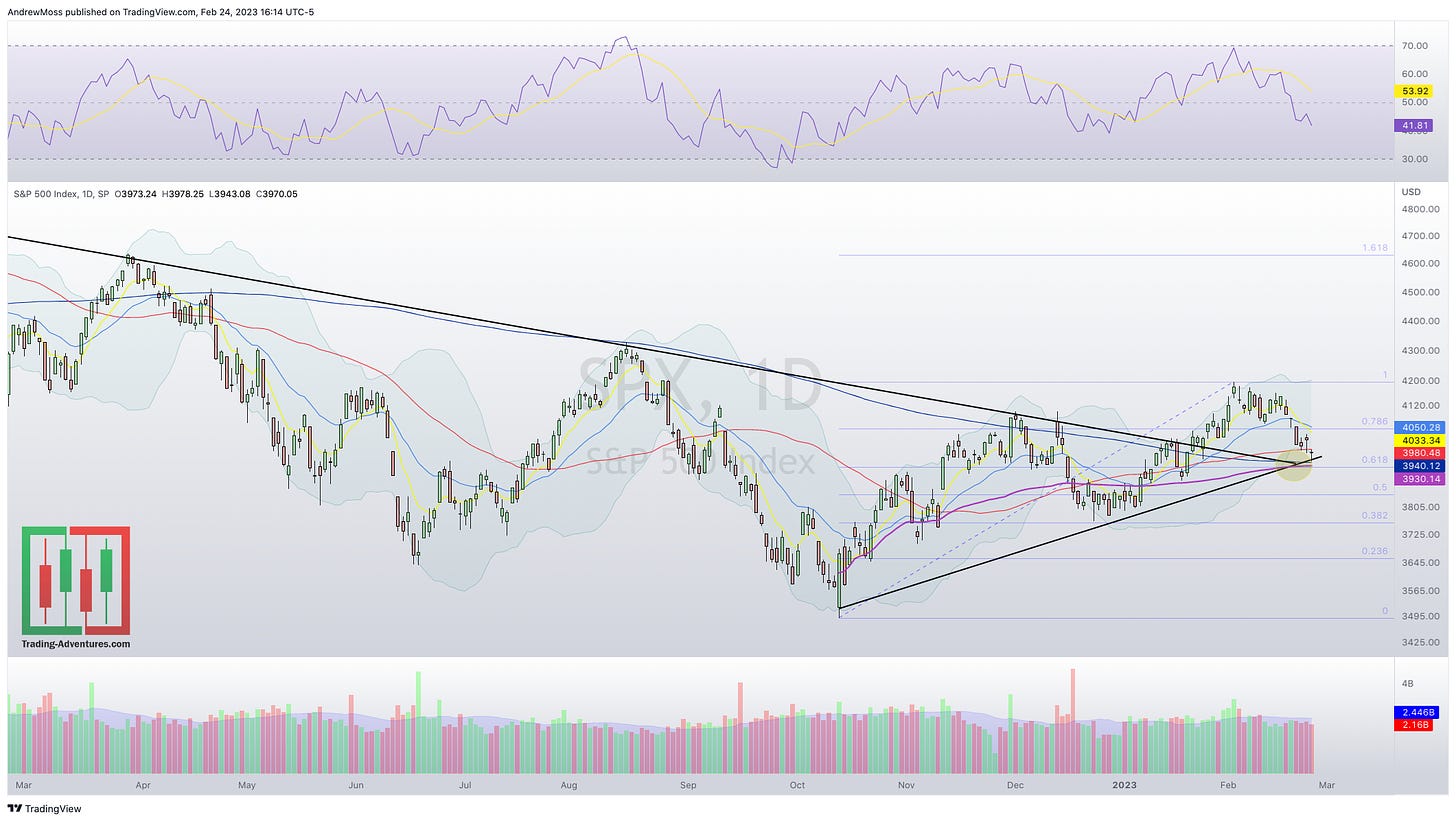
SPX went as low as 3943.08 today. The 200-day MA is 3940.12. Not quite a touch, but we're probably better served not to get hung up on precision here. The bigger picture is still the vast grouping of potential support nearby.
This is an update to Wednesday’s Chart of the Day and has the addition of a Fibonacci retracement level. To refresh the numbers, potential support is:
200-day MA — 3940.12
Downtrend line extending back to the all-time high
The shorter-term uptrend line extending back to the Oct. ‘22 low
And the VWAP anchored to that same low — 3930.14
38.2% Fibonacci retracement of the Oct. 22 low to the Feb. 23 high — 3926.57
Above those levels and the bullish trend is still in place. Below that, things change.
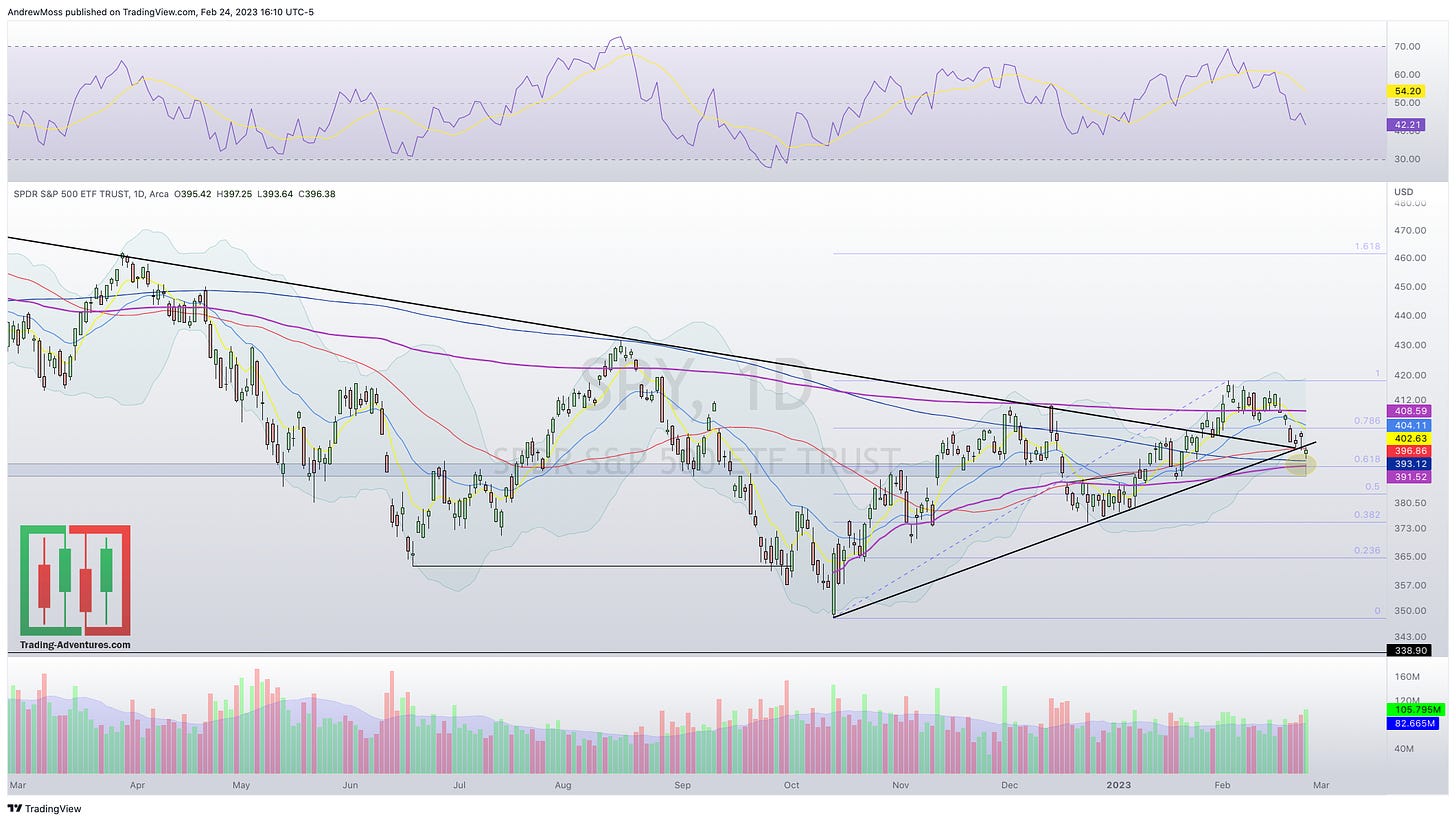
SPY
200-day MA — 393.12
Downtrend line extending back to the all-time high
The shorter-term uptrend line extending back to the Oct. ‘22 low
And the VWAP anchored to that same low — 391.52
38.2% Fibonacci retracement of the Oct. 22 low to the Feb. 23 high — 391.49
QQQ
200-day MA — 290.12
VWAP anchored to the Dec. ‘22 pivot low — 289.49
38.2 Fibonacci retracement — 290.98
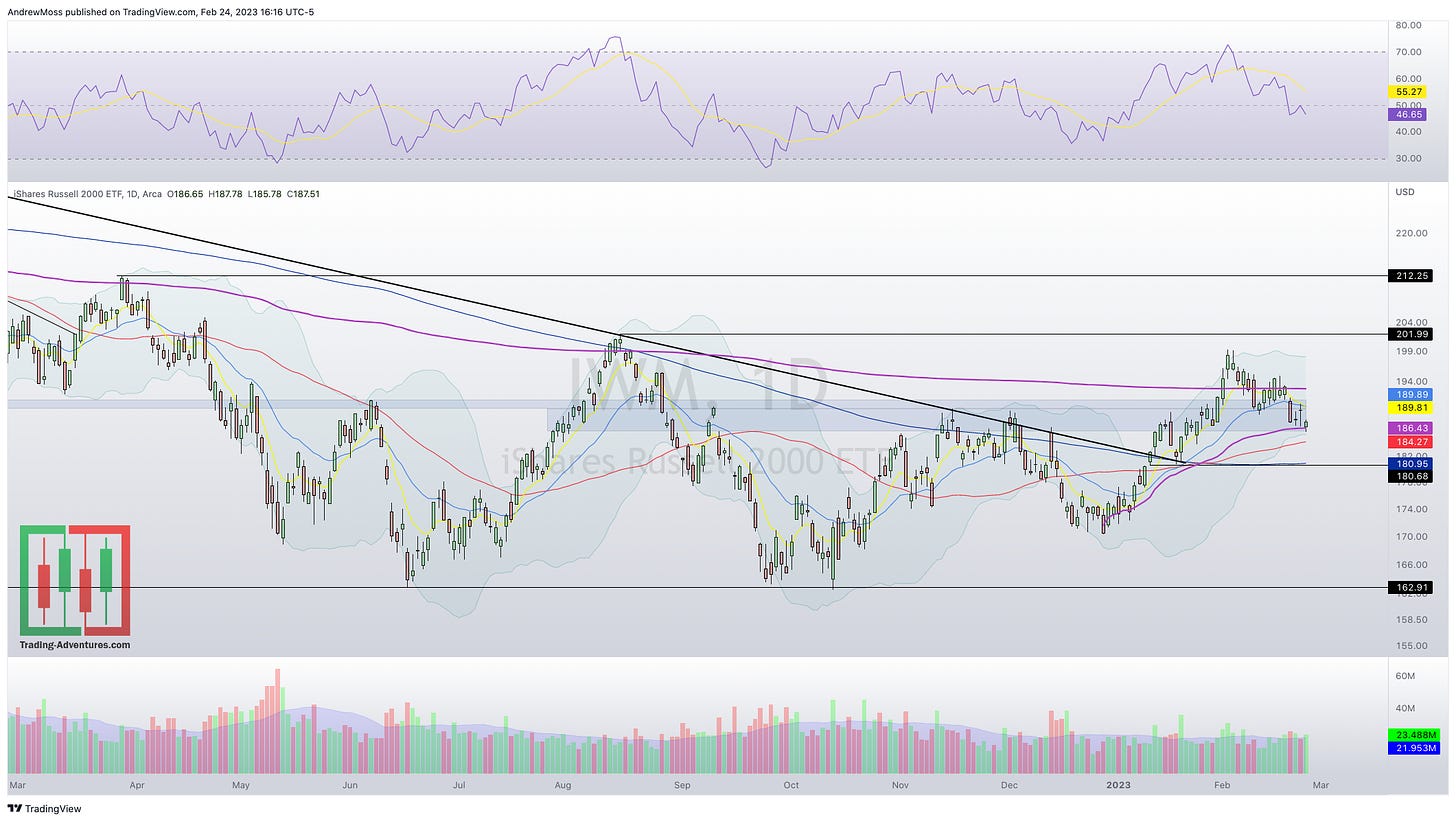
IWM is retesting the broad support/resistance zone of 186-191.
VWAP anchored to the Dec. ‘22 pivot low — 186.43
50-day MA 184.26
200-day MA 180.94
DXY The Dollar continues to be the real problem. The inverse relationship of stocks/dollar looked to be relaxing, or at least slowing a bit. Today’s action cast some doubt on that idea.
VIX is elevated, but still fairly calm.
Where do we go from here?
We’ve been seeing classic bull market action for several weeks. So far, this pullback still hasn’t progressed into anything overtly bearish and is still consistent with typical February seasonality.
But as we seek to properly identify the “lay of the land” and make game plans for what may be next, there is a possibility that hasn’t gotten much attention so far.
That is; What if the market just kind of does nothing for a while?
Does it have to be a straight-up Bull Market?
Of course not.
If it’s not, does that mean we’re going straight back to the lows? And beyond?
It’s a possibility. It’s also possible that the lows are in and that new highs are still a long way off in the future.
In the conversation linked below, Helene Meisler explores this idea, which I’ve been pondering for a few days as well.
She mentions the period from 1975-1982, adding that present-day SP 500 trading back and forth between 3100 and 4200 would be similar.
(The whole conversation is great, and you should definitely listen. But you can skip to the 26.45 mark for this part if you want that first)
Something to be mindful of.
Just like portfolios don’t have to be “all-in” or “all-out,” markets don’t have to be all “bull” or all “bear.”
The choppiness could continue.
What I’m reading and listening too
I’ve mentioned several times, my anticipation of this book.
Maximum Trading Gains with Anchored VWAP by Brian Shannon
I’ve finally had a chance to read it, and it is fantastic. Anchored VWAPs continue to fascinate and surprise me. And Brian’s lessons in this book offer a deeper understanding of how and where to use this indicator, and how it can help identify hidden areas of support and resistance.
It also contains elegant nuggets such as this.

Howard Lindzon’s podcast “Panic with Friends” is always a fun, entertaining, and enlightening listen. His guests are always top-tier, and his interviewing skills keep things conversational and welcoming. It’s almost as if you're sitting there with them.
Check this one out with technical analysis legend, and queen of hand-drawn charts, Helene Meisler.


That’s it for today’s edition.
Don’t forget the weekend weekly charts - a great chance to zoom out and consider the bigger picture.
Find it here every Saturday morning. @Andy__Moss on Twitter
And tell a friend!
***This is NOT financial advice. NOT a recommendation to buy, sell, or trade any security. The content presented here is intended for educational purposes only.
Andrew Moss is an associated member of T3 Trading Group, LLC (“T3TG”) a SEC registered broker/dealer and member of FINRA/SIPC. All trades placed by Mr. Moss are done through T3TG.
Statements in this article represent the opinions of that person only and do not necessarily reflect the opinions of T3TG or any other person associated with T3TG.
It is possible that Mr. Moss may hold an investment position (or may be contemplating holding an investment position) that is inconsistent with the information provided or the opinion being expressed. This may reflect the financial or other circumstances of the individual or it may reflect some other consideration. Readers of this article should take this into account when evaluating the information provided or the opinions being expressed.
All investments are subject to risk of loss, which you should consider in making any investment decisions. Readers of this article should consult with their financial advisors, attorneys, accountants or other qualified investors prior to making any investment decision.
POSITION DISCLOSURE
February 24, 2023 4:00 PM
Long: ABNB0317C125, ENPH, GS0303C370, SPY0303C400, QQQ0303C295
Short:
Options symbols are denoted as follows:
Ticker, Date, Call/Put, Strike Price
Example: VXX1218C30 = VXX 12/18 Call with a $30 strike


