📈Weekly Charts📉 11/1/2025
Good morning☕️
Time for the 📈Weekly Charts📉 (and some monthlies too).
As markets extend higher with mixed earnings and breadth concerns, it’s critical to step out of the daily noise and back up to see the bigger picture.
Let’s get to it.
Reminder: click on the first chart to open a bigger view. Then use your arrows keys to scroll through all the images.😉
📊 U.S. Indexes
S&P 500 (SPX)
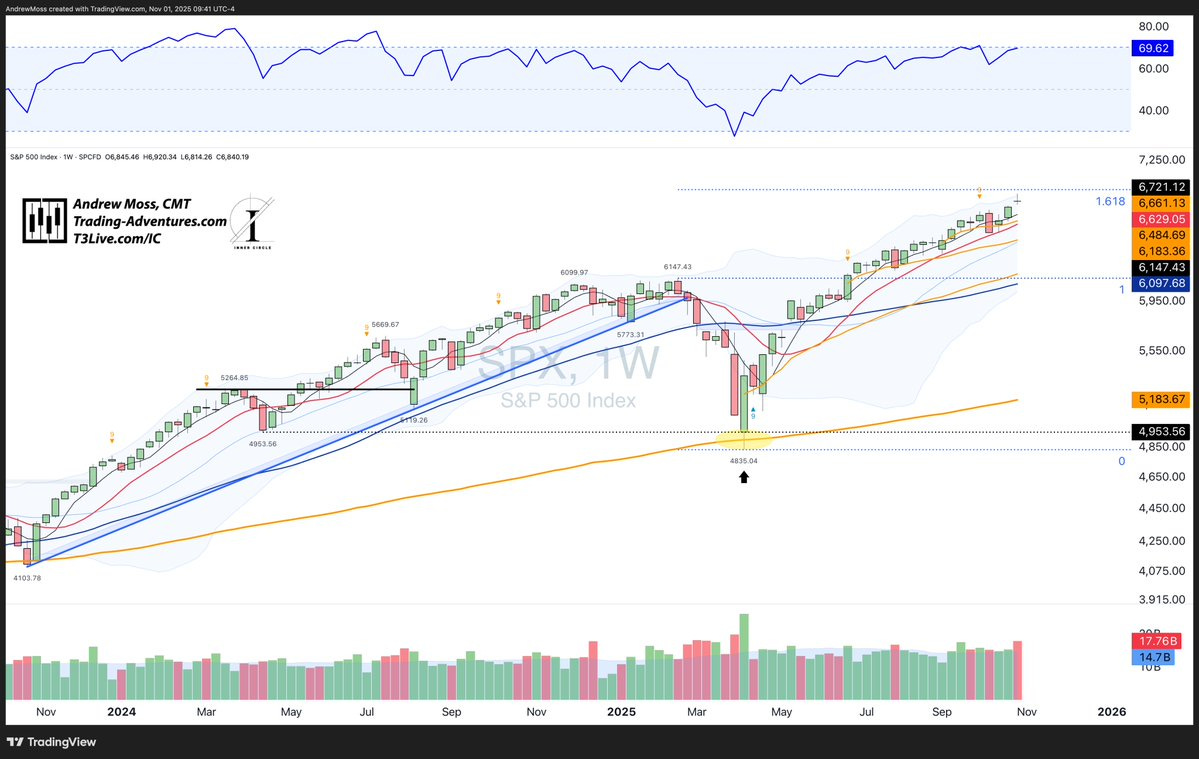
Finished the week flat—open matched close—printing a weekly doji just under the 1.618 extension.
🔹Indecision?
🔹Exhaustion?
🔹 Or just a pause after three strong weeks?
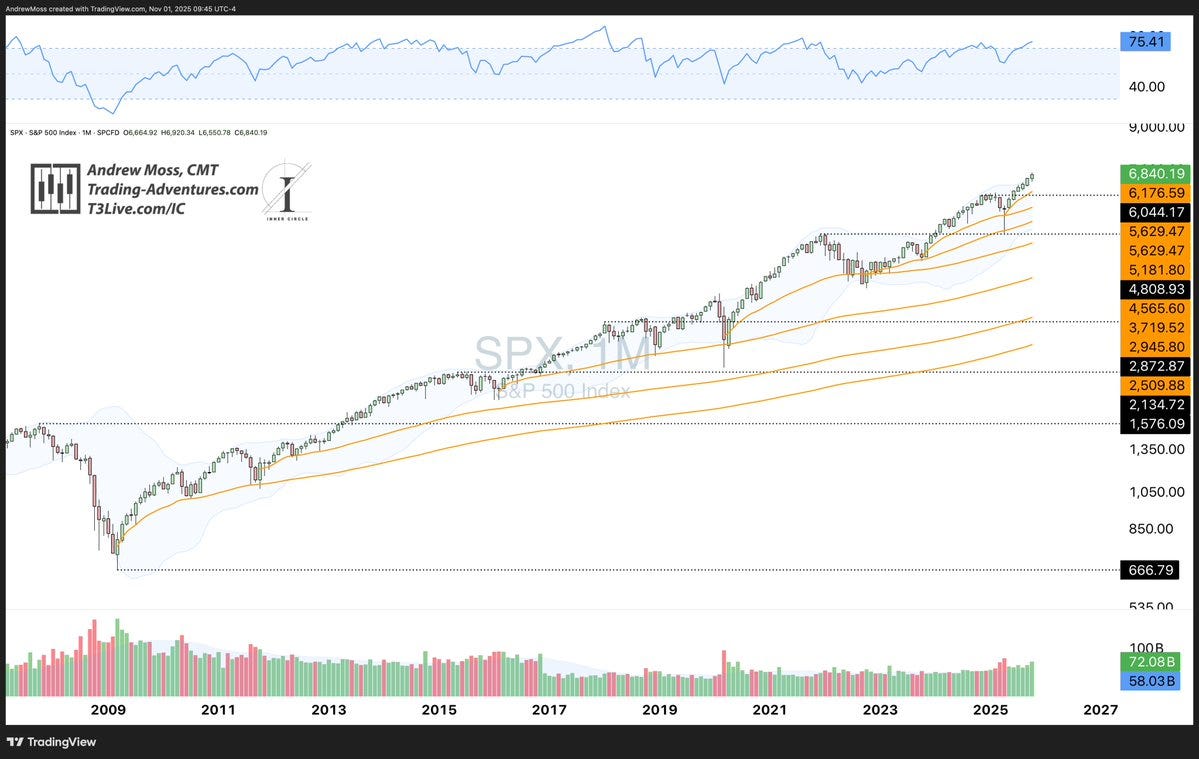
The monthly chart shows six straight rising candles from the April dip.
Strength and momentum are still firing on all cylinders.
Nasdaq 100 (QQQ)
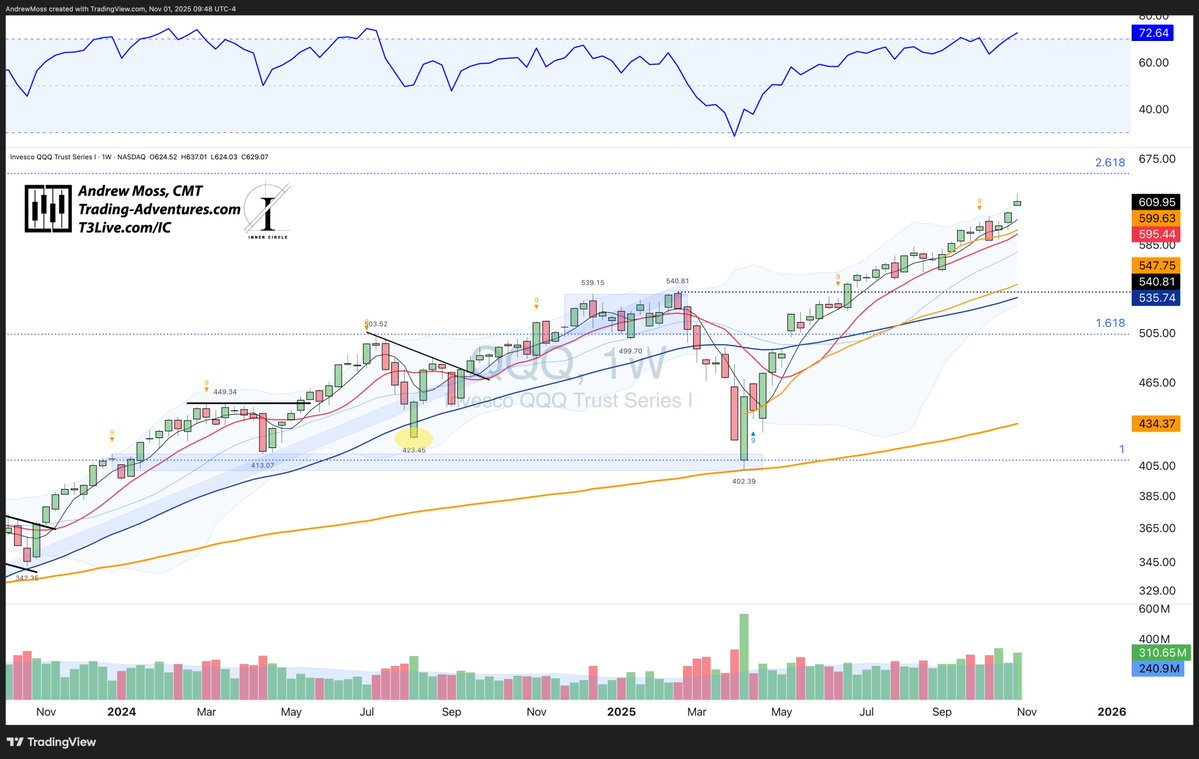
Strong gap higher that backed off the highs, resulting in a potential shooting star pattern on the weekly.
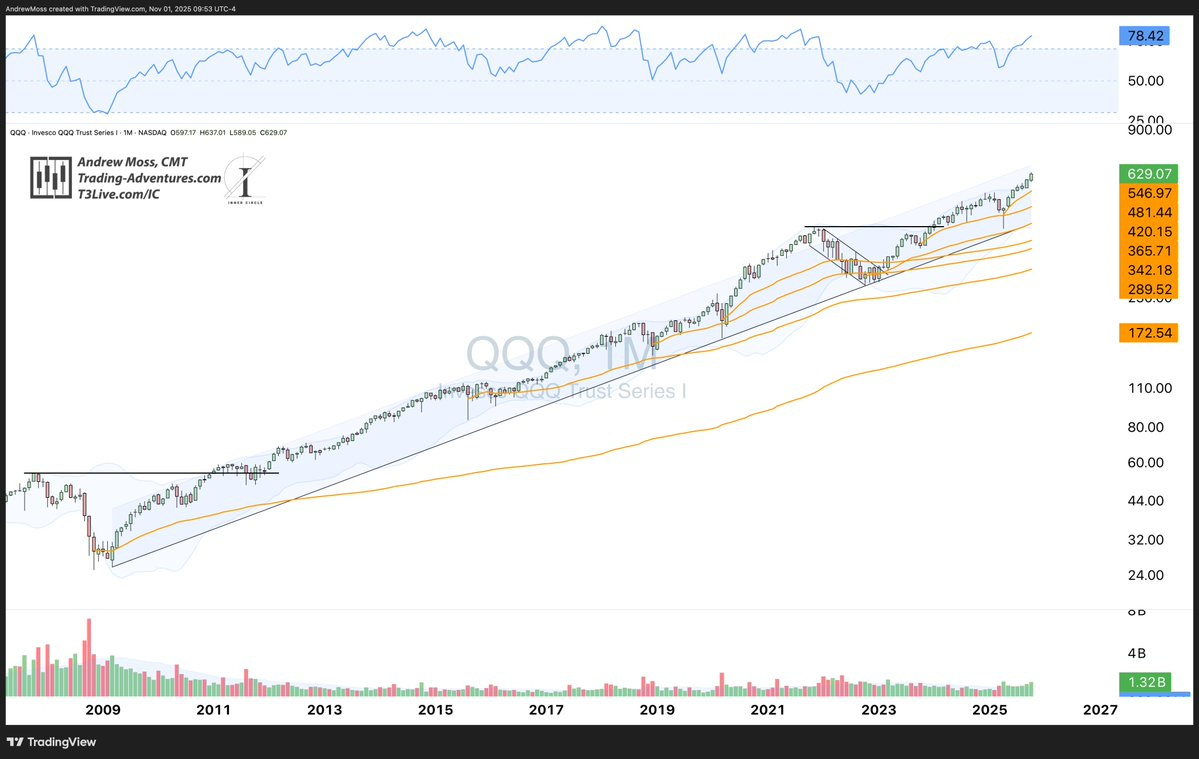
The monthly is cruising along near the upper reaches of the long channel, dragging the Bollinger Bands higher with it.
Volume has increased for three months. RSI is very strong at >78.
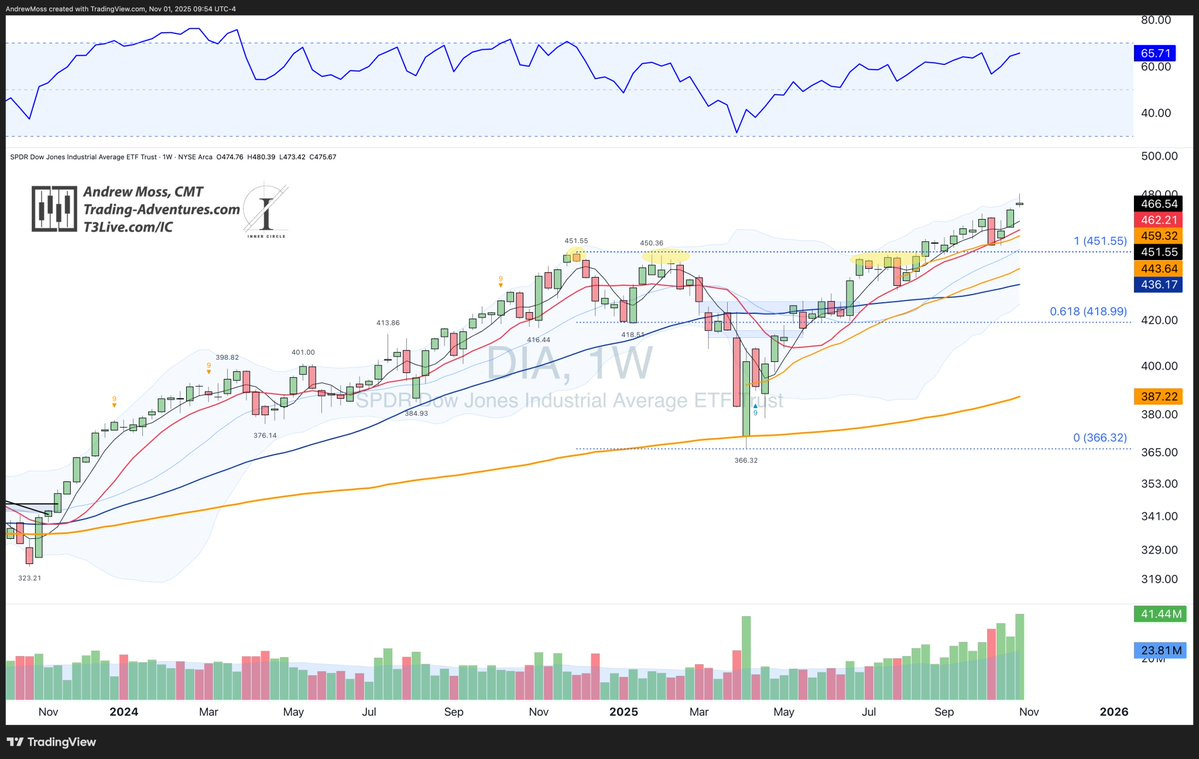
Dow Jones (DIA)
Also has a potential shooting star candle, touching the upper Bollinger Band.
It was the highest volume week on the chart.
RSI at 65.71 still has room above.
🌍 Small Caps & International
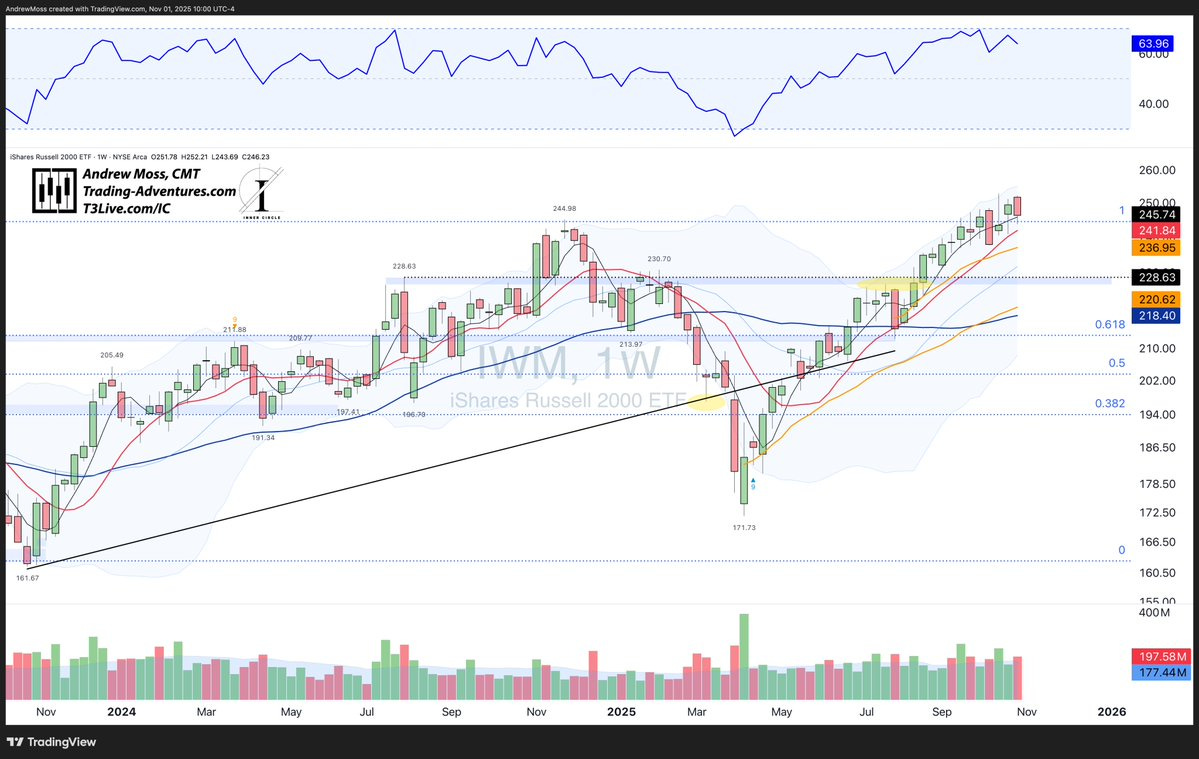
Russell 2000 (IWM)
Closed red on the week, pulling back to the 4-week MA and the ~$245 breakout zone.
Still struggling to gain traction as flows continue rotating into $QQQ and mega-cap tech.
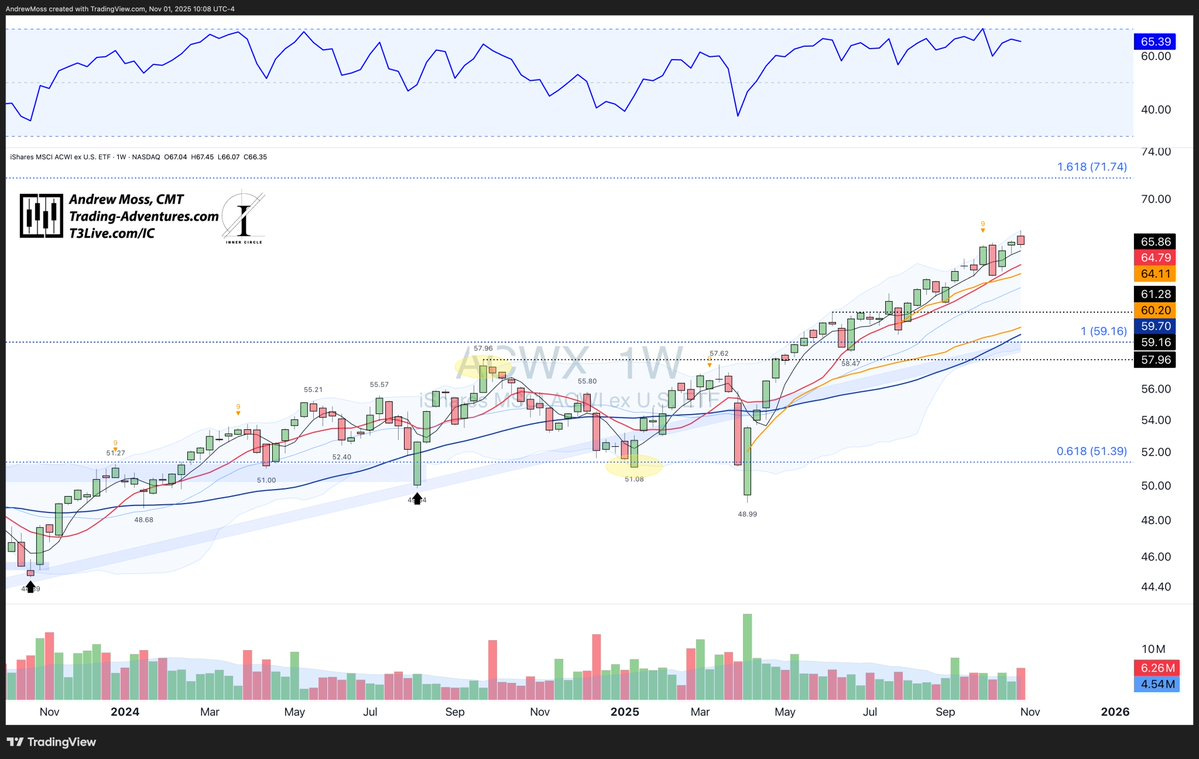
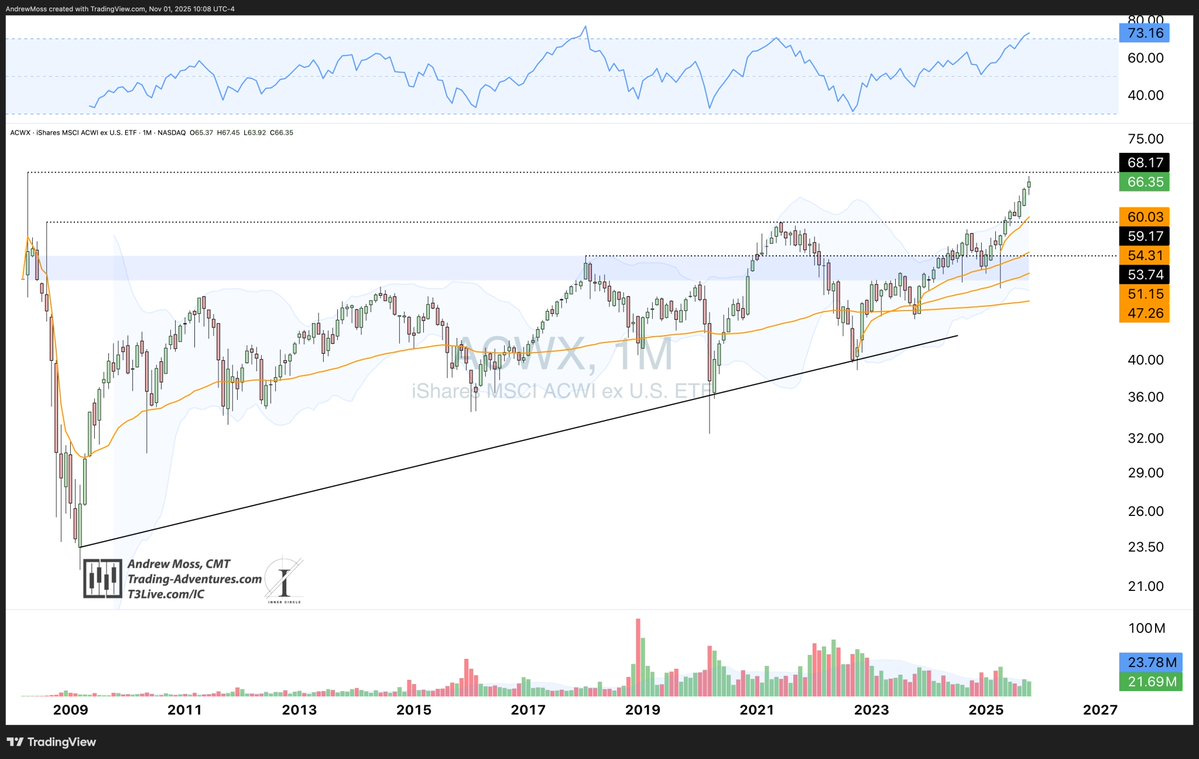
ACWX (All‑Country ex‑US)
Tagged a new weekly high before fading slightly. Still holding above the moving averages.
On the monthly, it came close to a new all-time high -- a level not seen since its first month of trading in March 2008.
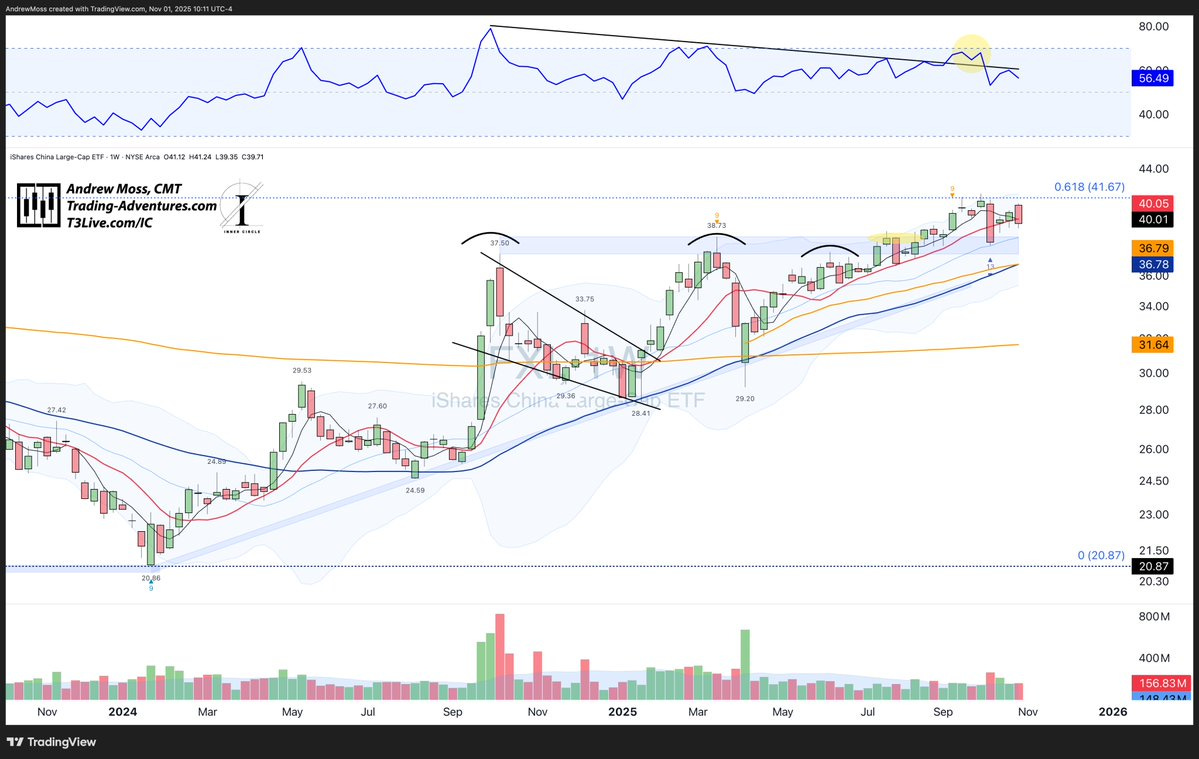
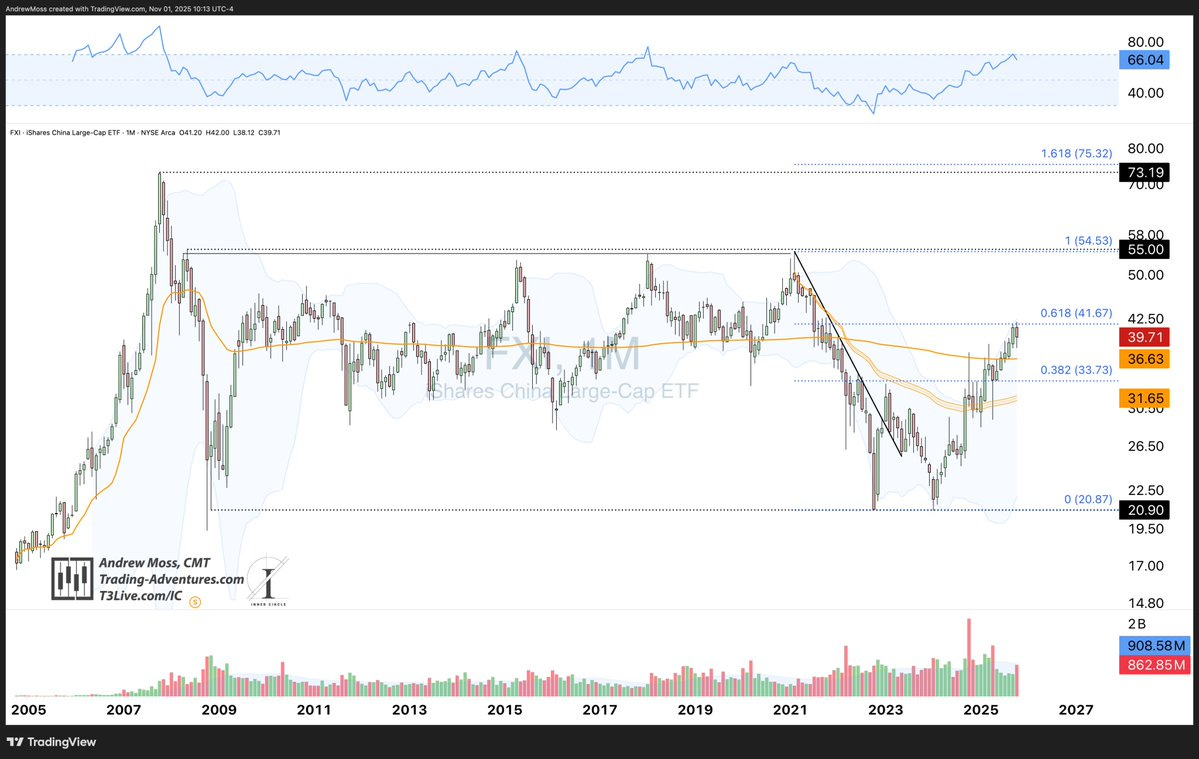
FXI (China)
An outside week as it continues to struggle at the 61.8% retracement.
Monthly shows the longstanding $55 lid, still well above current prices.
🧱 Bonds & Commodities
Bond Monthlies
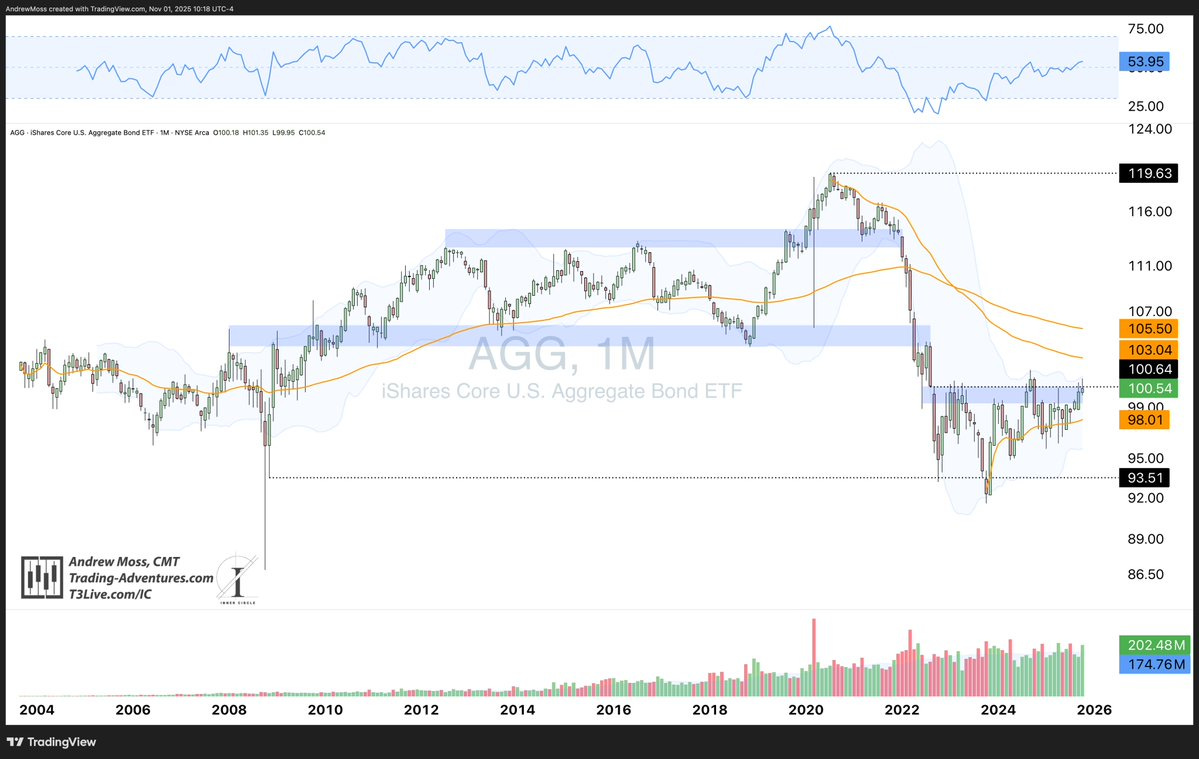
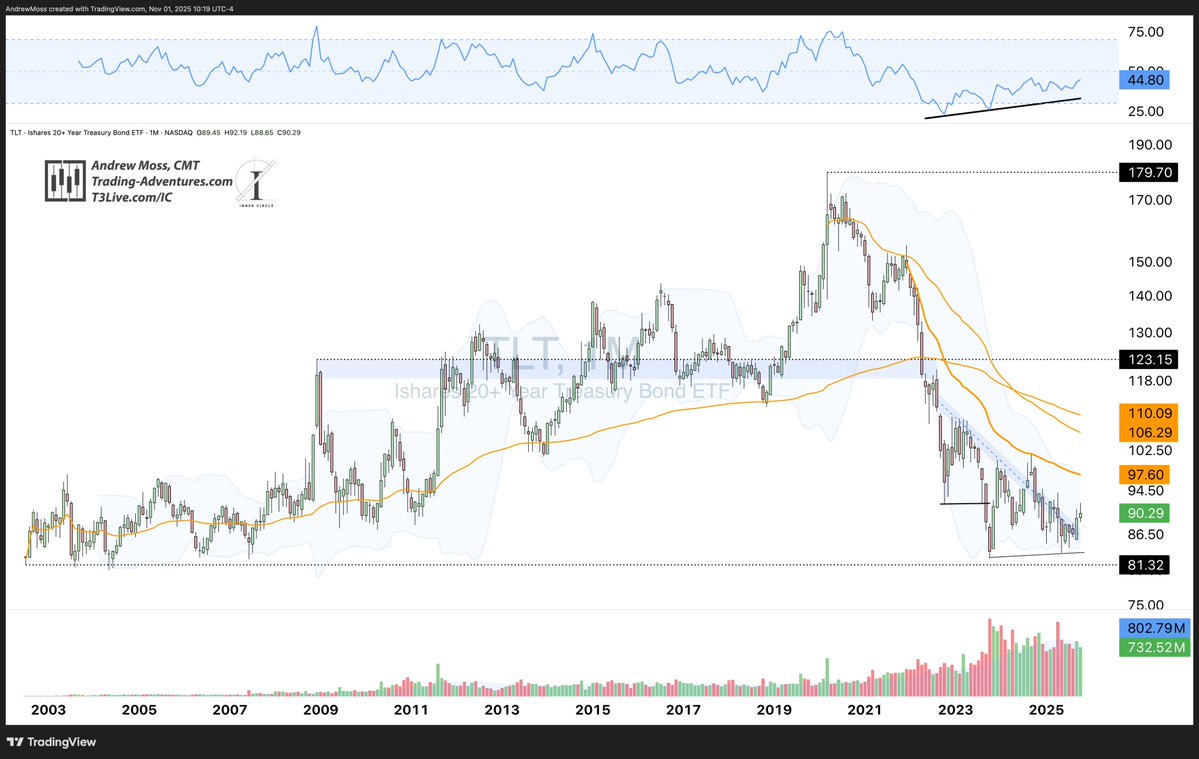
Quality bonds (AGG, TLT)
AGG showing improvement, but still facing resistance near $100.50.
TLT looking better, though a true trend reversal remains distant.
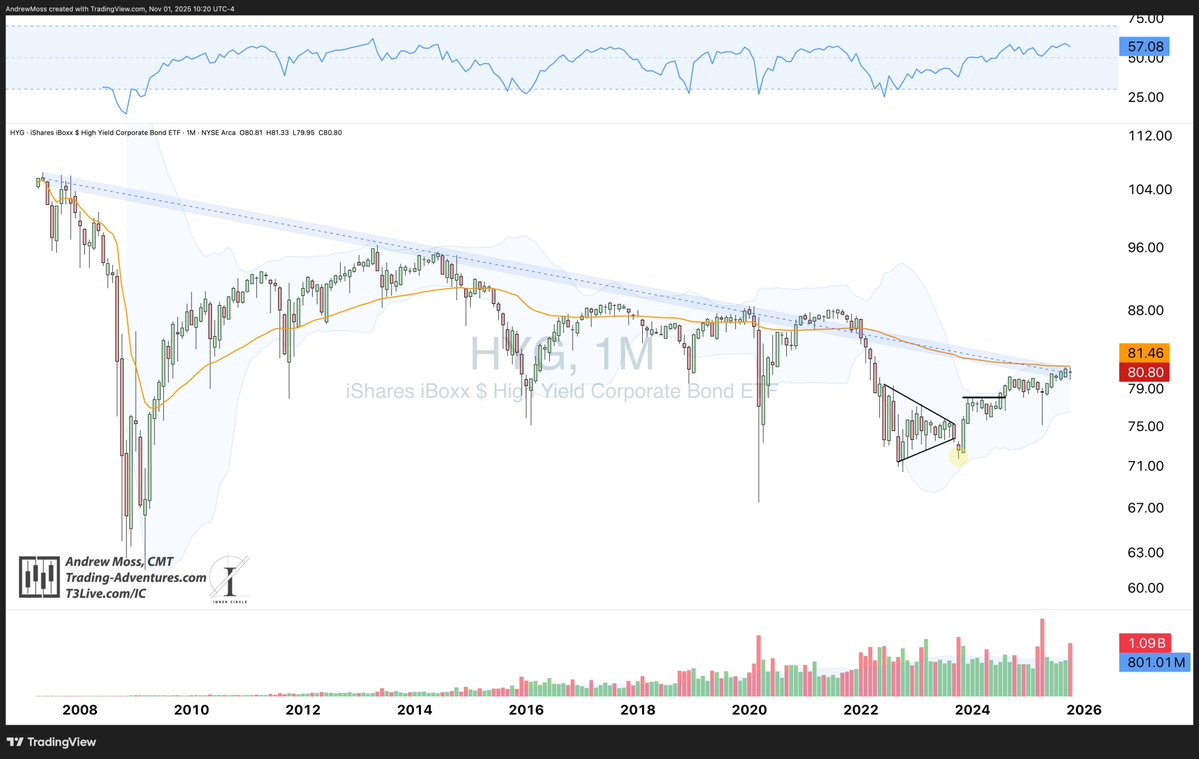
High‑yield credit (HYG)
HYG is pressing into a key zone — a multi-decade trendline and AVWAP🟠 from inception. A strong breakout here could shift the tone for credit markets.
Commodities:
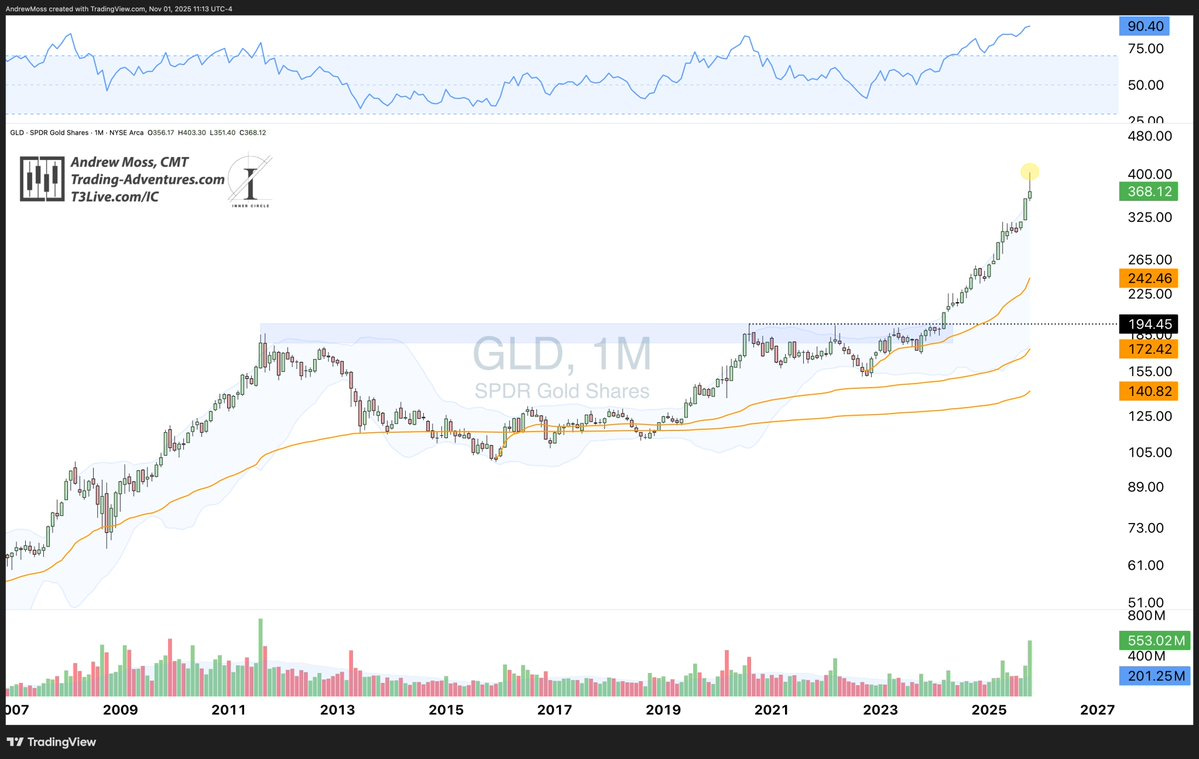
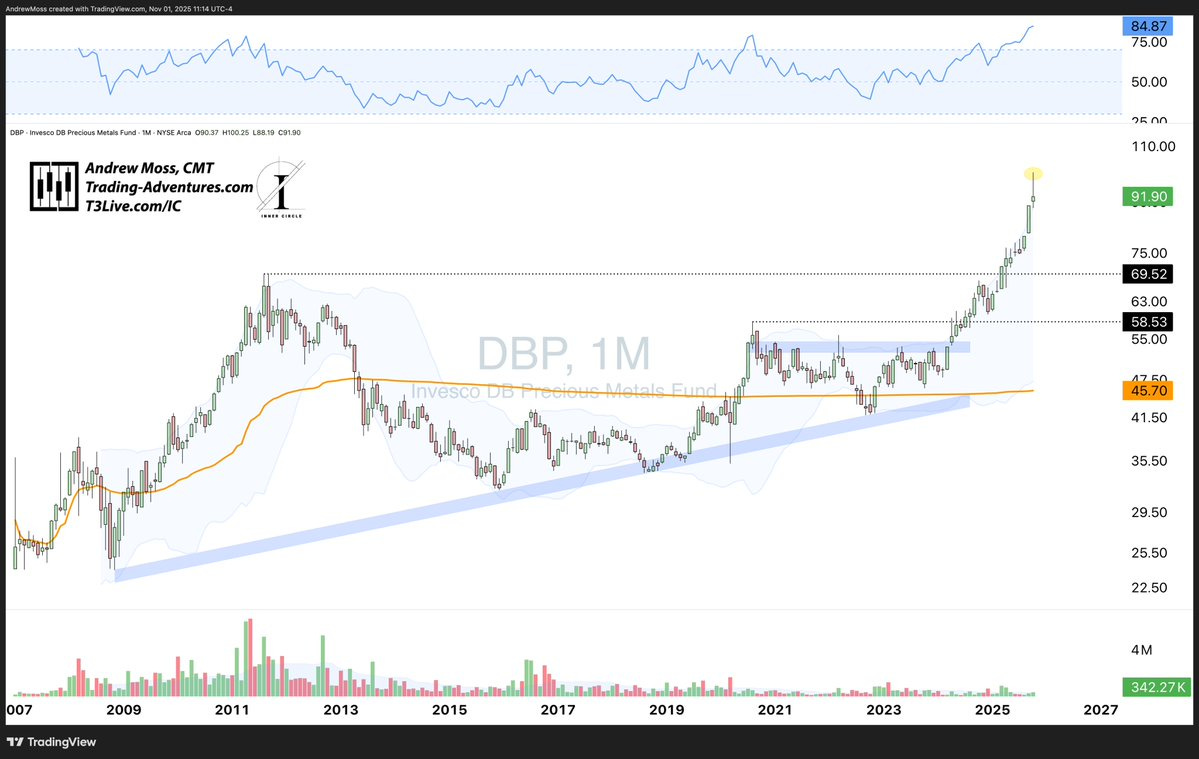
GLD DBP Gold & Precious Metals (Monthly)
⚠️ Potential topping candle
📈 RSI at the highest level on record
A pullback wouldn’t break the structure, but follow-through from here would be notable. Something to keep an eye on.
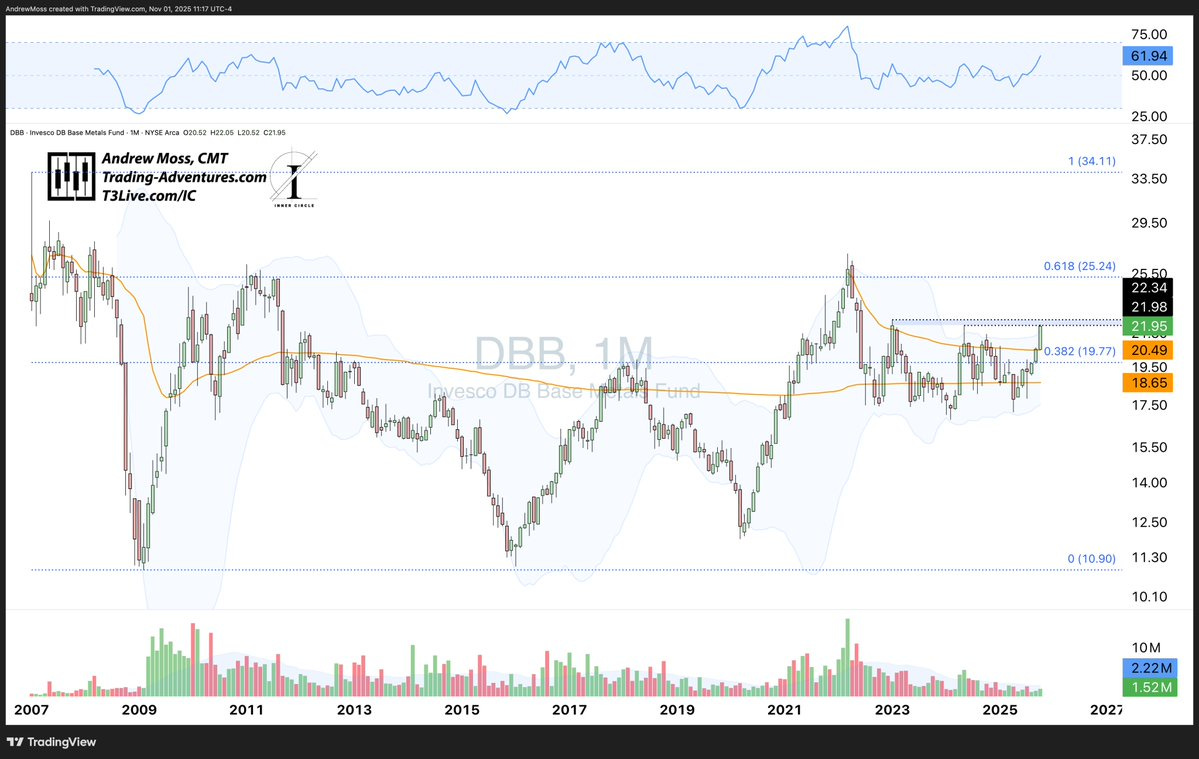
DBB Base Metals Monthly
Nearly breaking out w/ an RSI of ~62
💵 U.S. Dollar
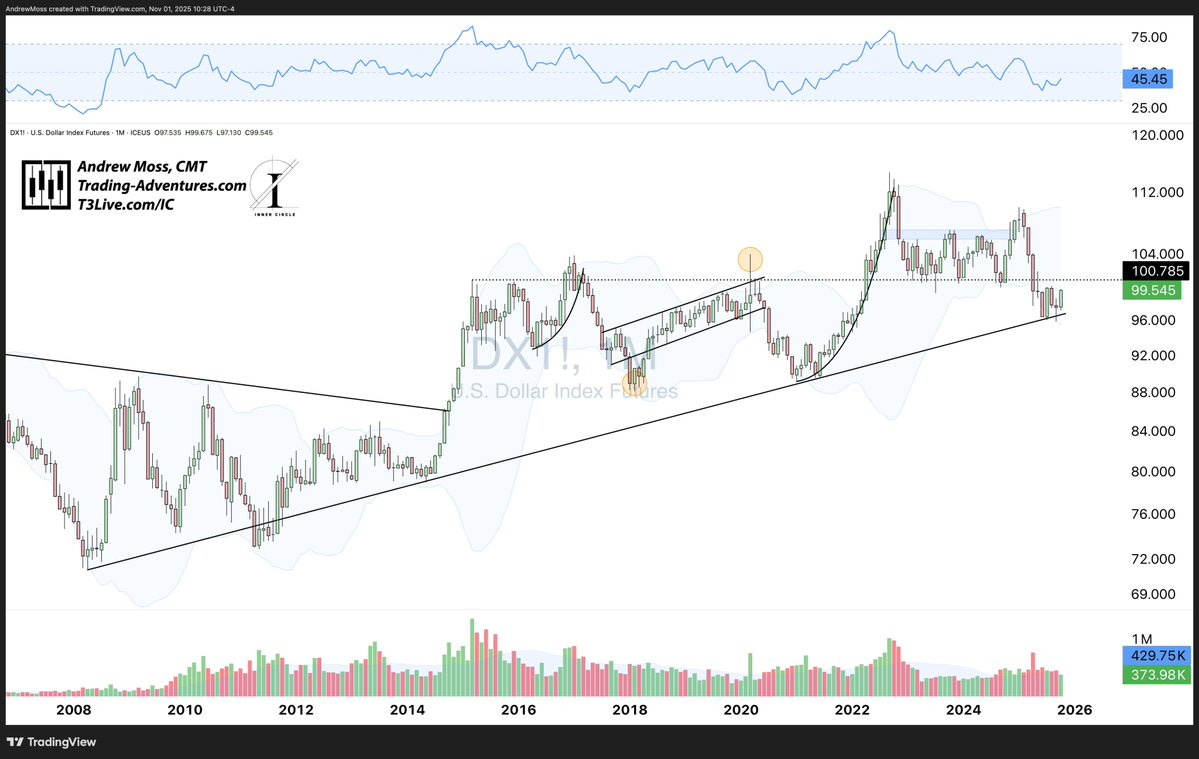
The Dollar is still holding the long-term trend.
₿ Crypto Check
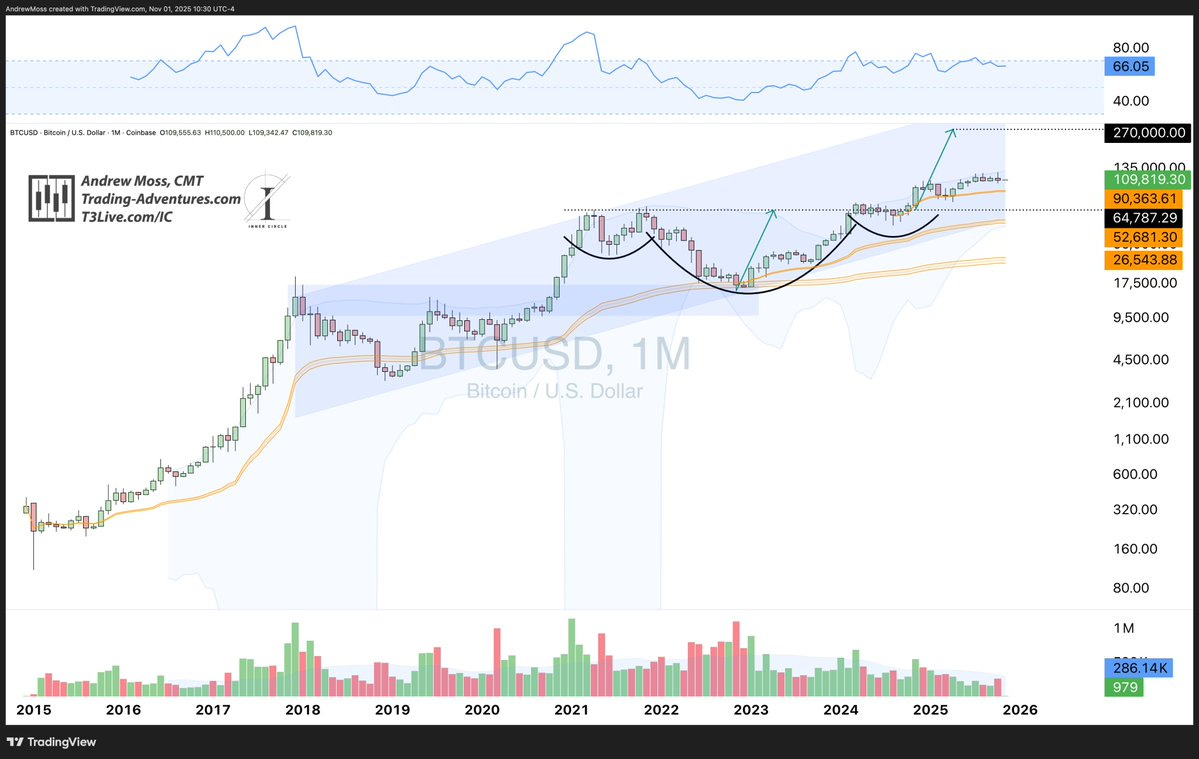
BTC Bitcoin is flat for ~6 months as markets speculate as to whether or not this asset has ‘matured’ and reached fair value.
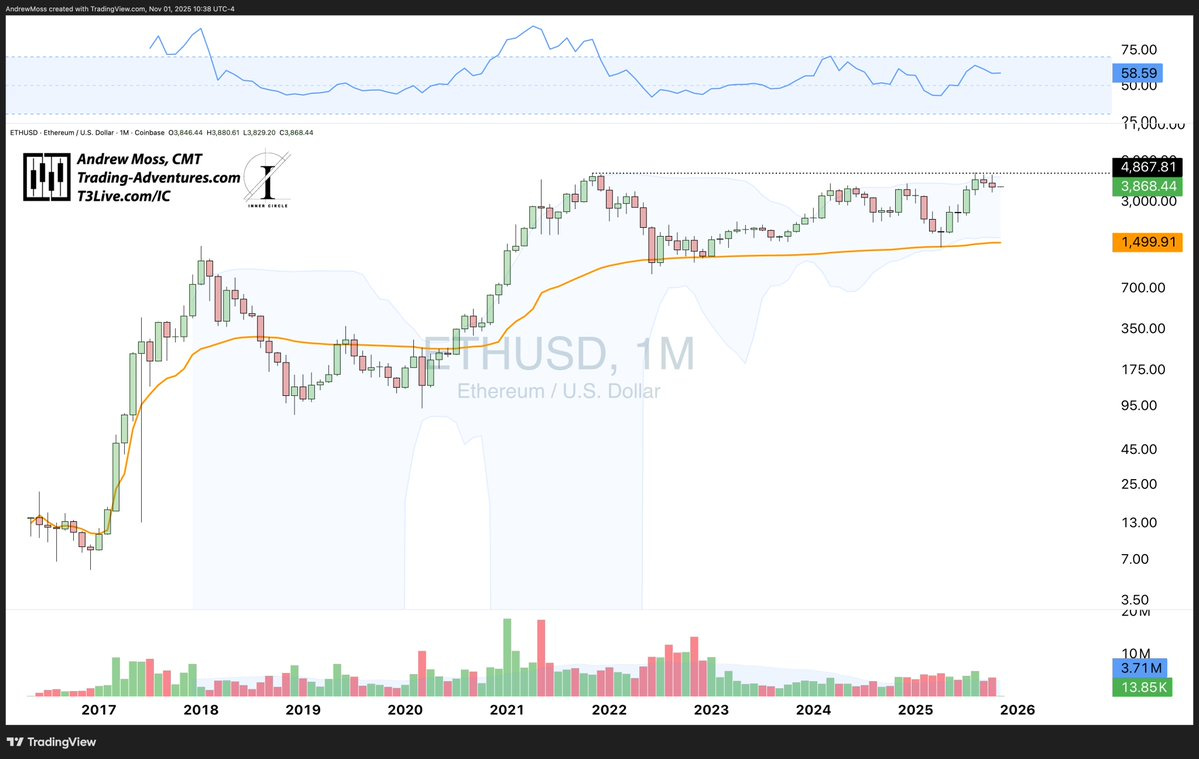
ETH Ethereum has also been unable to break higher. Now three months of tight consolidation after grazing the $4867 pivot in August.
Building energy for the next wave?
🔁 Relative Strength & Participation
💪Relative Strength
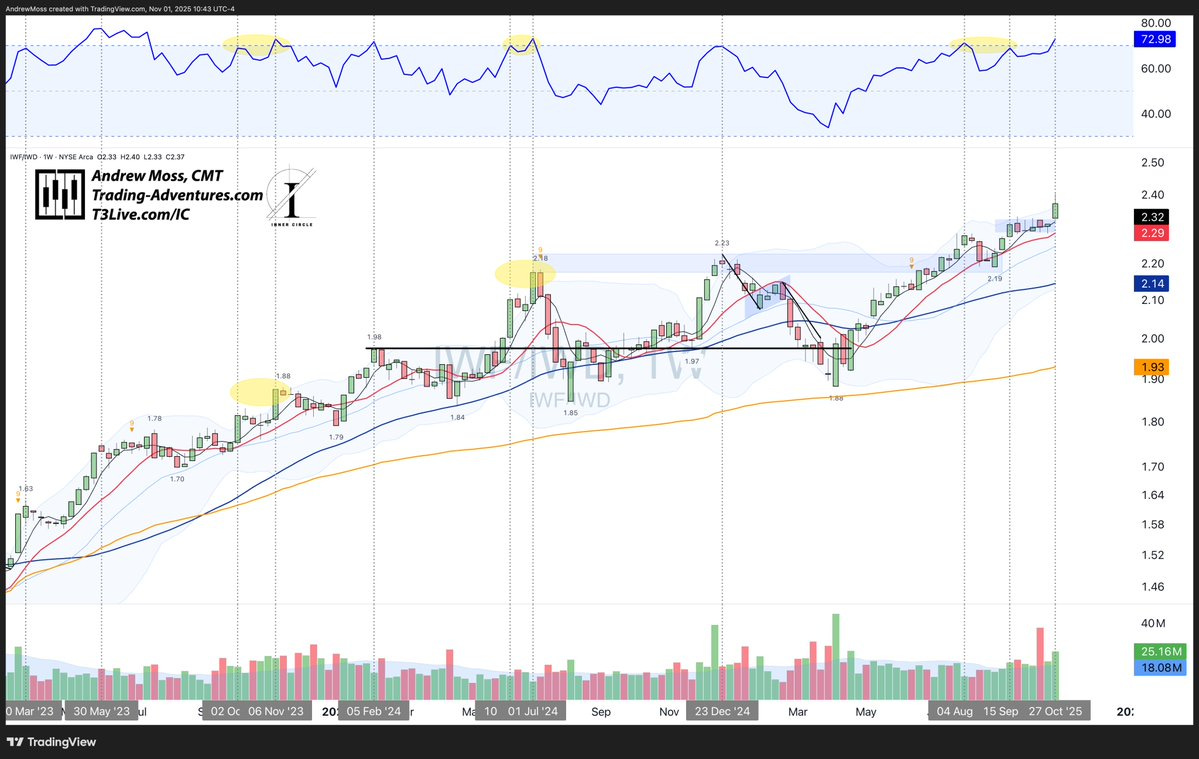
IWF / IWD Growth / Value with a stellar breakout after many weeks of tight consolidation.
This comparison is getting very comfortable with an overbought RSI. Three instances in rapid succession with minimal pullback so far.
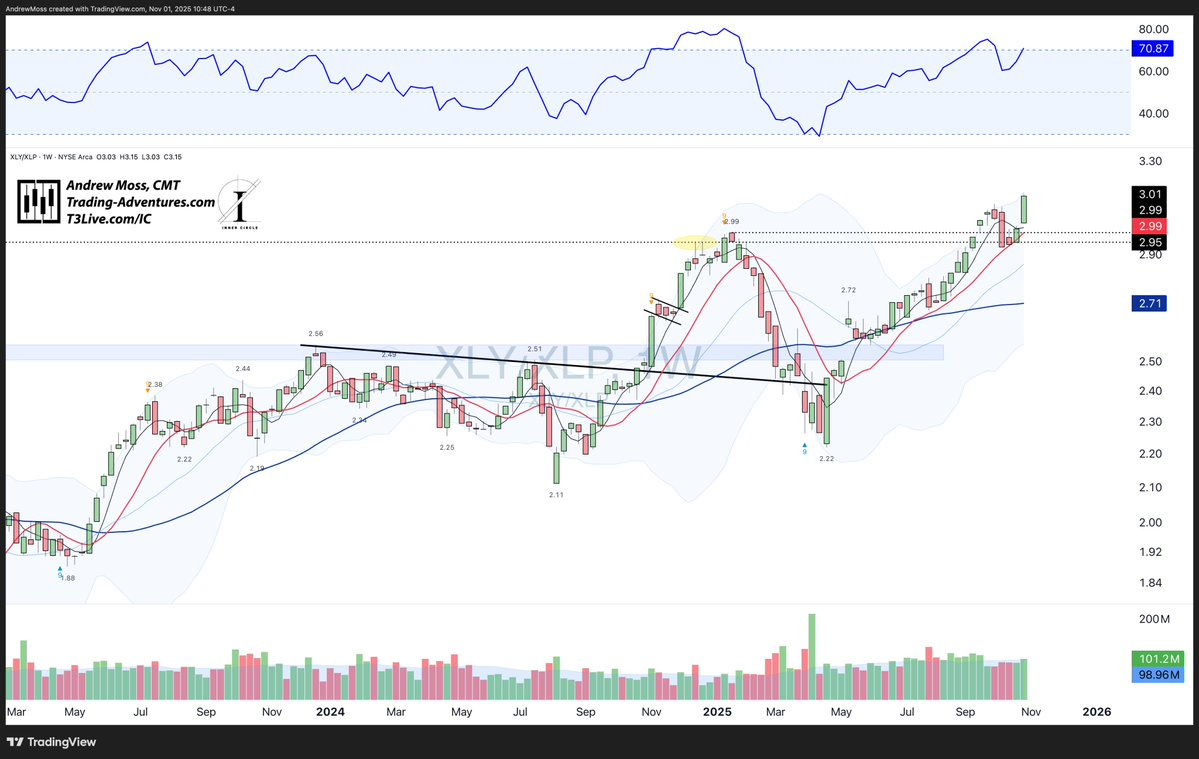
XLY / XLP Consumer Discretionary vs. Staples also with an impressive breakout, taking it back to new highs.
“Risk-On” came back with vengeance this week.📈
Relative Strength — What Is It? (Really) in the new Chart School section.
⚖️ Breadth
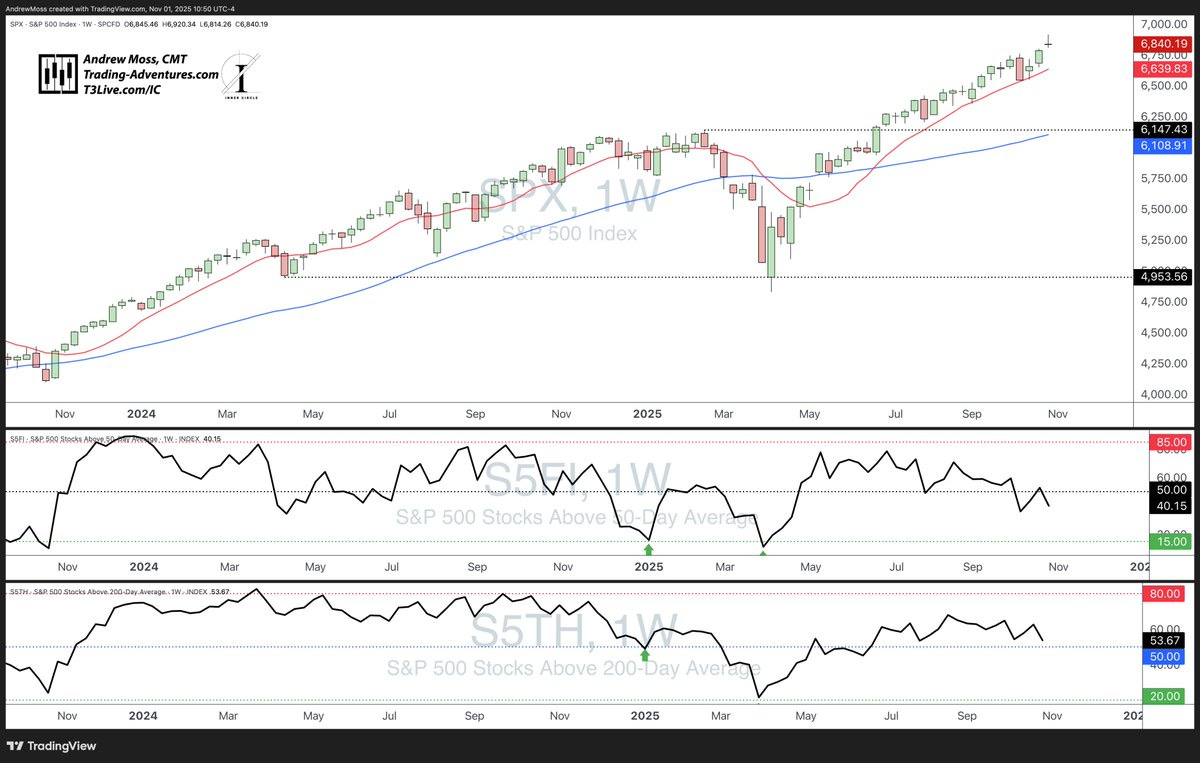
The % of SPX stocks above a 50 and 200-day MA continues to trend lower. Not in a favorable status, though that can shift quickly in strong markets.
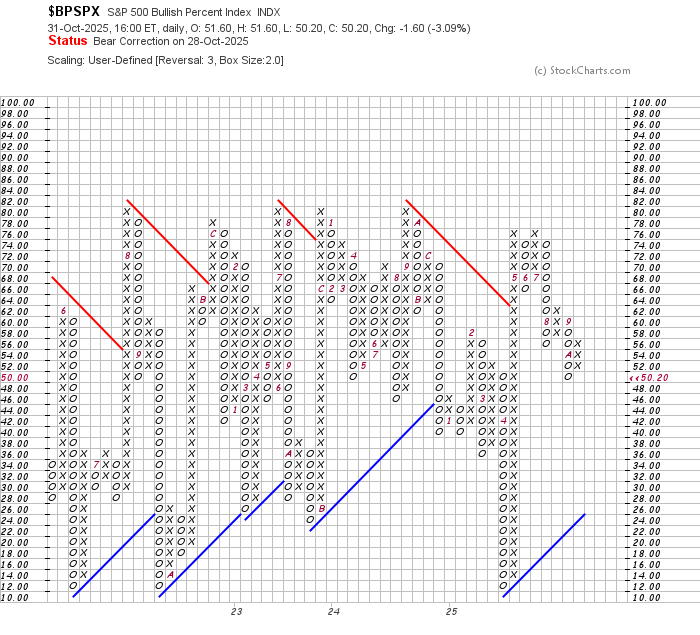
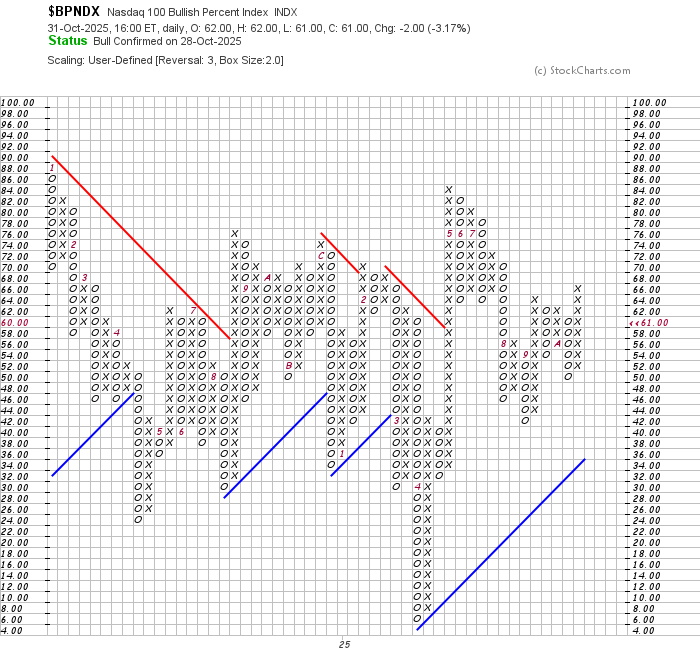
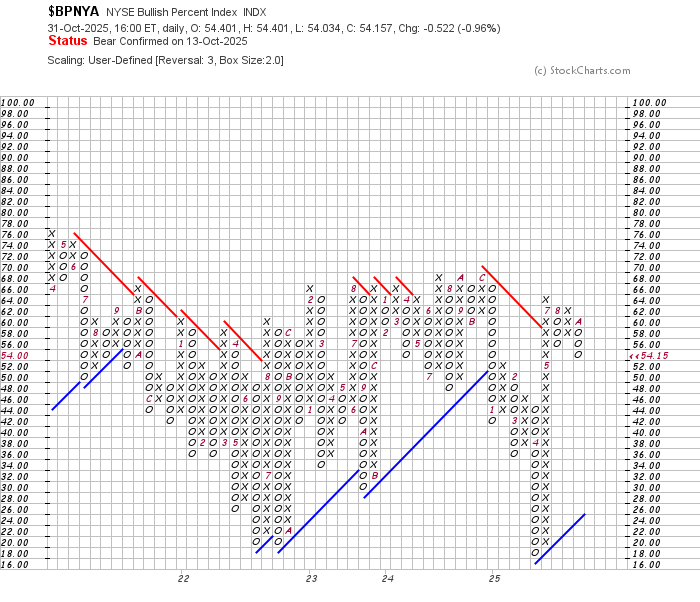
Bullish Percent indices are still a mixed bag.
$BPNDX is in Bull Confirmed status. However, it is at risk of reversing into a column of Os.
$BPSPX is in Bear Correction and nearly breaking lower
$BPNYA is Bear Confirmed
Bullish Percent Indices:
Read this for a refresher:
🧭 Now What?
The charts above paint a picture of a market at a pivotal moment.
Short-term, we’re seeing breakouts and momentum in relative strength ratios (IWF/IWD, XLY/XLP), suggesting a continued “risk-on” appetite.
However, internal breadth indicators are lagging, with fewer stocks above key moving averages — a caution flag that not everything is participating.
Medium-term, major assets like Bitcoin and Ethereum are coiling tightly, potentially setting the stage for explosive moves. Base metals and growth/value spreads are confirming strength, while gold may be flashing a possible top.
Long-term, the macro picture remains constructive but increasingly nuanced. We’re seeing some sectors and ratios stretch to overbought levels while others lag or consolidate, hinting at a potential rotation rather than broad-based decline — at least for now.
The takeaway? Momentum is alive — but increasingly selective. Choose wisely, manage risk, and stay nimble.
🗓 The Week Ahead
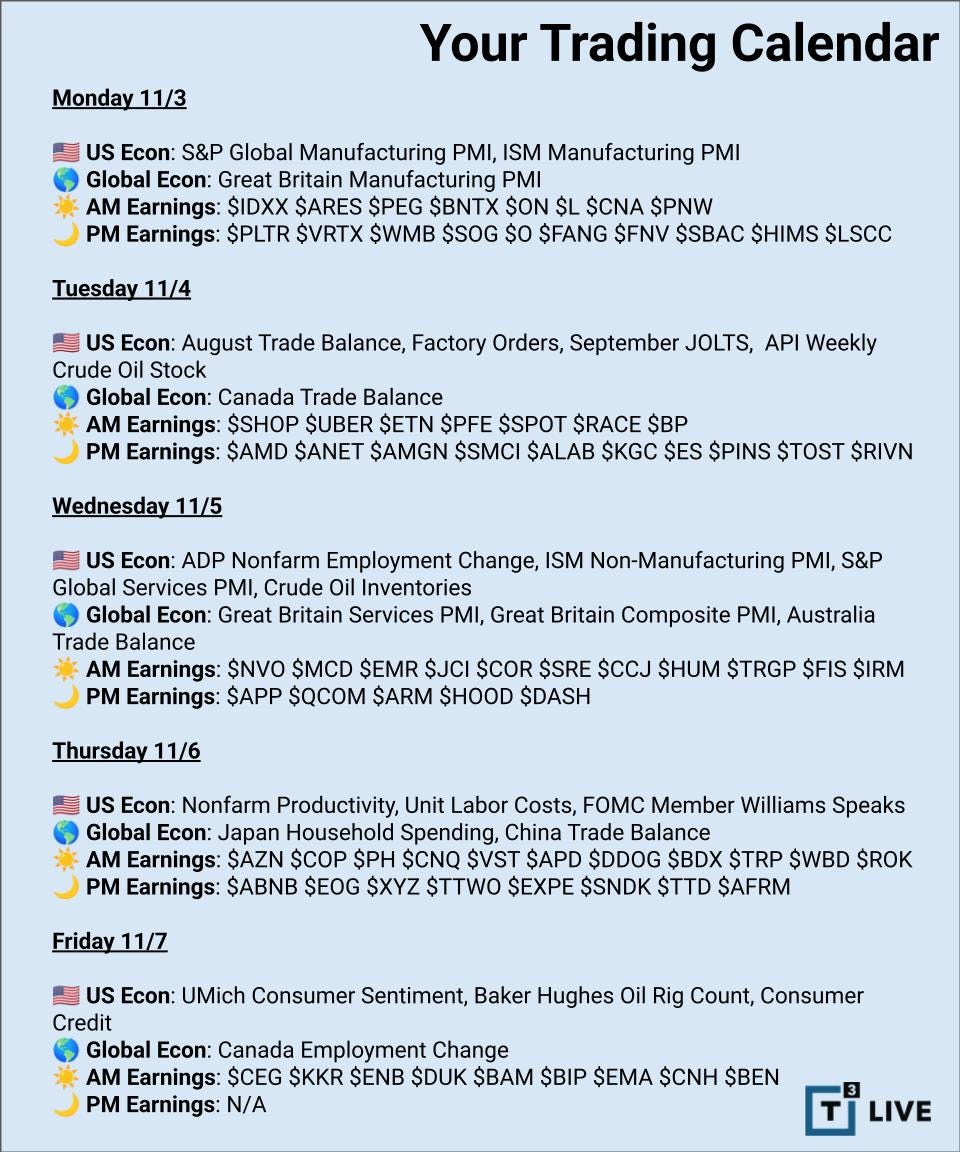
Plenty of catalysts on deck. A heavy mix of econ data plus a fresh wave of earnings could challenge this market’s recent momentum.
AMD HOOD PLTR QCOM SMCI SPOT
JOLTs and ADP
FOMC comments
🧠 Final Thought
Yes, leadership is narrowing — and that’s worth watching. But let’s not lose sight of the broader picture: this market remains undeniably strong.
We’ve heard concerns before about narrow rallies — remember when it was “just” the Magnificent Seven? Yet the trend has continued to power higher.
Now we’re stepping into the strongest seasonal stretch of the year, historically. And six months of strength often leads to six more. The data backs it up.
So manage your risk. Pullbacks will come. Stay flexible. But above all, stay focused on the primary trend.
🙌 Thanks for Reading
Thank you all for reading and spending some time with me on a Saturday morning!
For a deeper dive, check out the new Chart School section — lessons on breadth, relative strength, AVWAP, and more.
If you found this week’s charts helpful, please -
📤 Share
💬 Comment
♻️ and Repost
It helps more traders see the work and join the discussion.
Also, consider supporting with a paid subscription to keep them coming.
All posts remain public — no locked content. Just charts, signals, and steady updates to help you trade with confidence.
—Andy
Looking For More?
Elevate Your Trading Adventure Even Further With These Offerings.
The Disclosures
***This is NOT financial advice. This is NOT a recommendation to buy, sell, or trade any security. The content presented here is intended for educational purposes only.





Thanks! On ACWX, back in 2008, the high at the time was about $42.5 and right now about $66.35 but in your article you mentioned that it’s only now hitting highs last seen in 2008? Can you please clarify?