📈Weekly Charts📉 October 11, 2025
Volatility rises, structure holds, and the charts remind us what matters most.

After yesterday’s sharp selloff, it’s a good time to zoom out, check the weekly structure, and see where things really stand. Momentum cooled, volatility rose — but the bigger picture still matters.
Let’s dig into the 📈Weekly Charts📉 for some perspective.
Reminder: click on the first chart to open a bigger view. Then use your arrows keys to scroll through all the images.😉
📊 U.S. Indexes
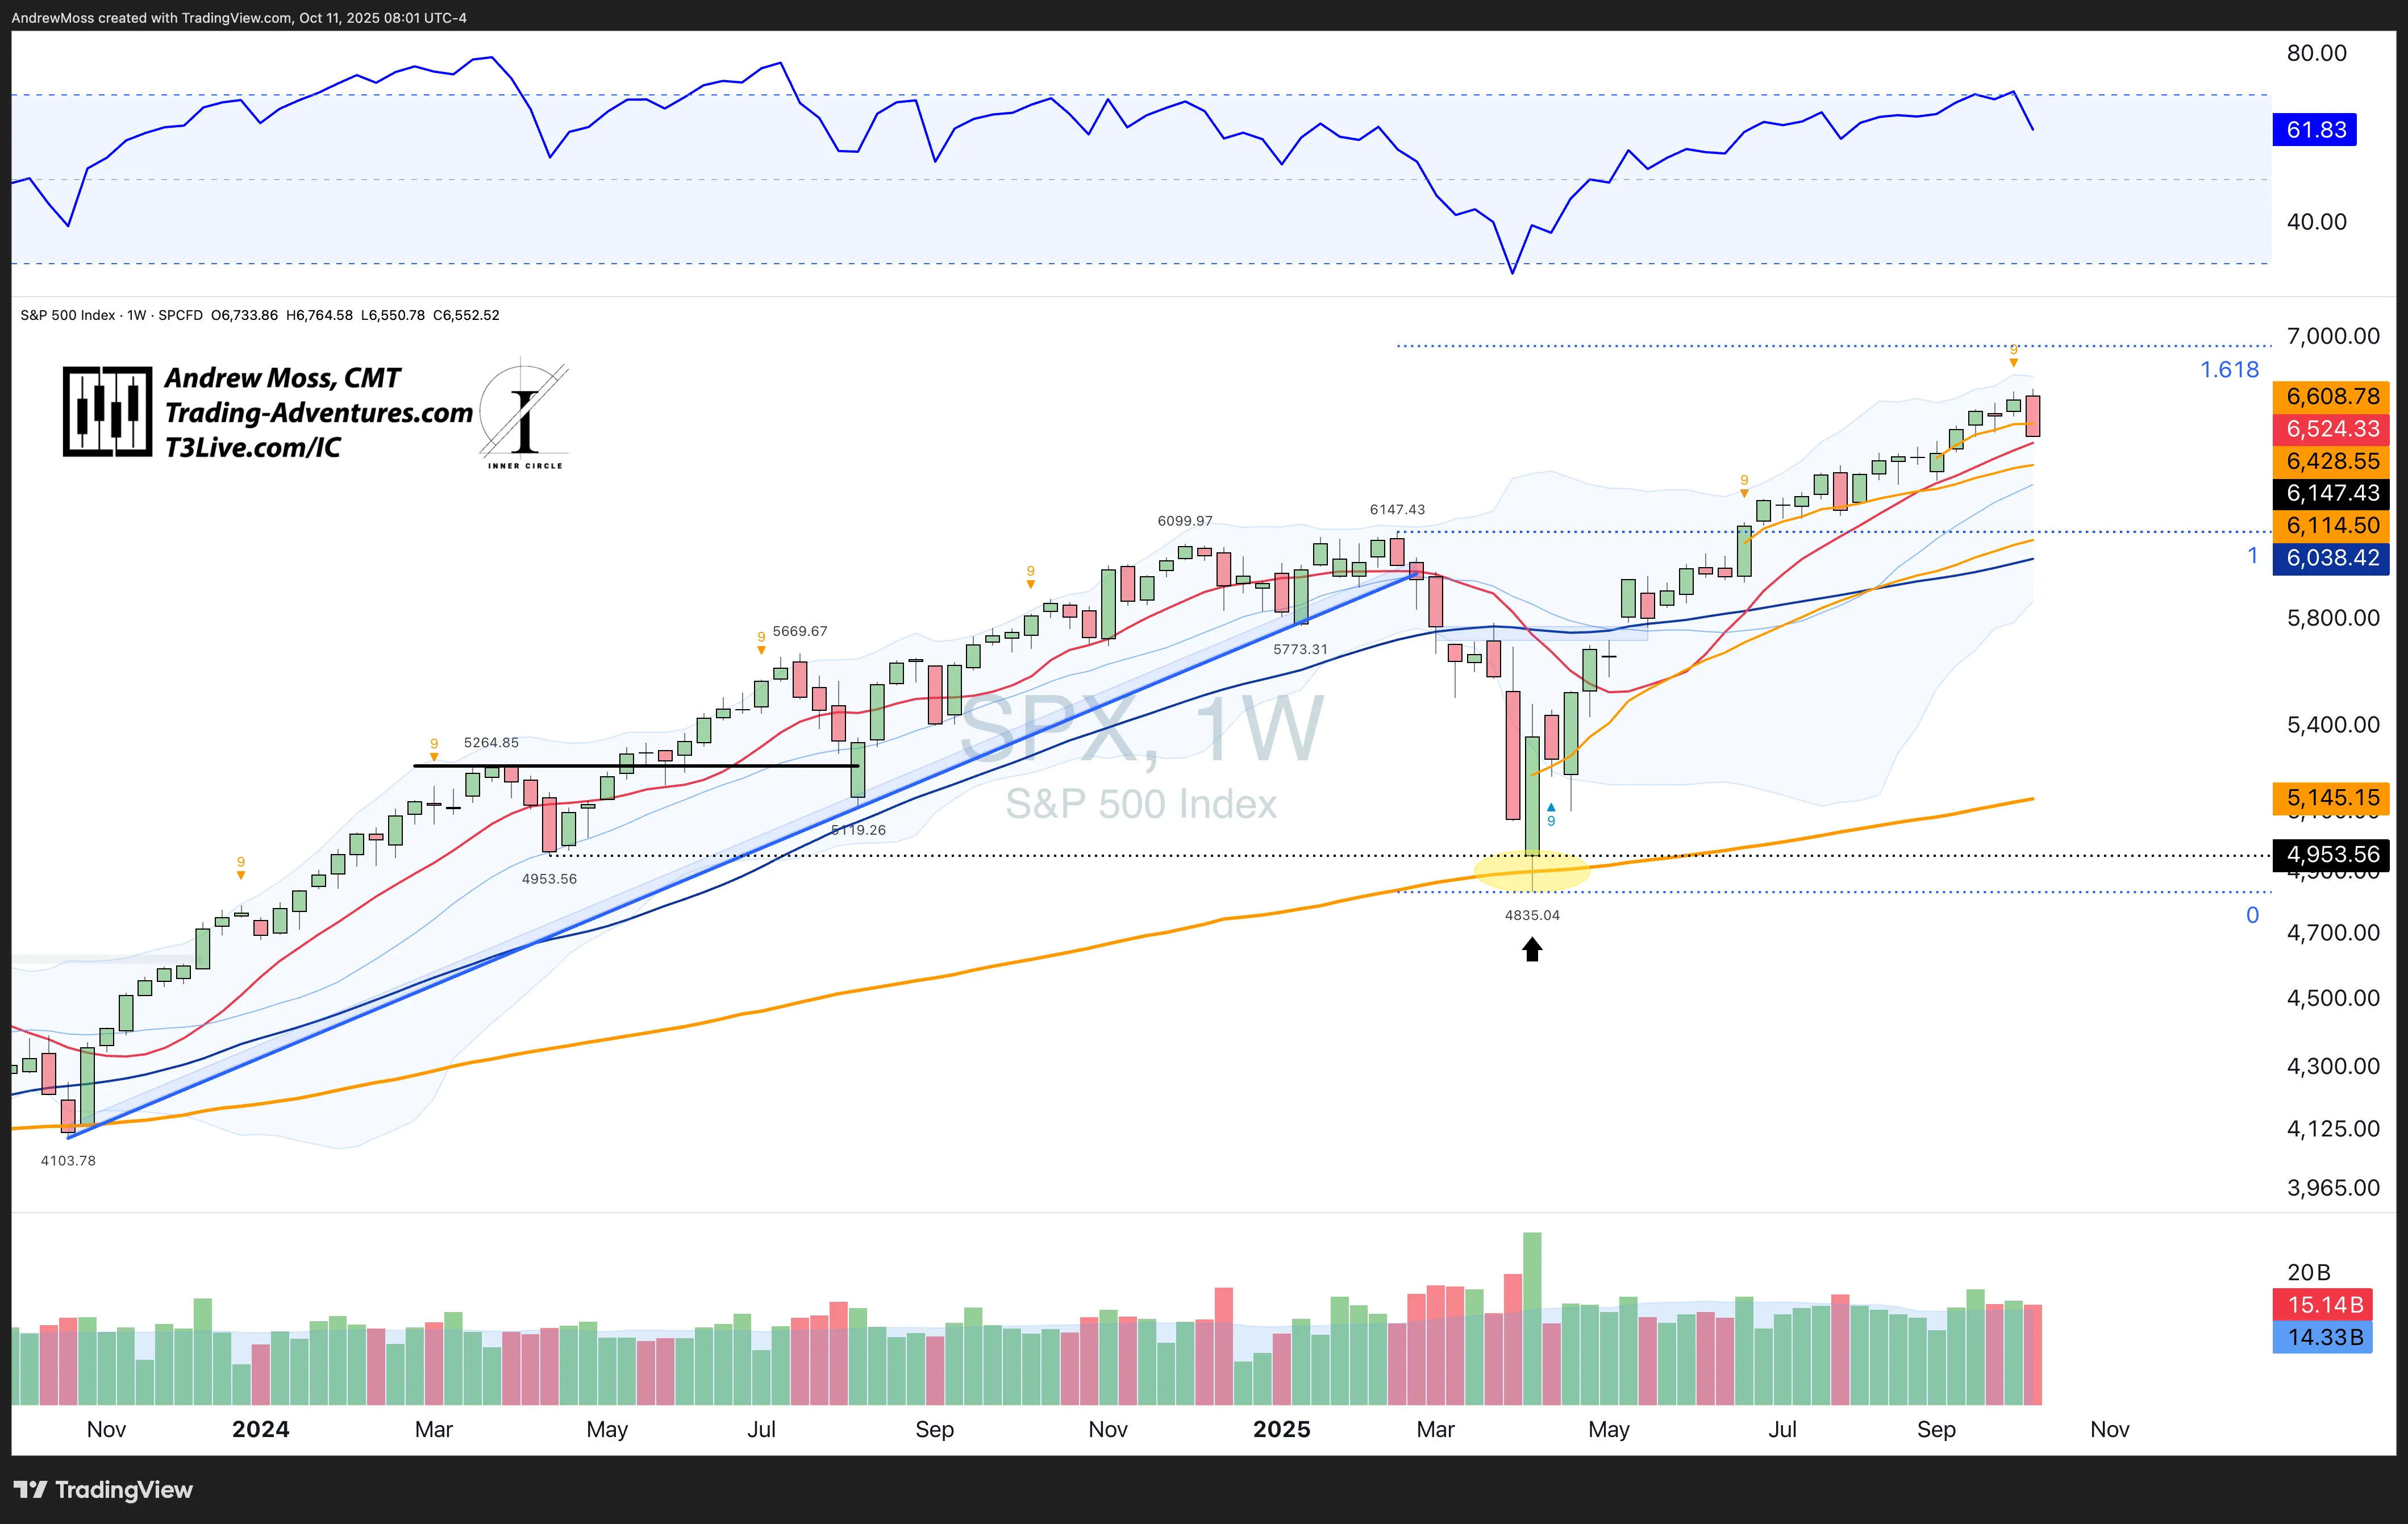
S&P 500 (SPX): A big outside reversal candle taking it from new highs to down nearly to the 10‑week MA — a level we haven’t been close to for ~60 days, and haven’t traded below since April.
Yesterday’s volume was nearly double the 20‑day average, but weekly volume is in line. RSI is lower but still firmly in the upper half at ~61, for now.
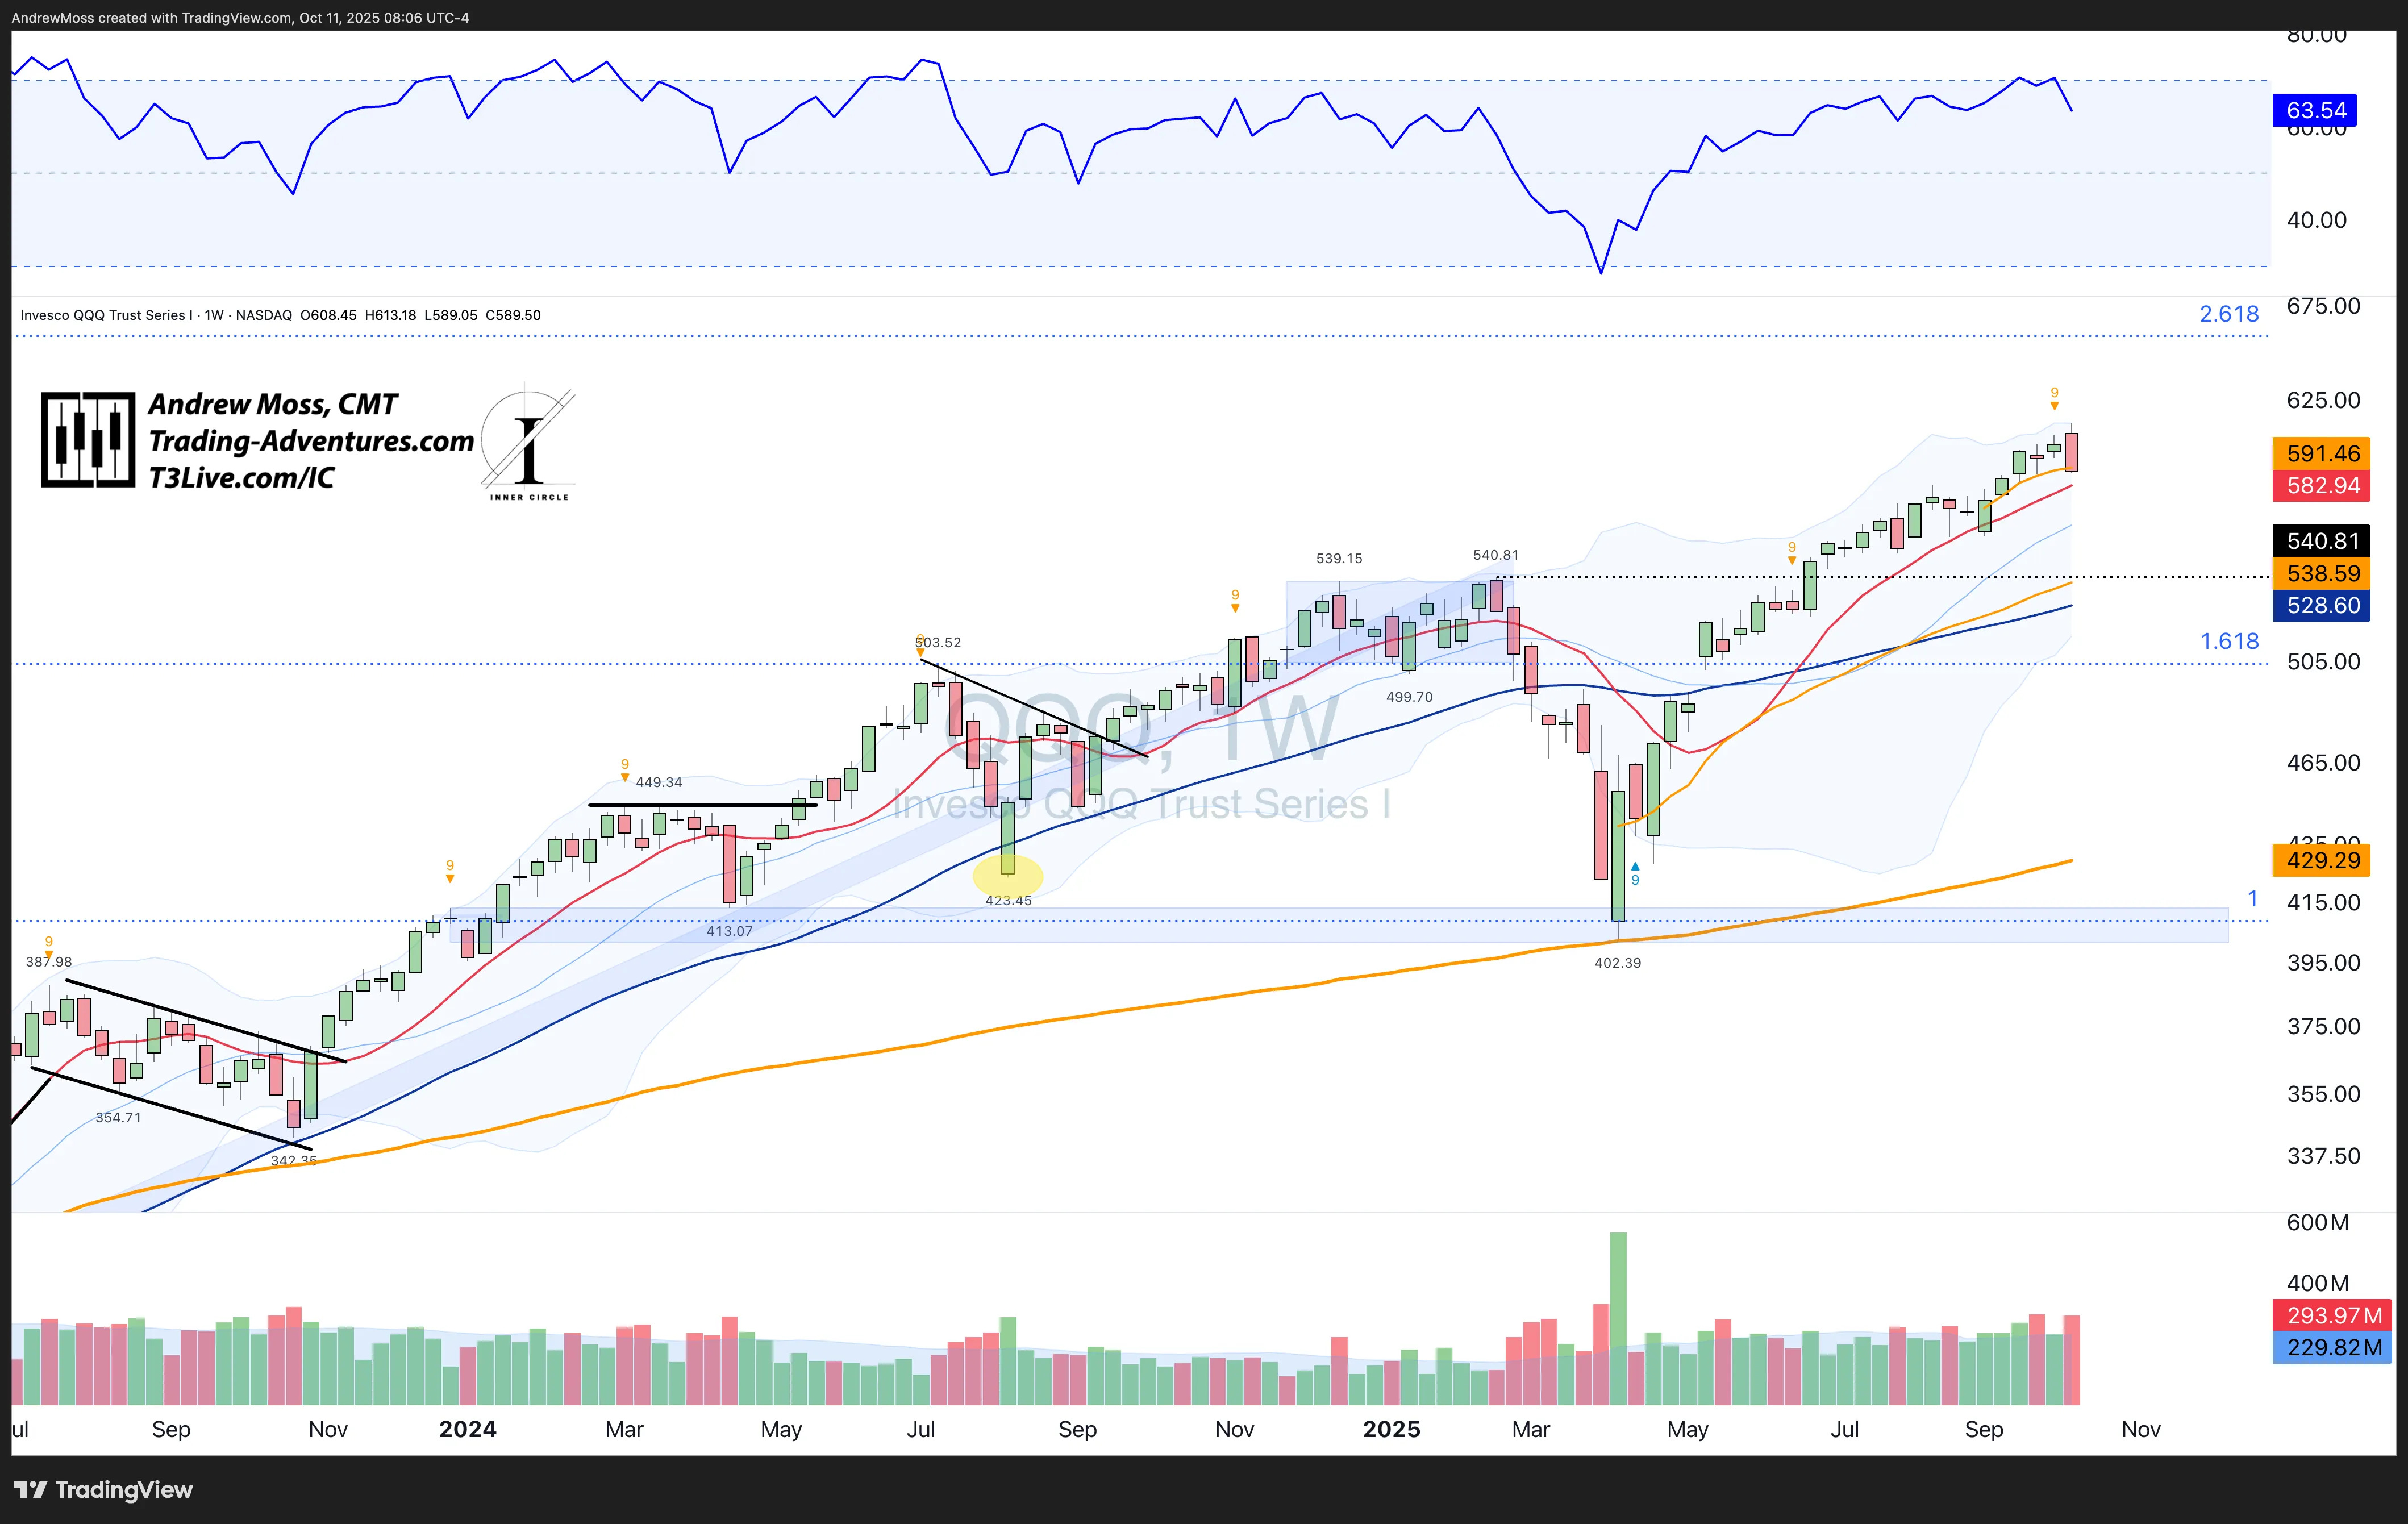
Nasdaq 100 (QQQ): Similar action on heavier volume, closing near the AVWAP🟠 from its earlier test of the 10‑week MA — which price actually hit in after‑hours trading yesterday. RSI finished at 63.5.
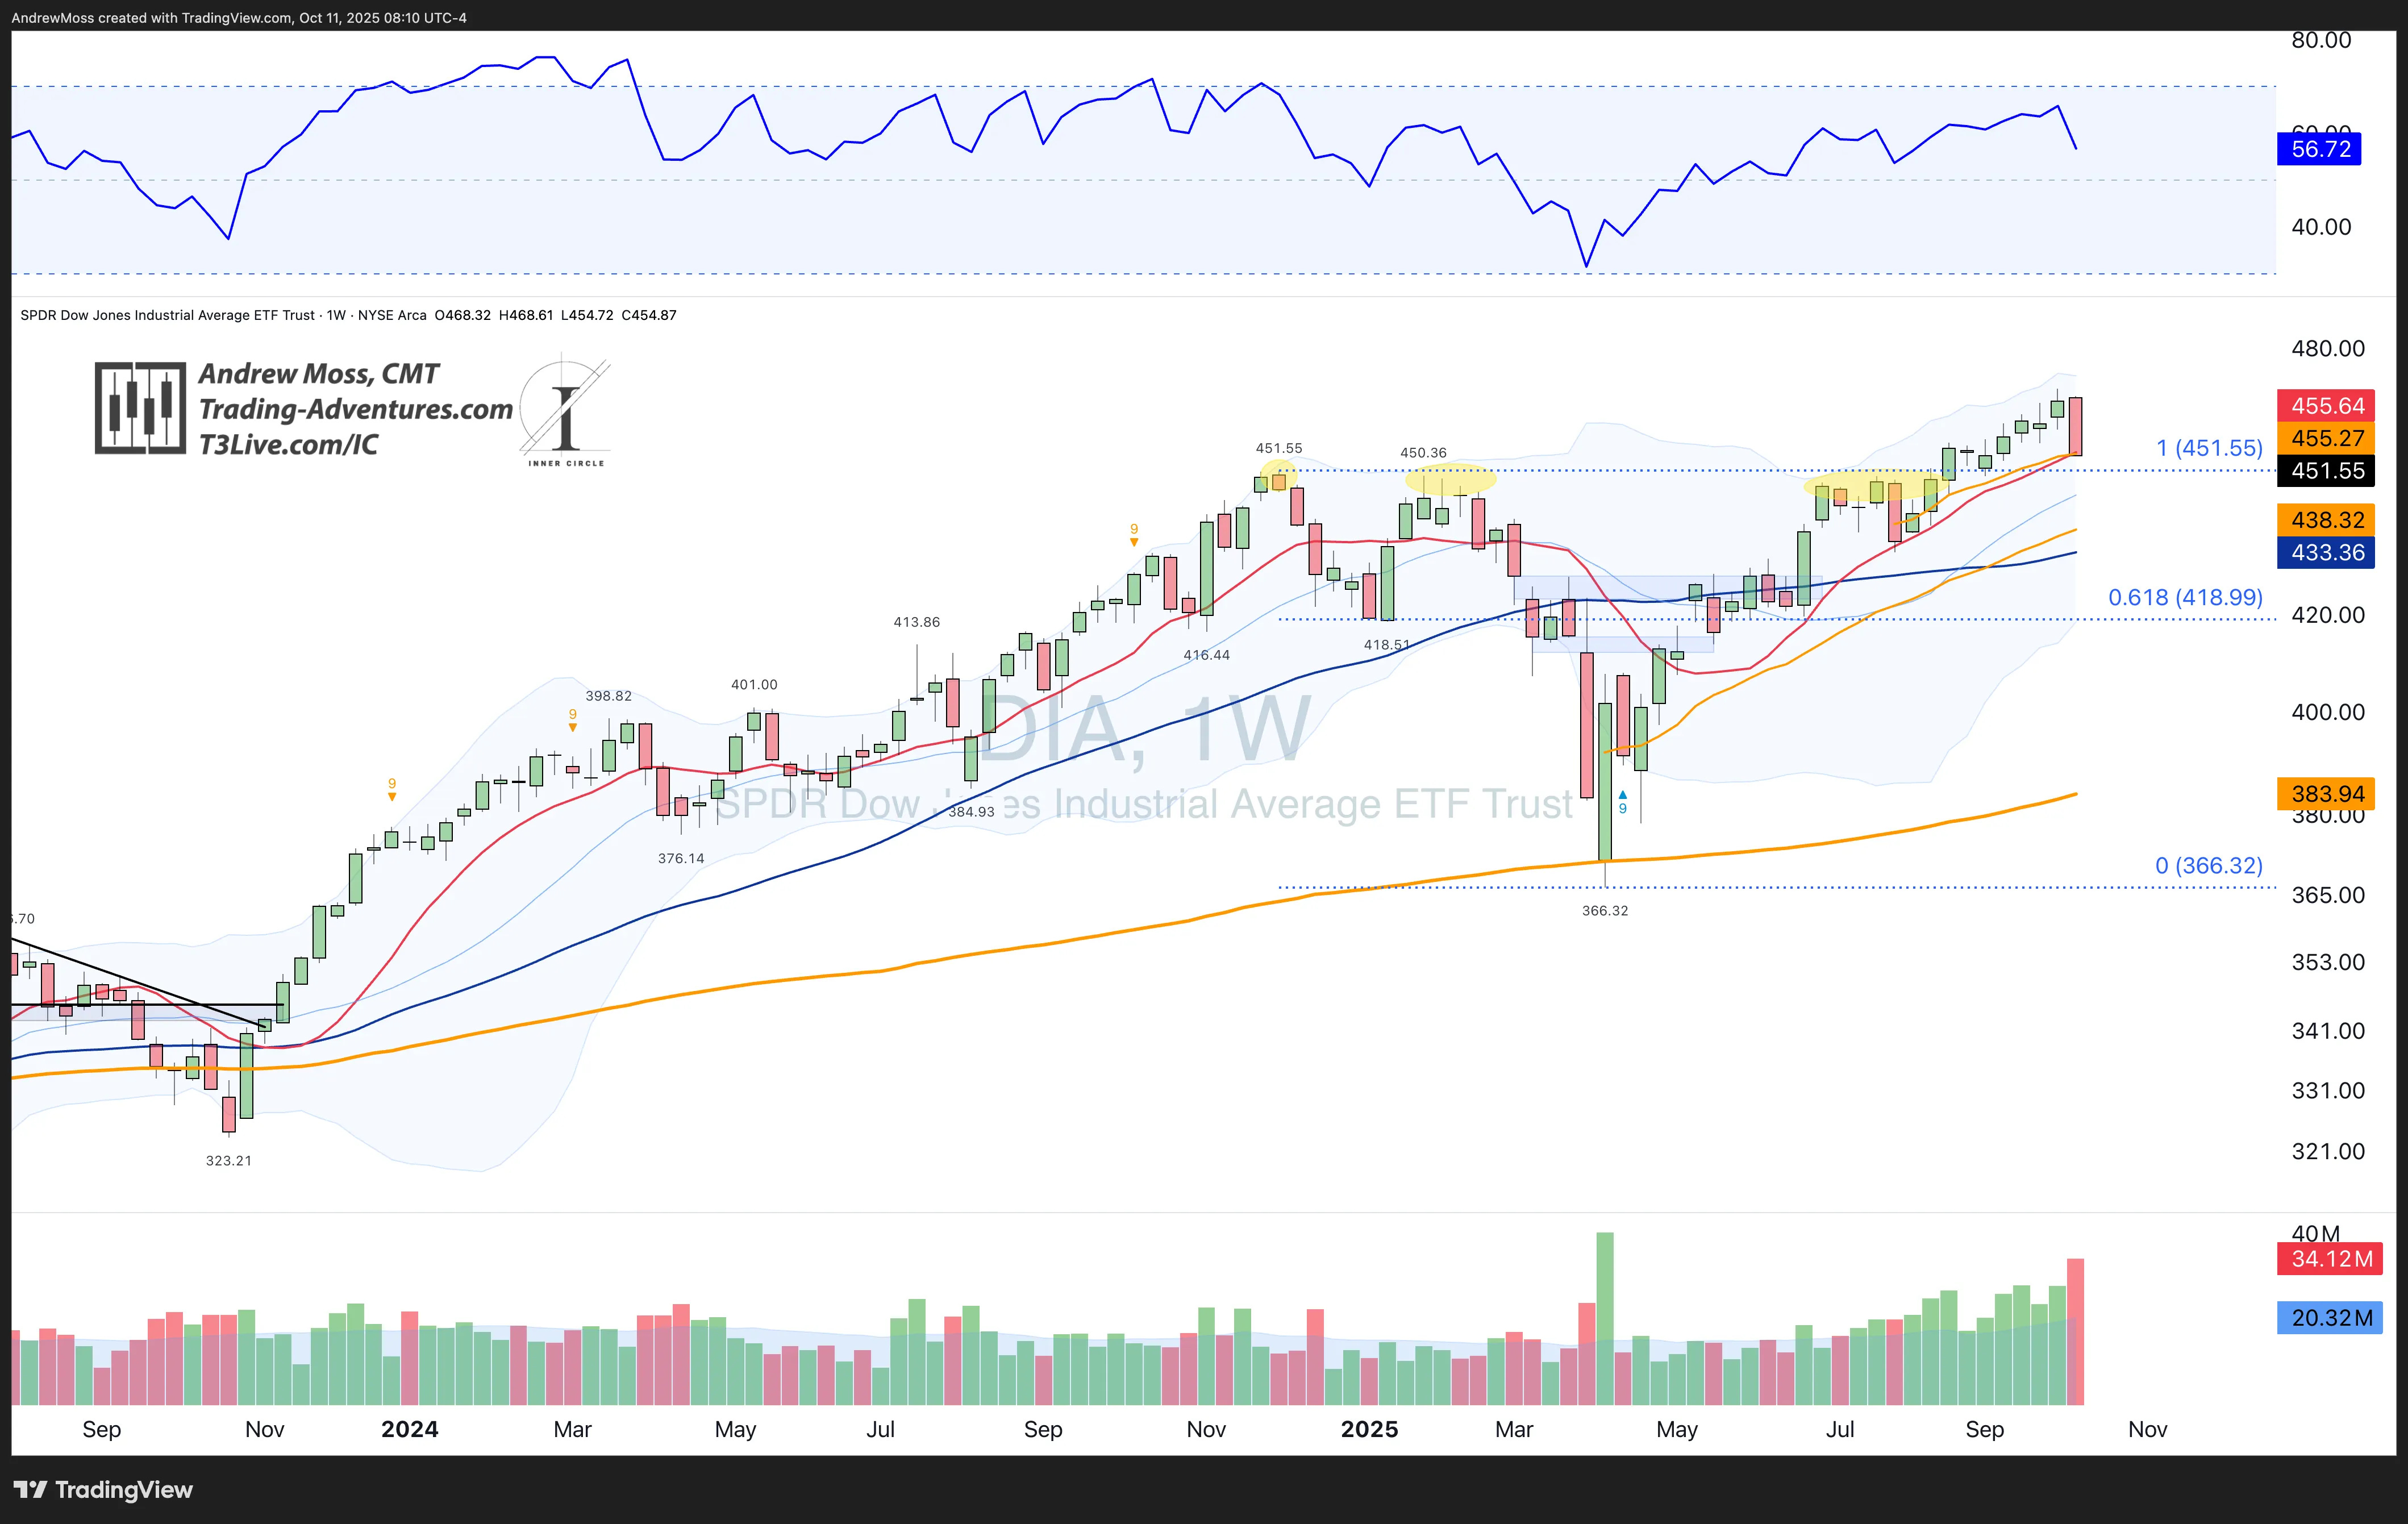
Dow Jones (DIA): Closed on its 10‑week MA and AVWAP🟠 from the previous test. RSI is a bit lower at 56, and volume was very heavy. The ~$451 pivot area is close by and will be an important level to hold.
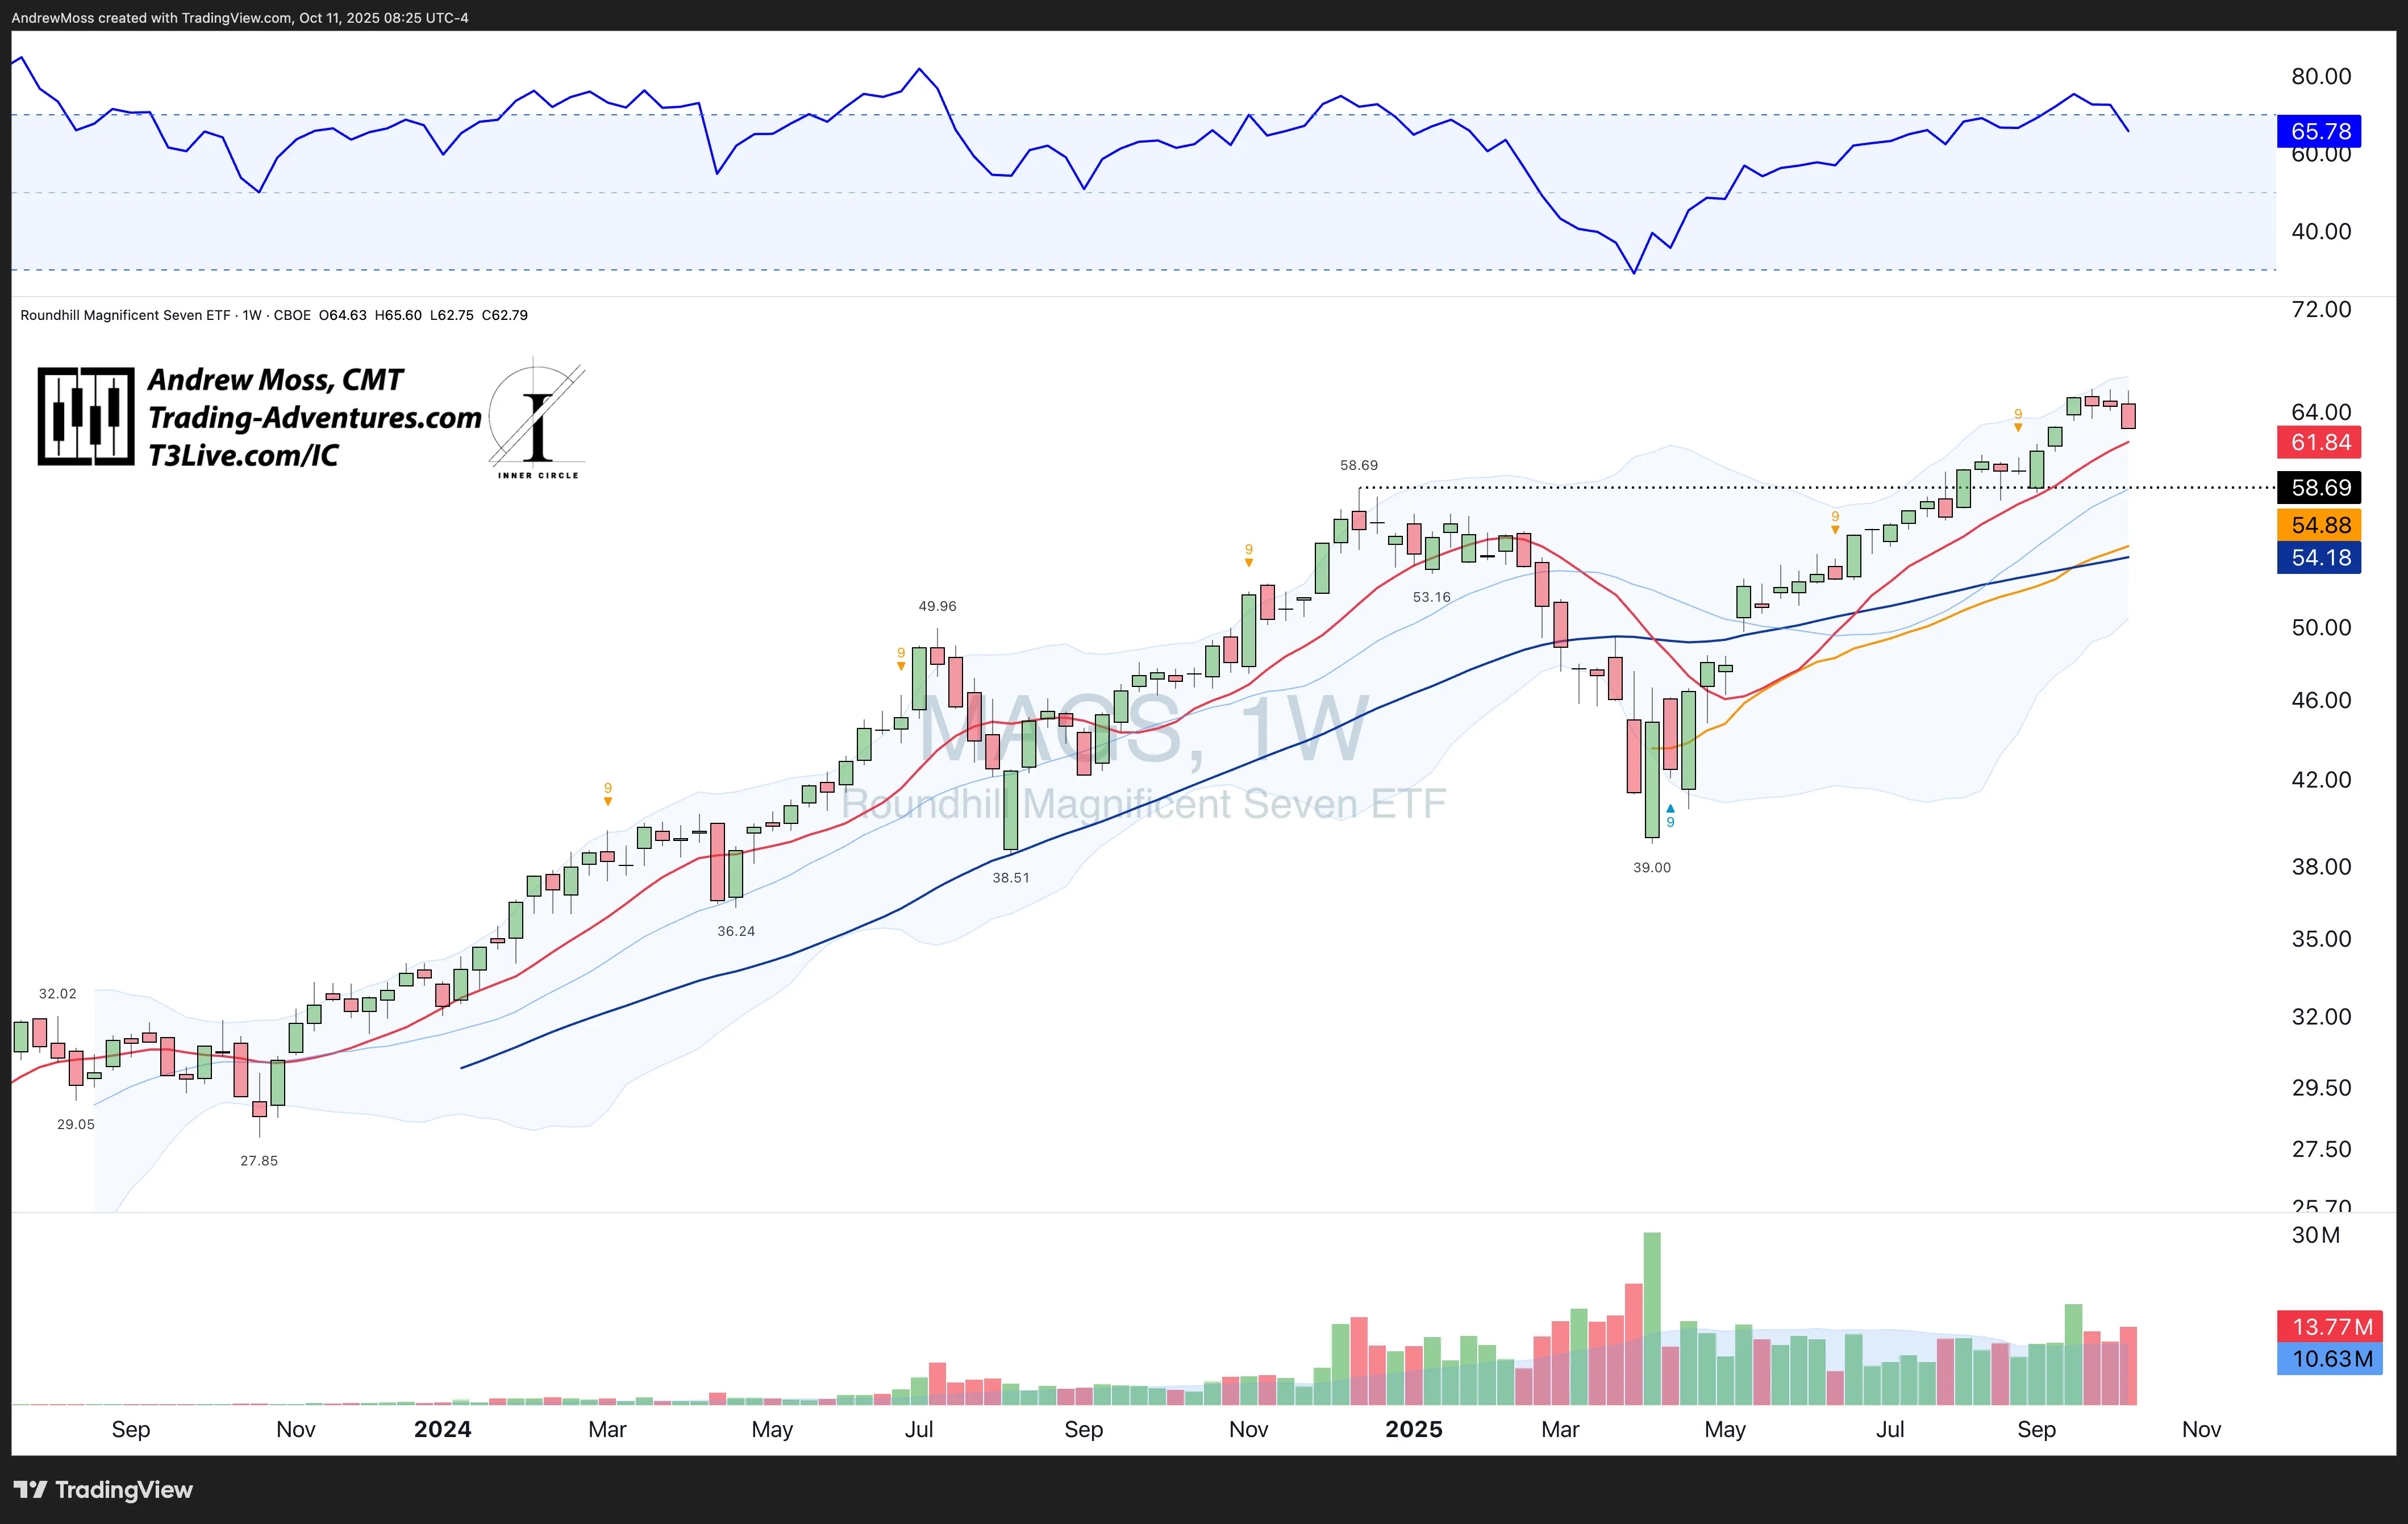
MAGS (Generals) - This chart isn’t usually included, but it’s worth noting (after the fact, admittedly) that the generals peaked three weeks ago after RSI got a little hot.
🌍 Small Caps & International
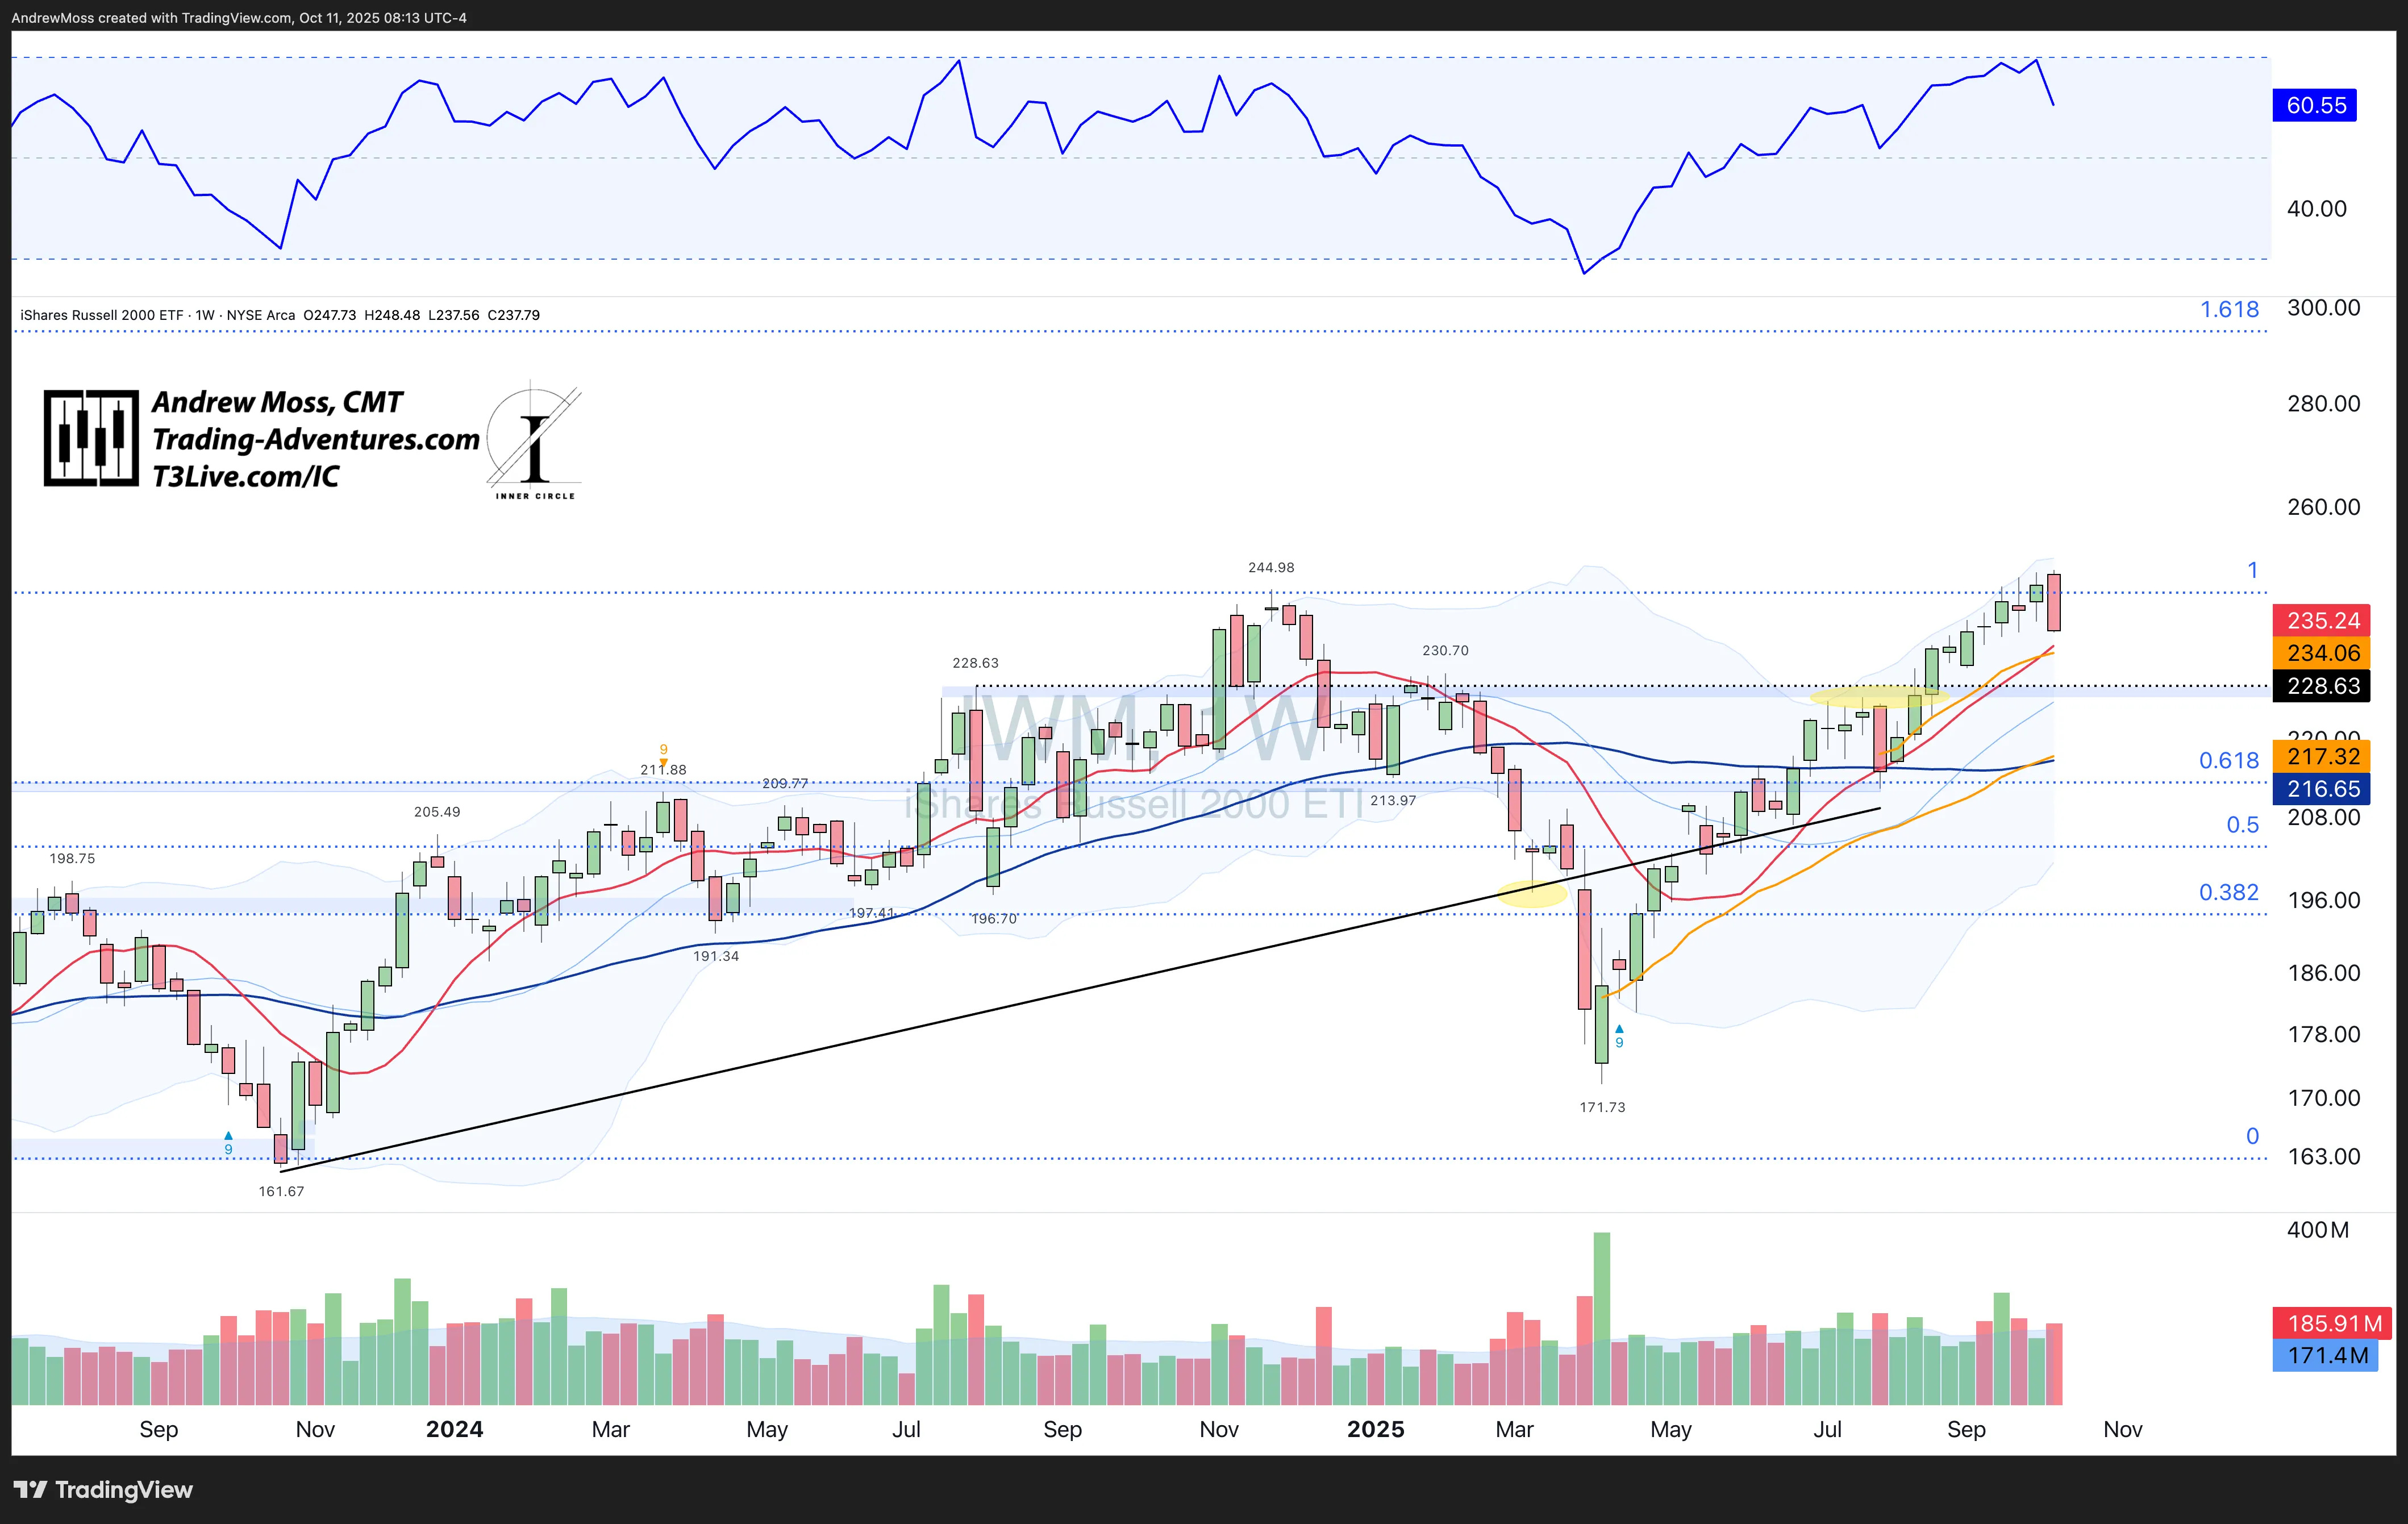
Russell 2000 (IWM): Back below the ~$245 breakout level — not a good sign. But it’s still above the 10‑week MA and AVWAP🟠. That will likely be a critical test level. RSI at 60 and volume was a little heavy, but not a concern.
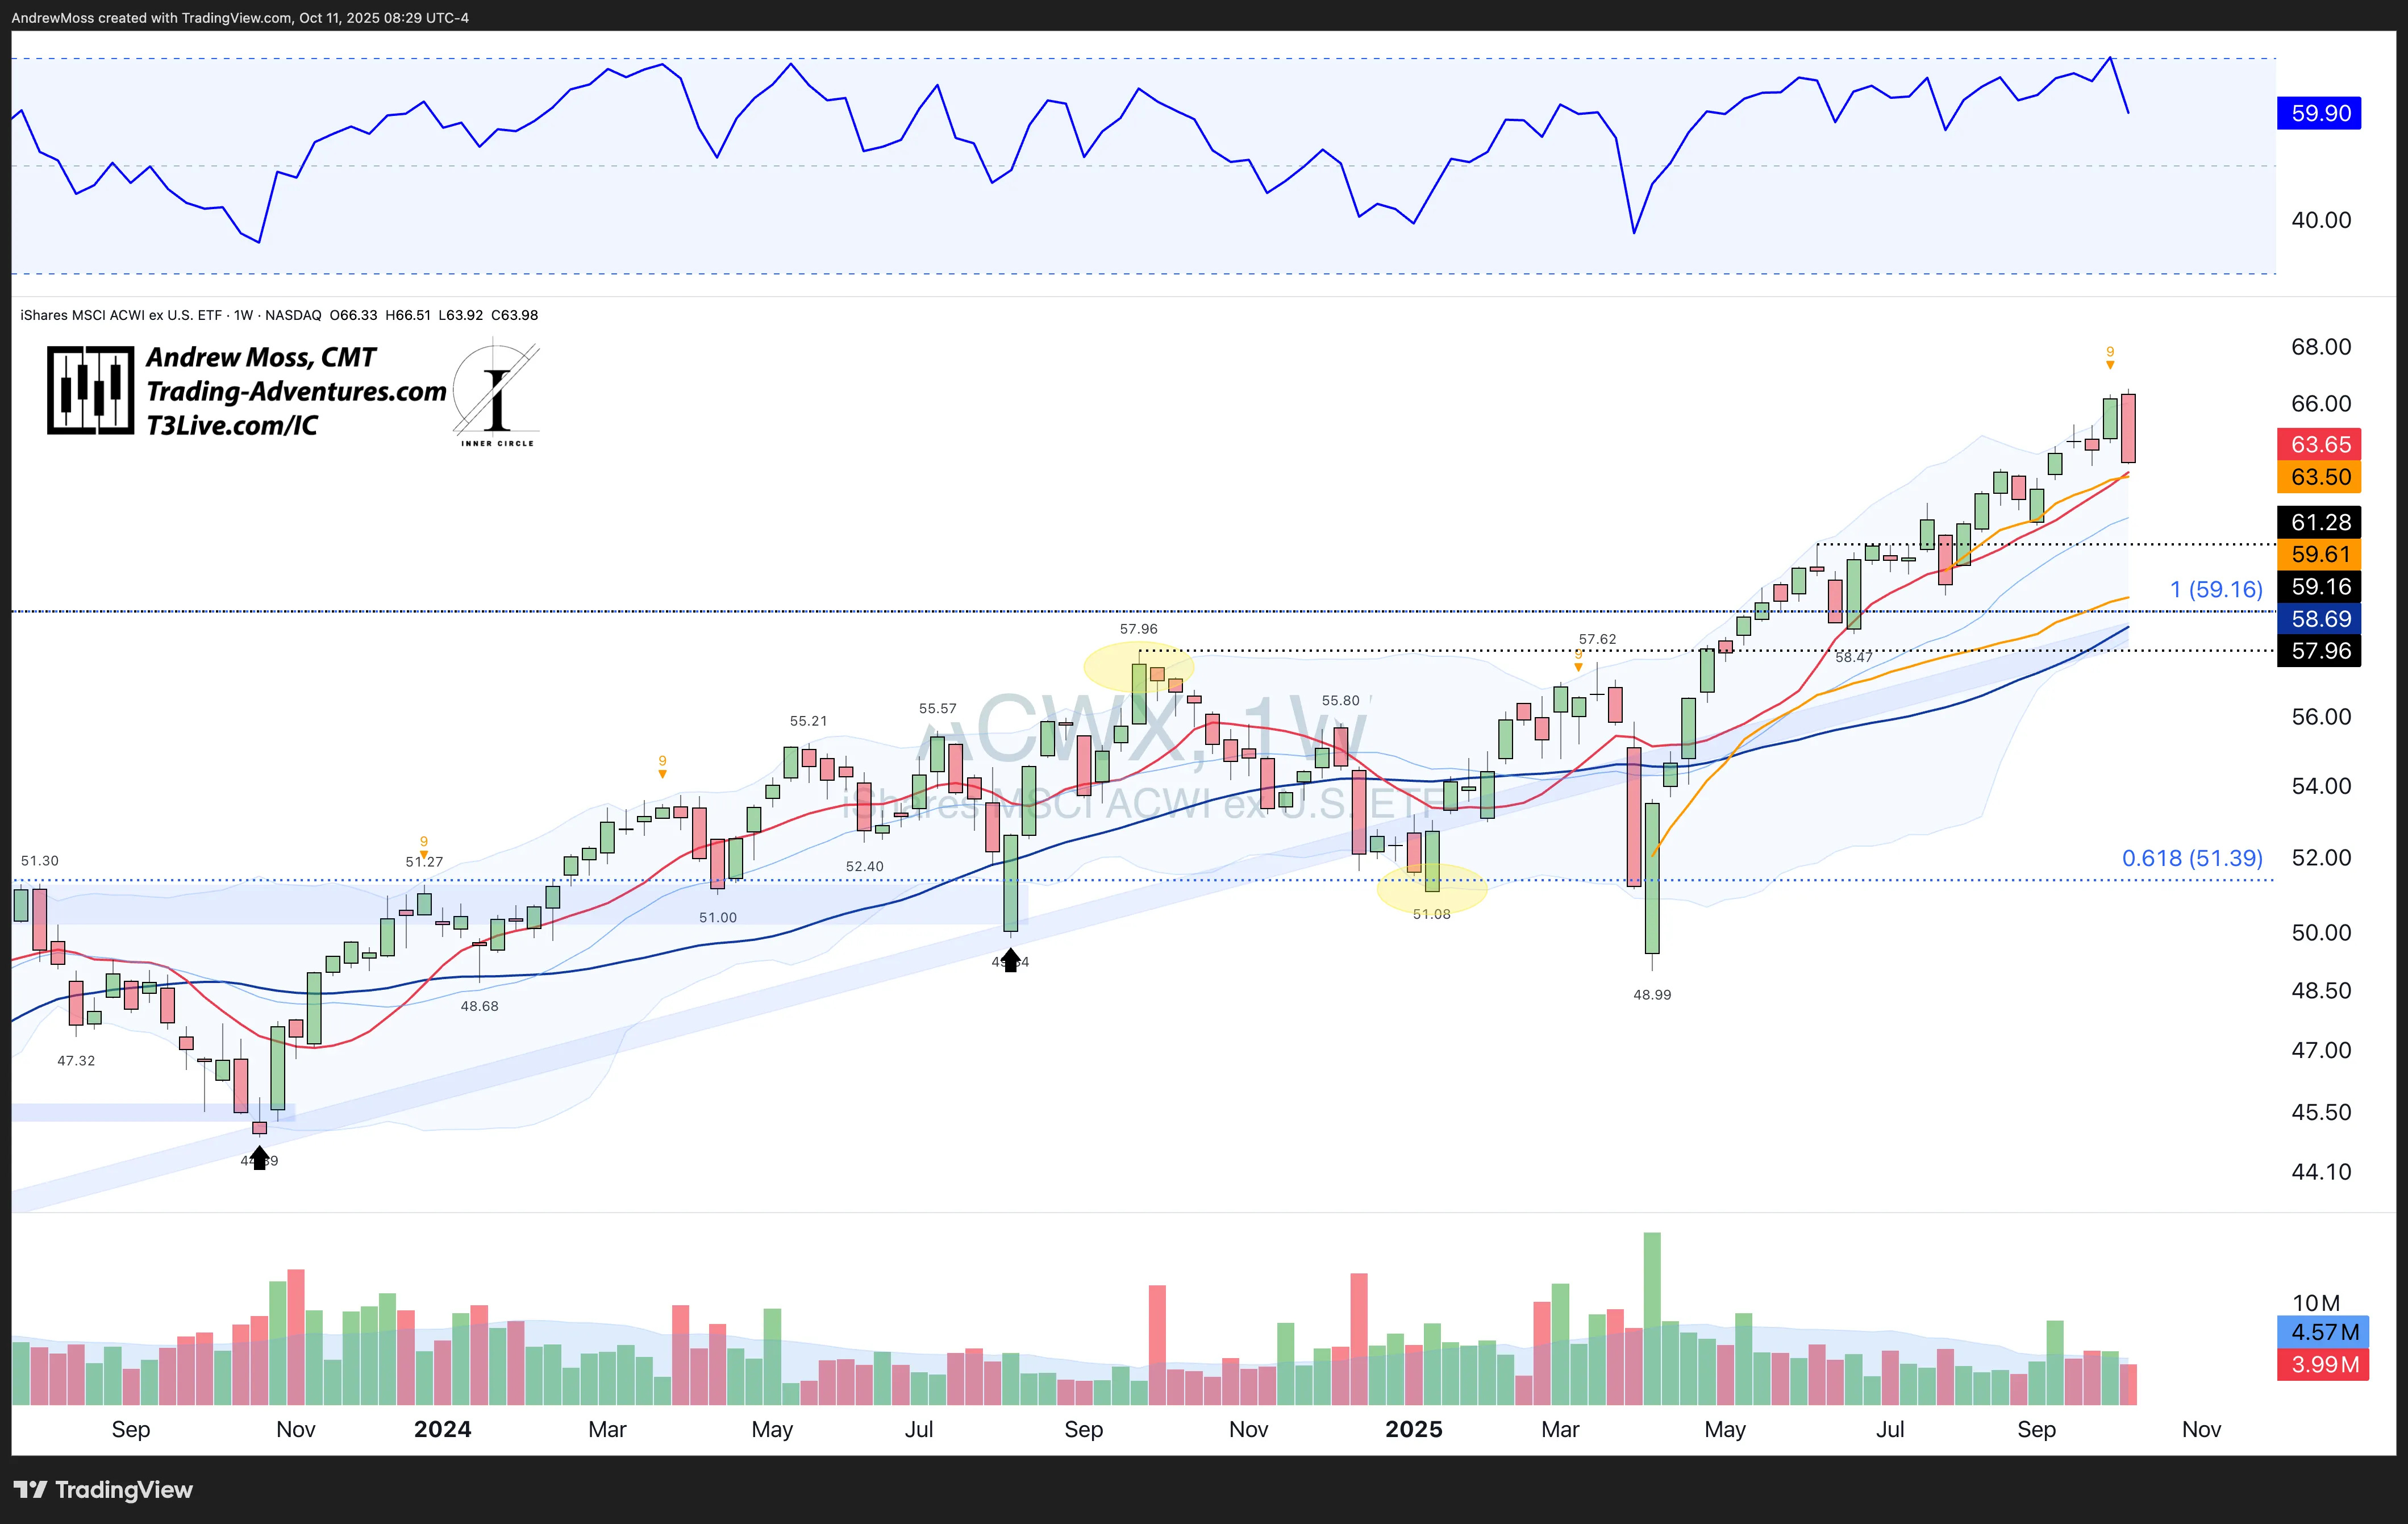
ACWX (ex‑US): After last week’s DeMark 9 sell setup (also present on SPX and QQQ), the Rest Of The World erased a month’s worth of gains in one week. ~$63.50 will be an important test now. That’s the 10‑week MA and an AVWAP🟠.
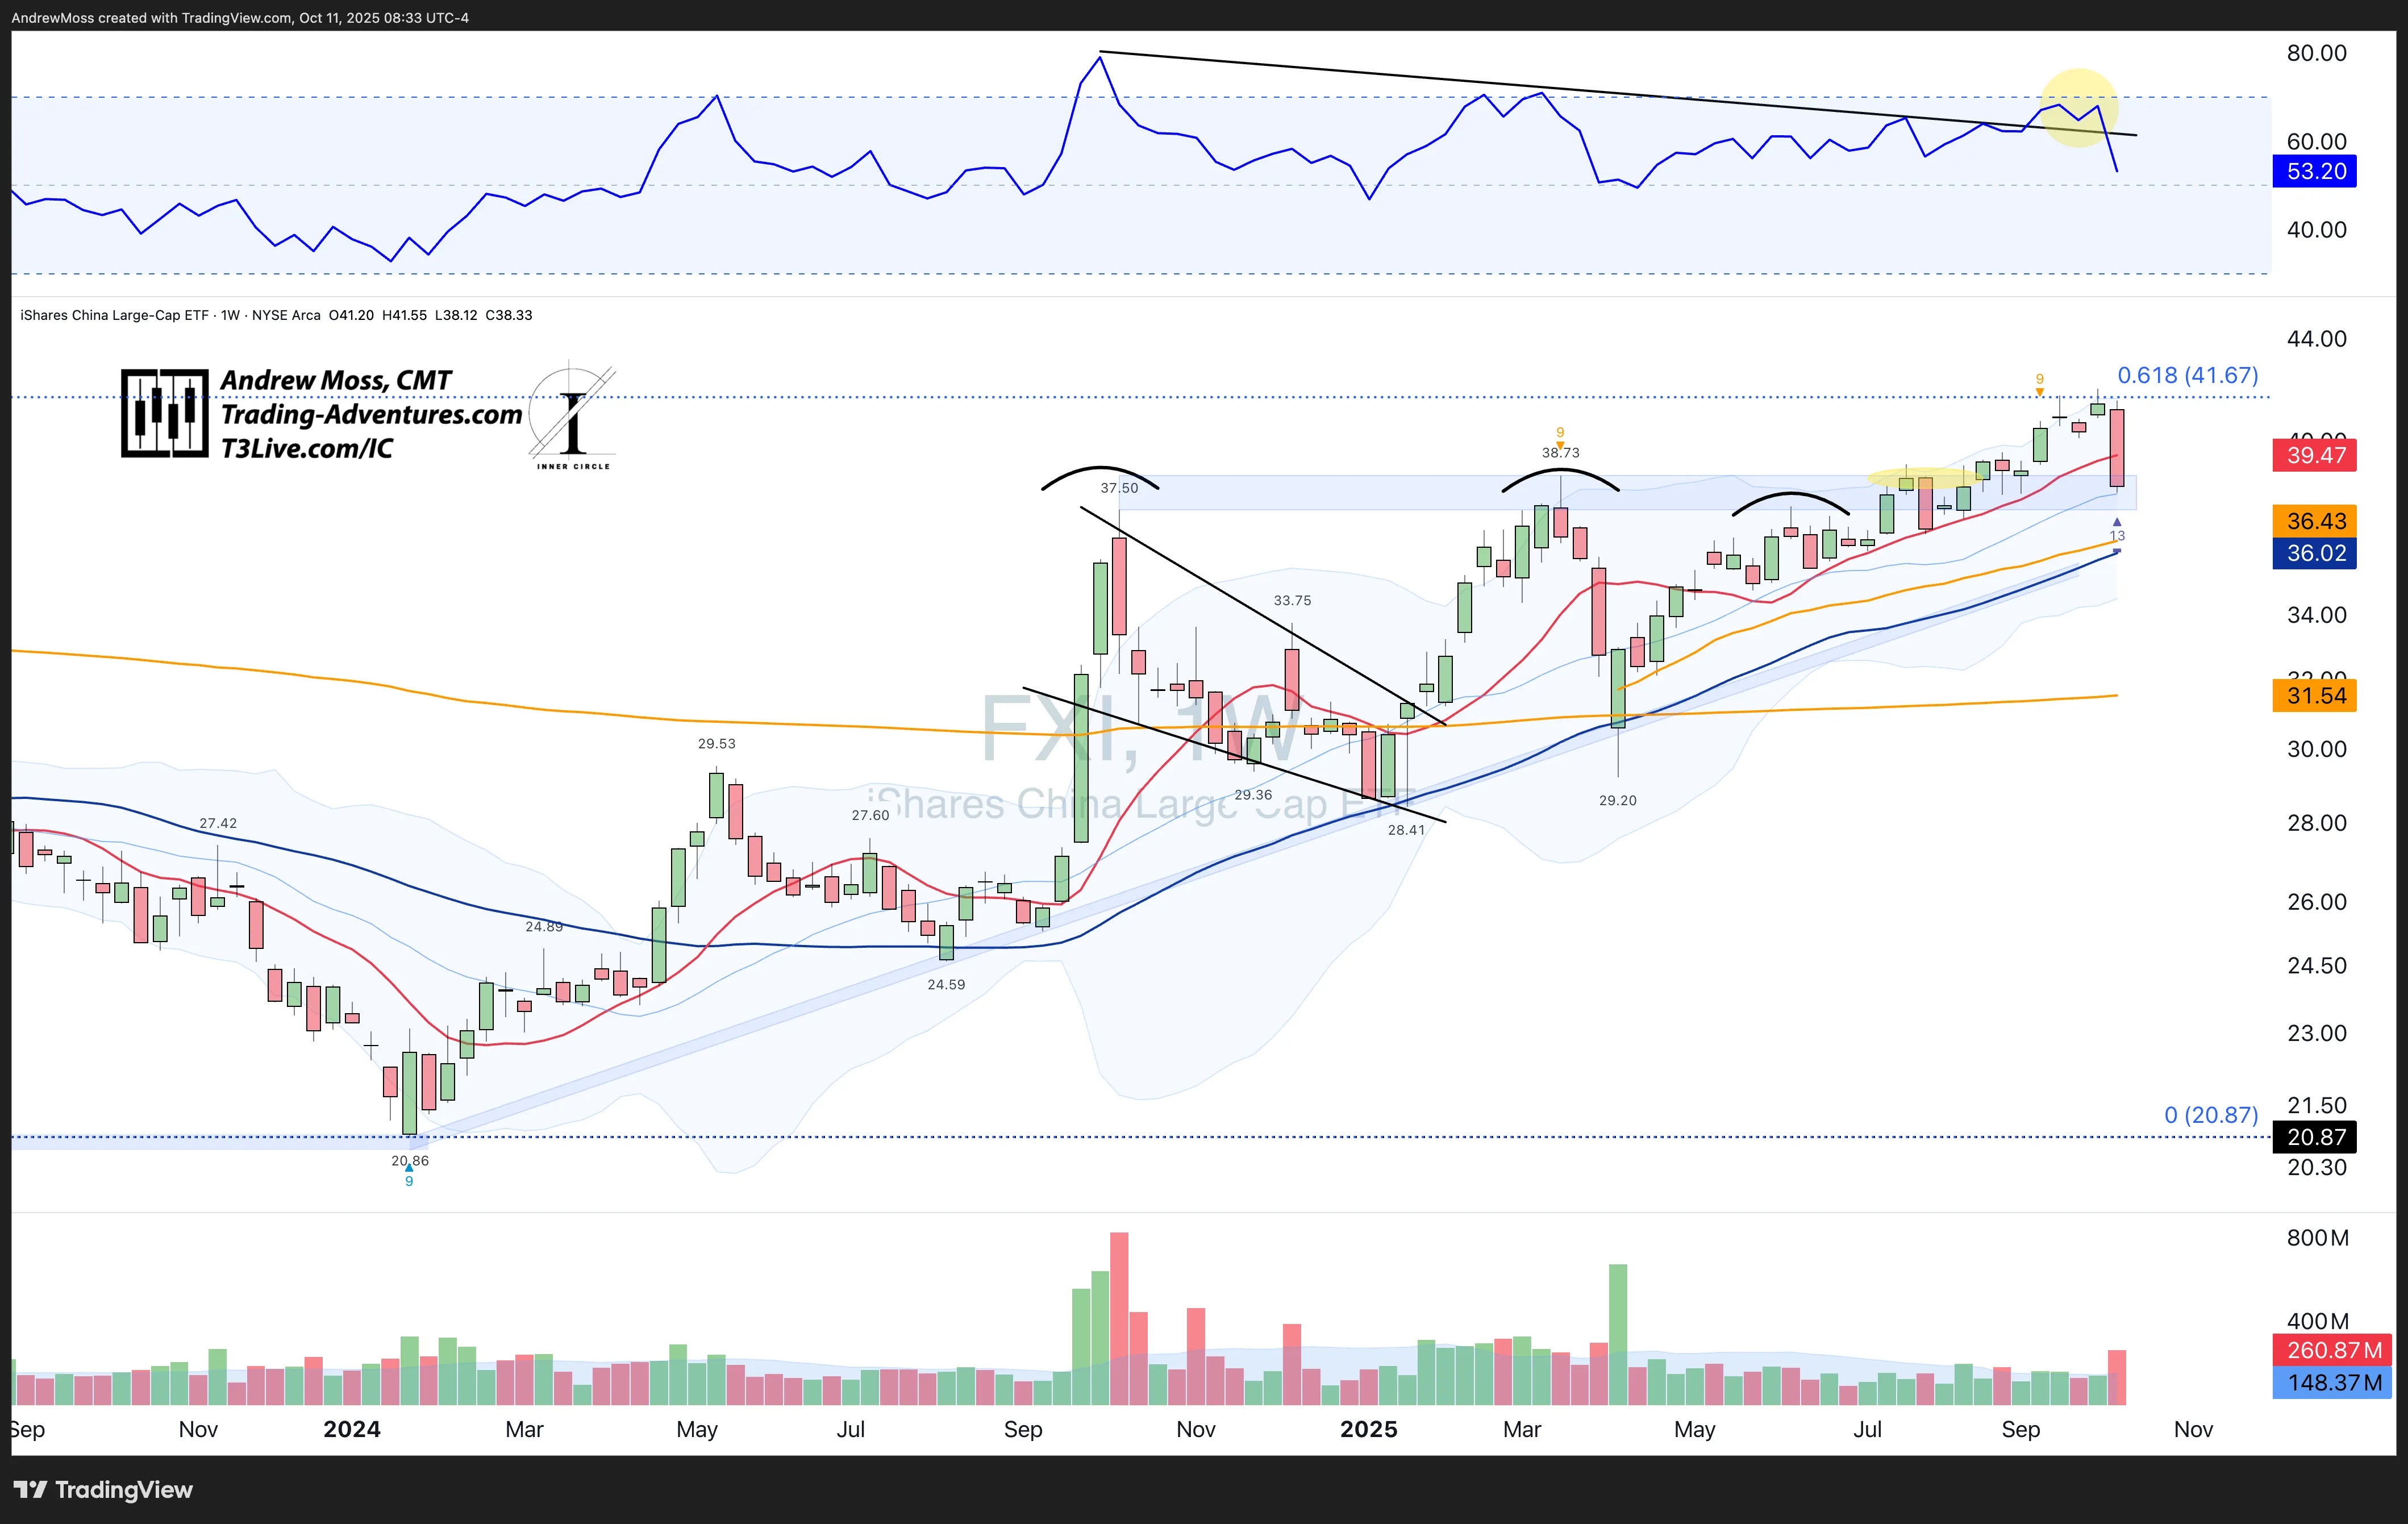
FXI (China): Stuffed at the Fib retracement. Now back below the 10‑week and into the middle of the BBands and pivot area. RSI also lost momentum and will test the mid‑line soon. Volume was nearly double the average.
🧱 Bonds & Commodities
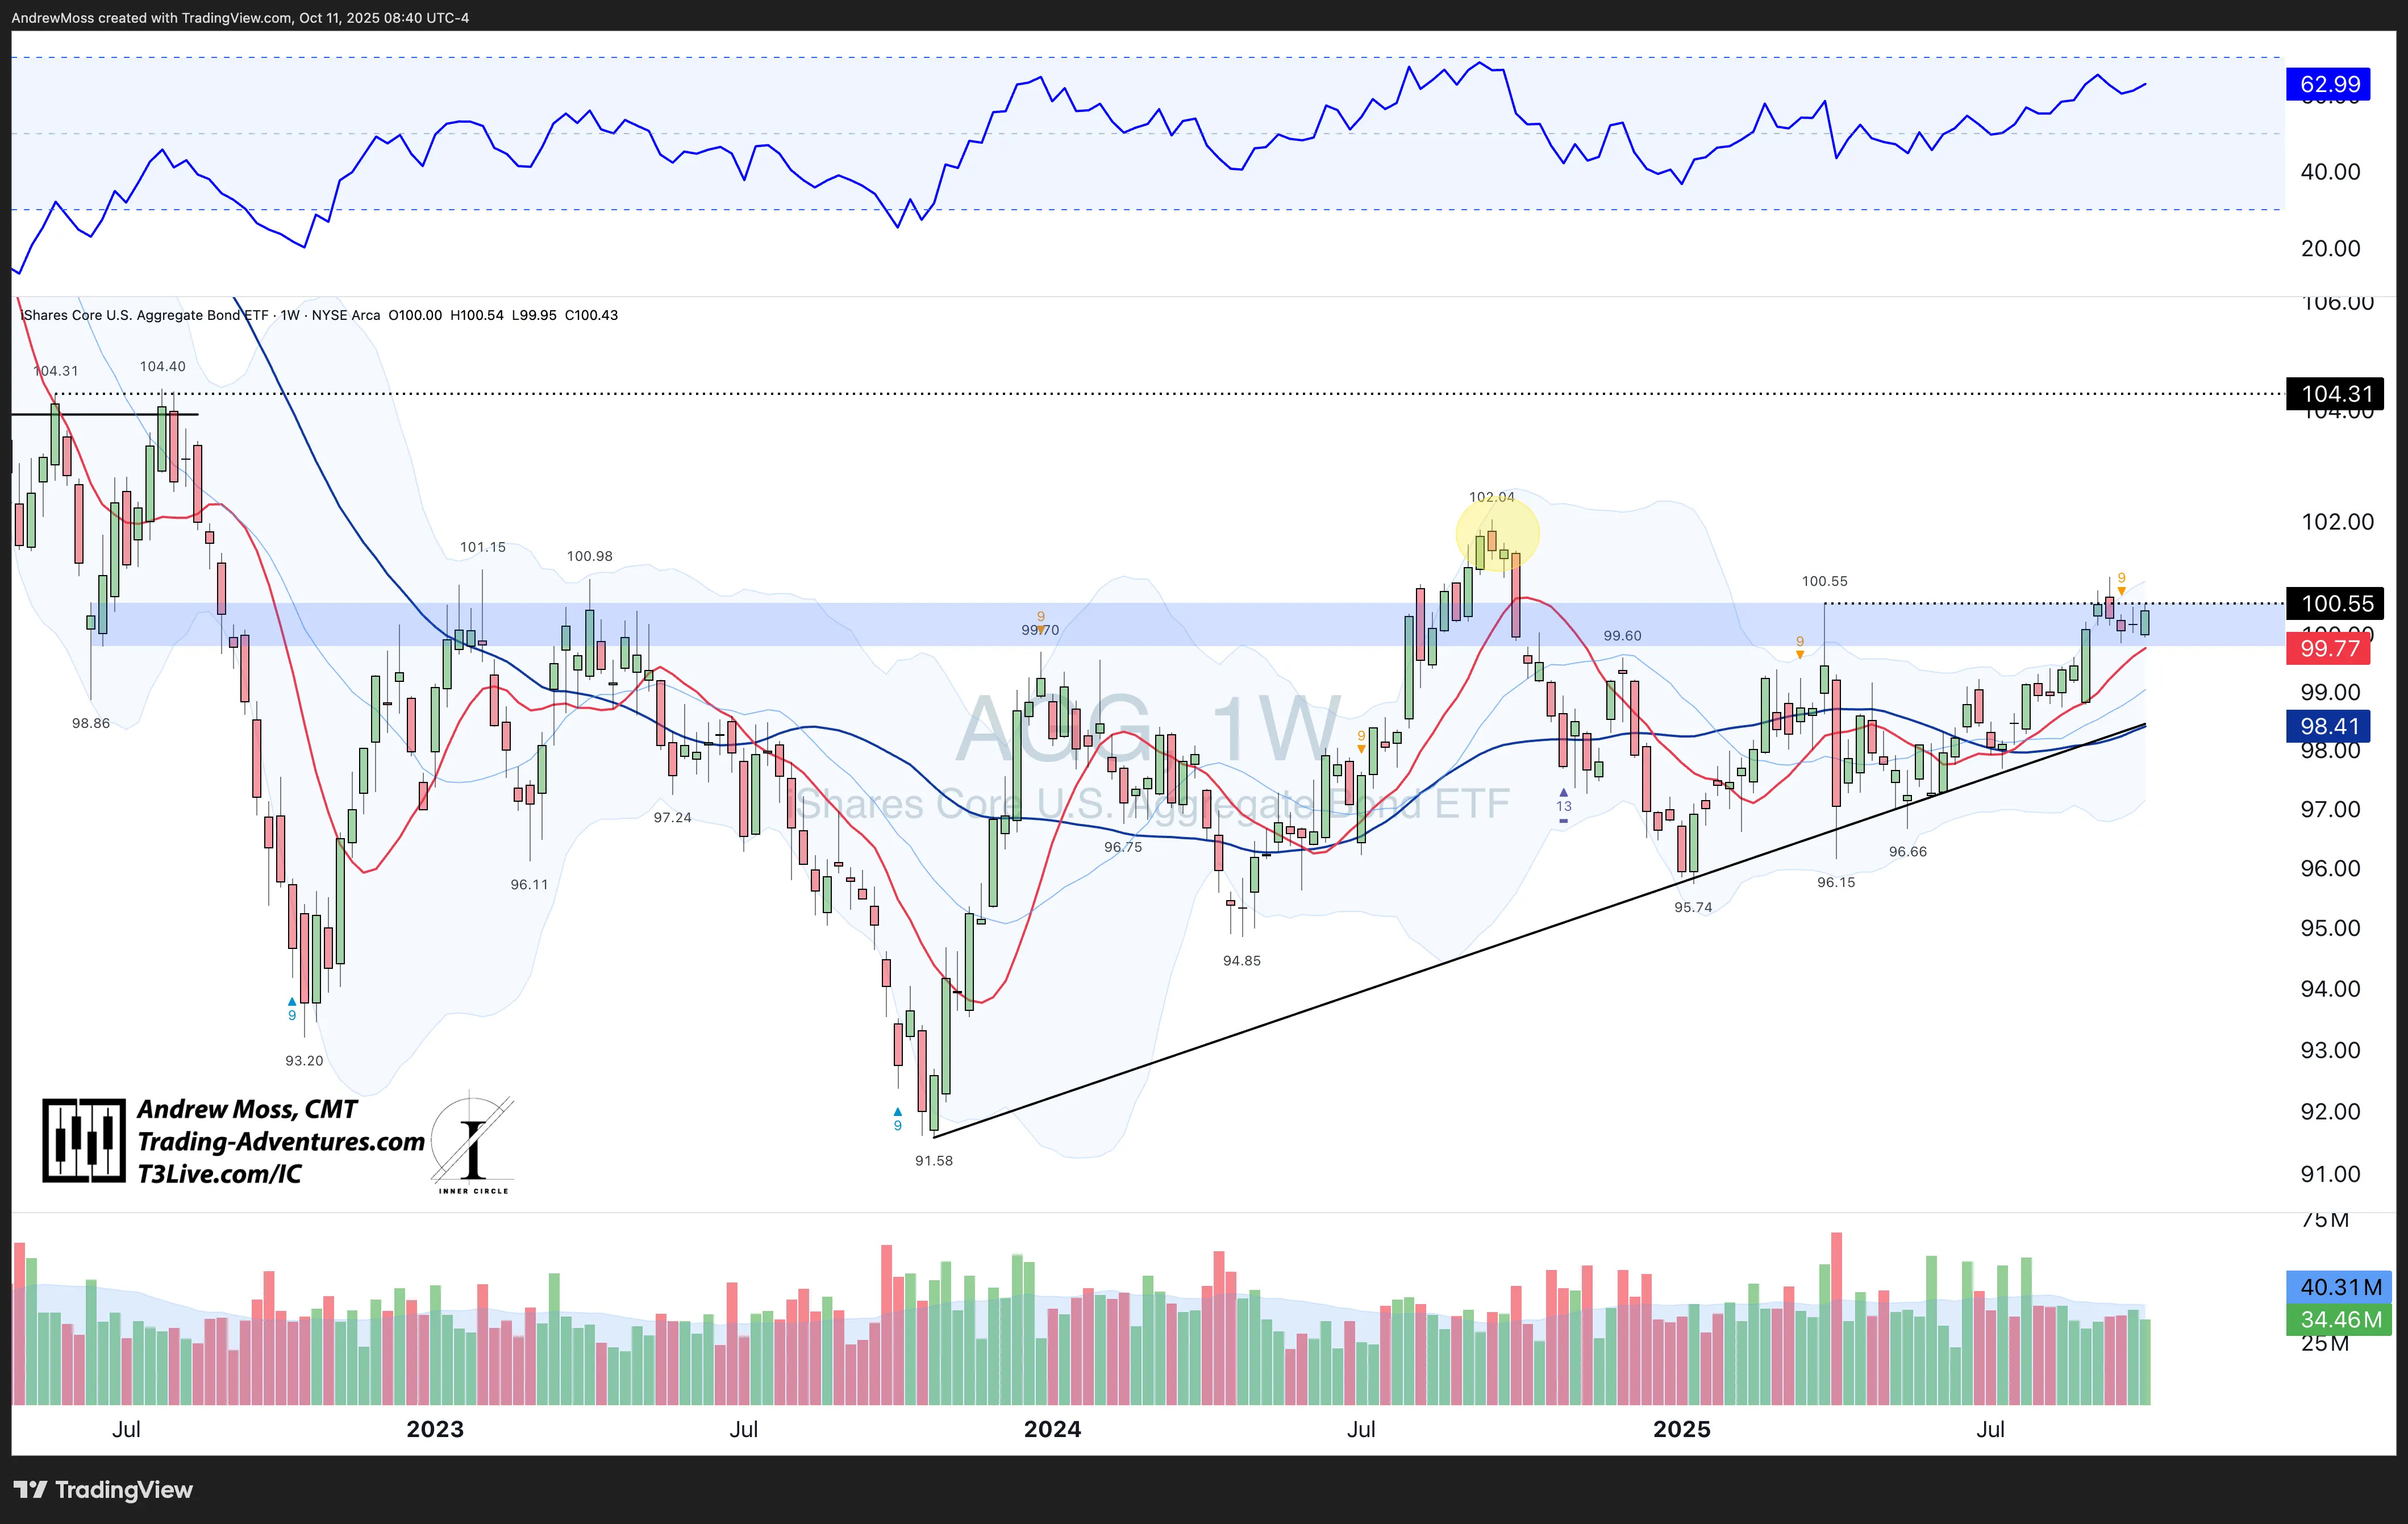
Bonds (AGG / TLT / HYG): Quality bonds (AGG, TLT) held up well while high‑yield credit (HYG) sold off alongside equities — not unexpected given the sharp shift in sentiment. Relative strength in Treasuries shows some early signs of defensive positioning.


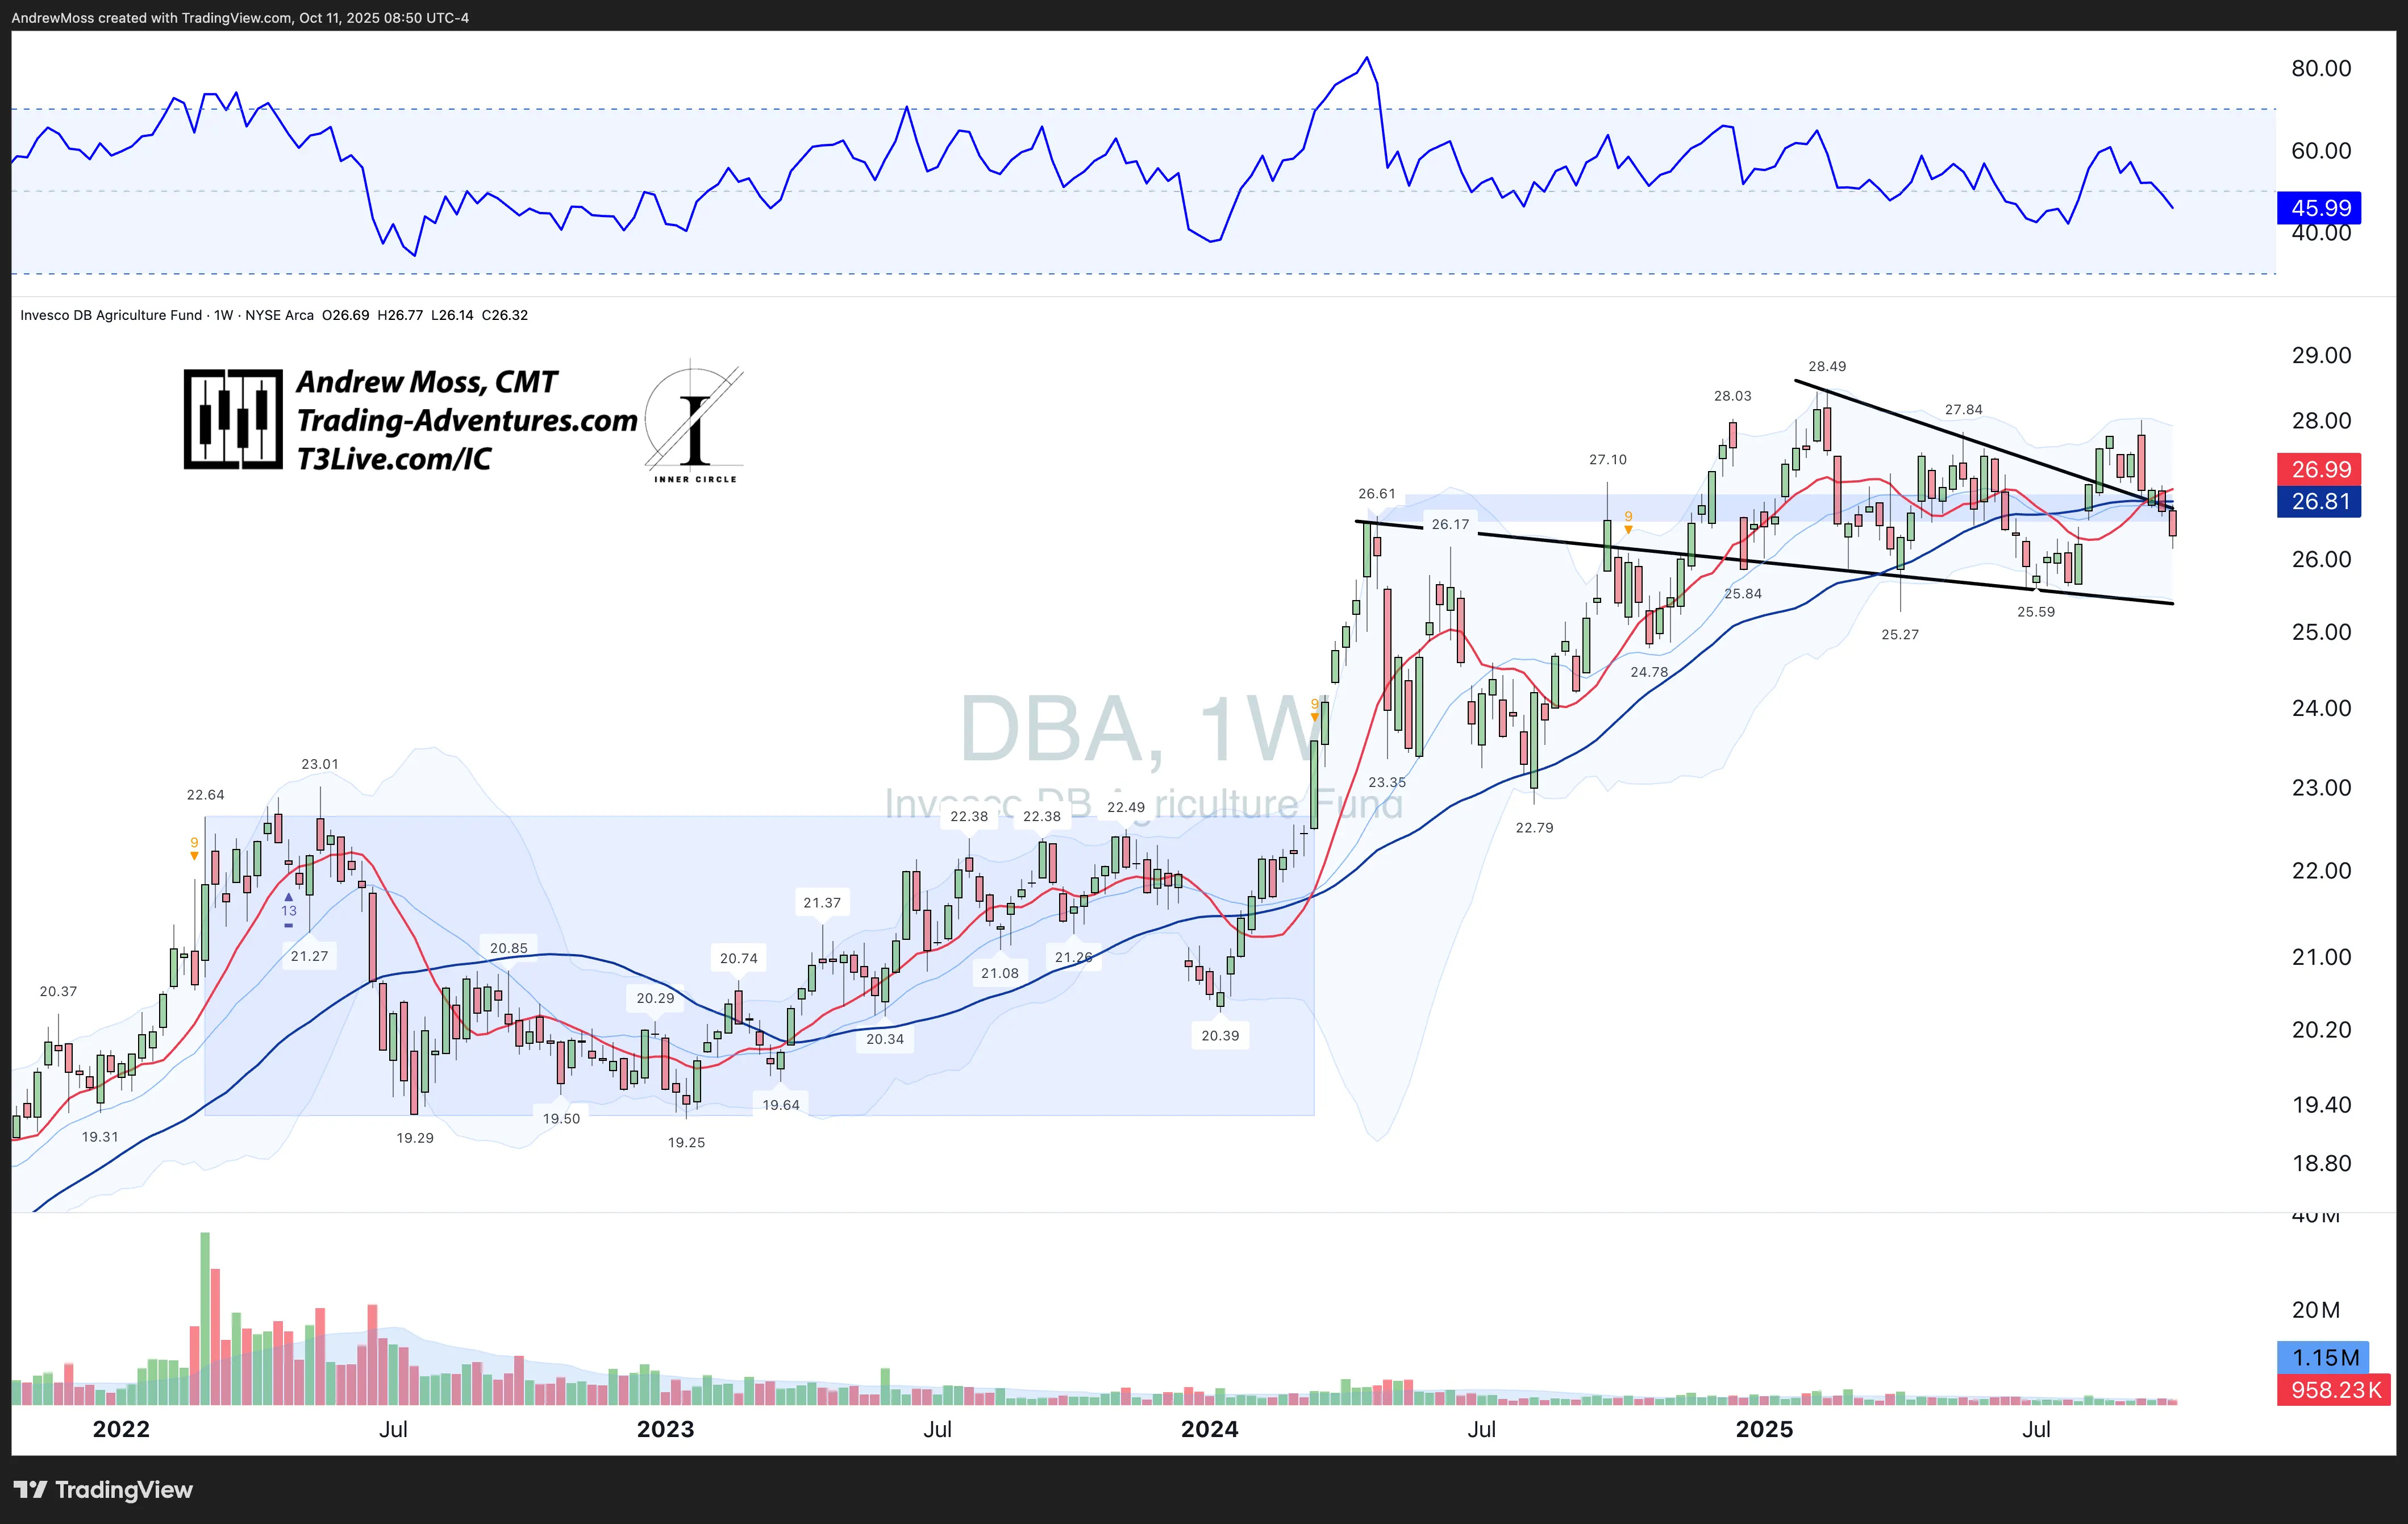
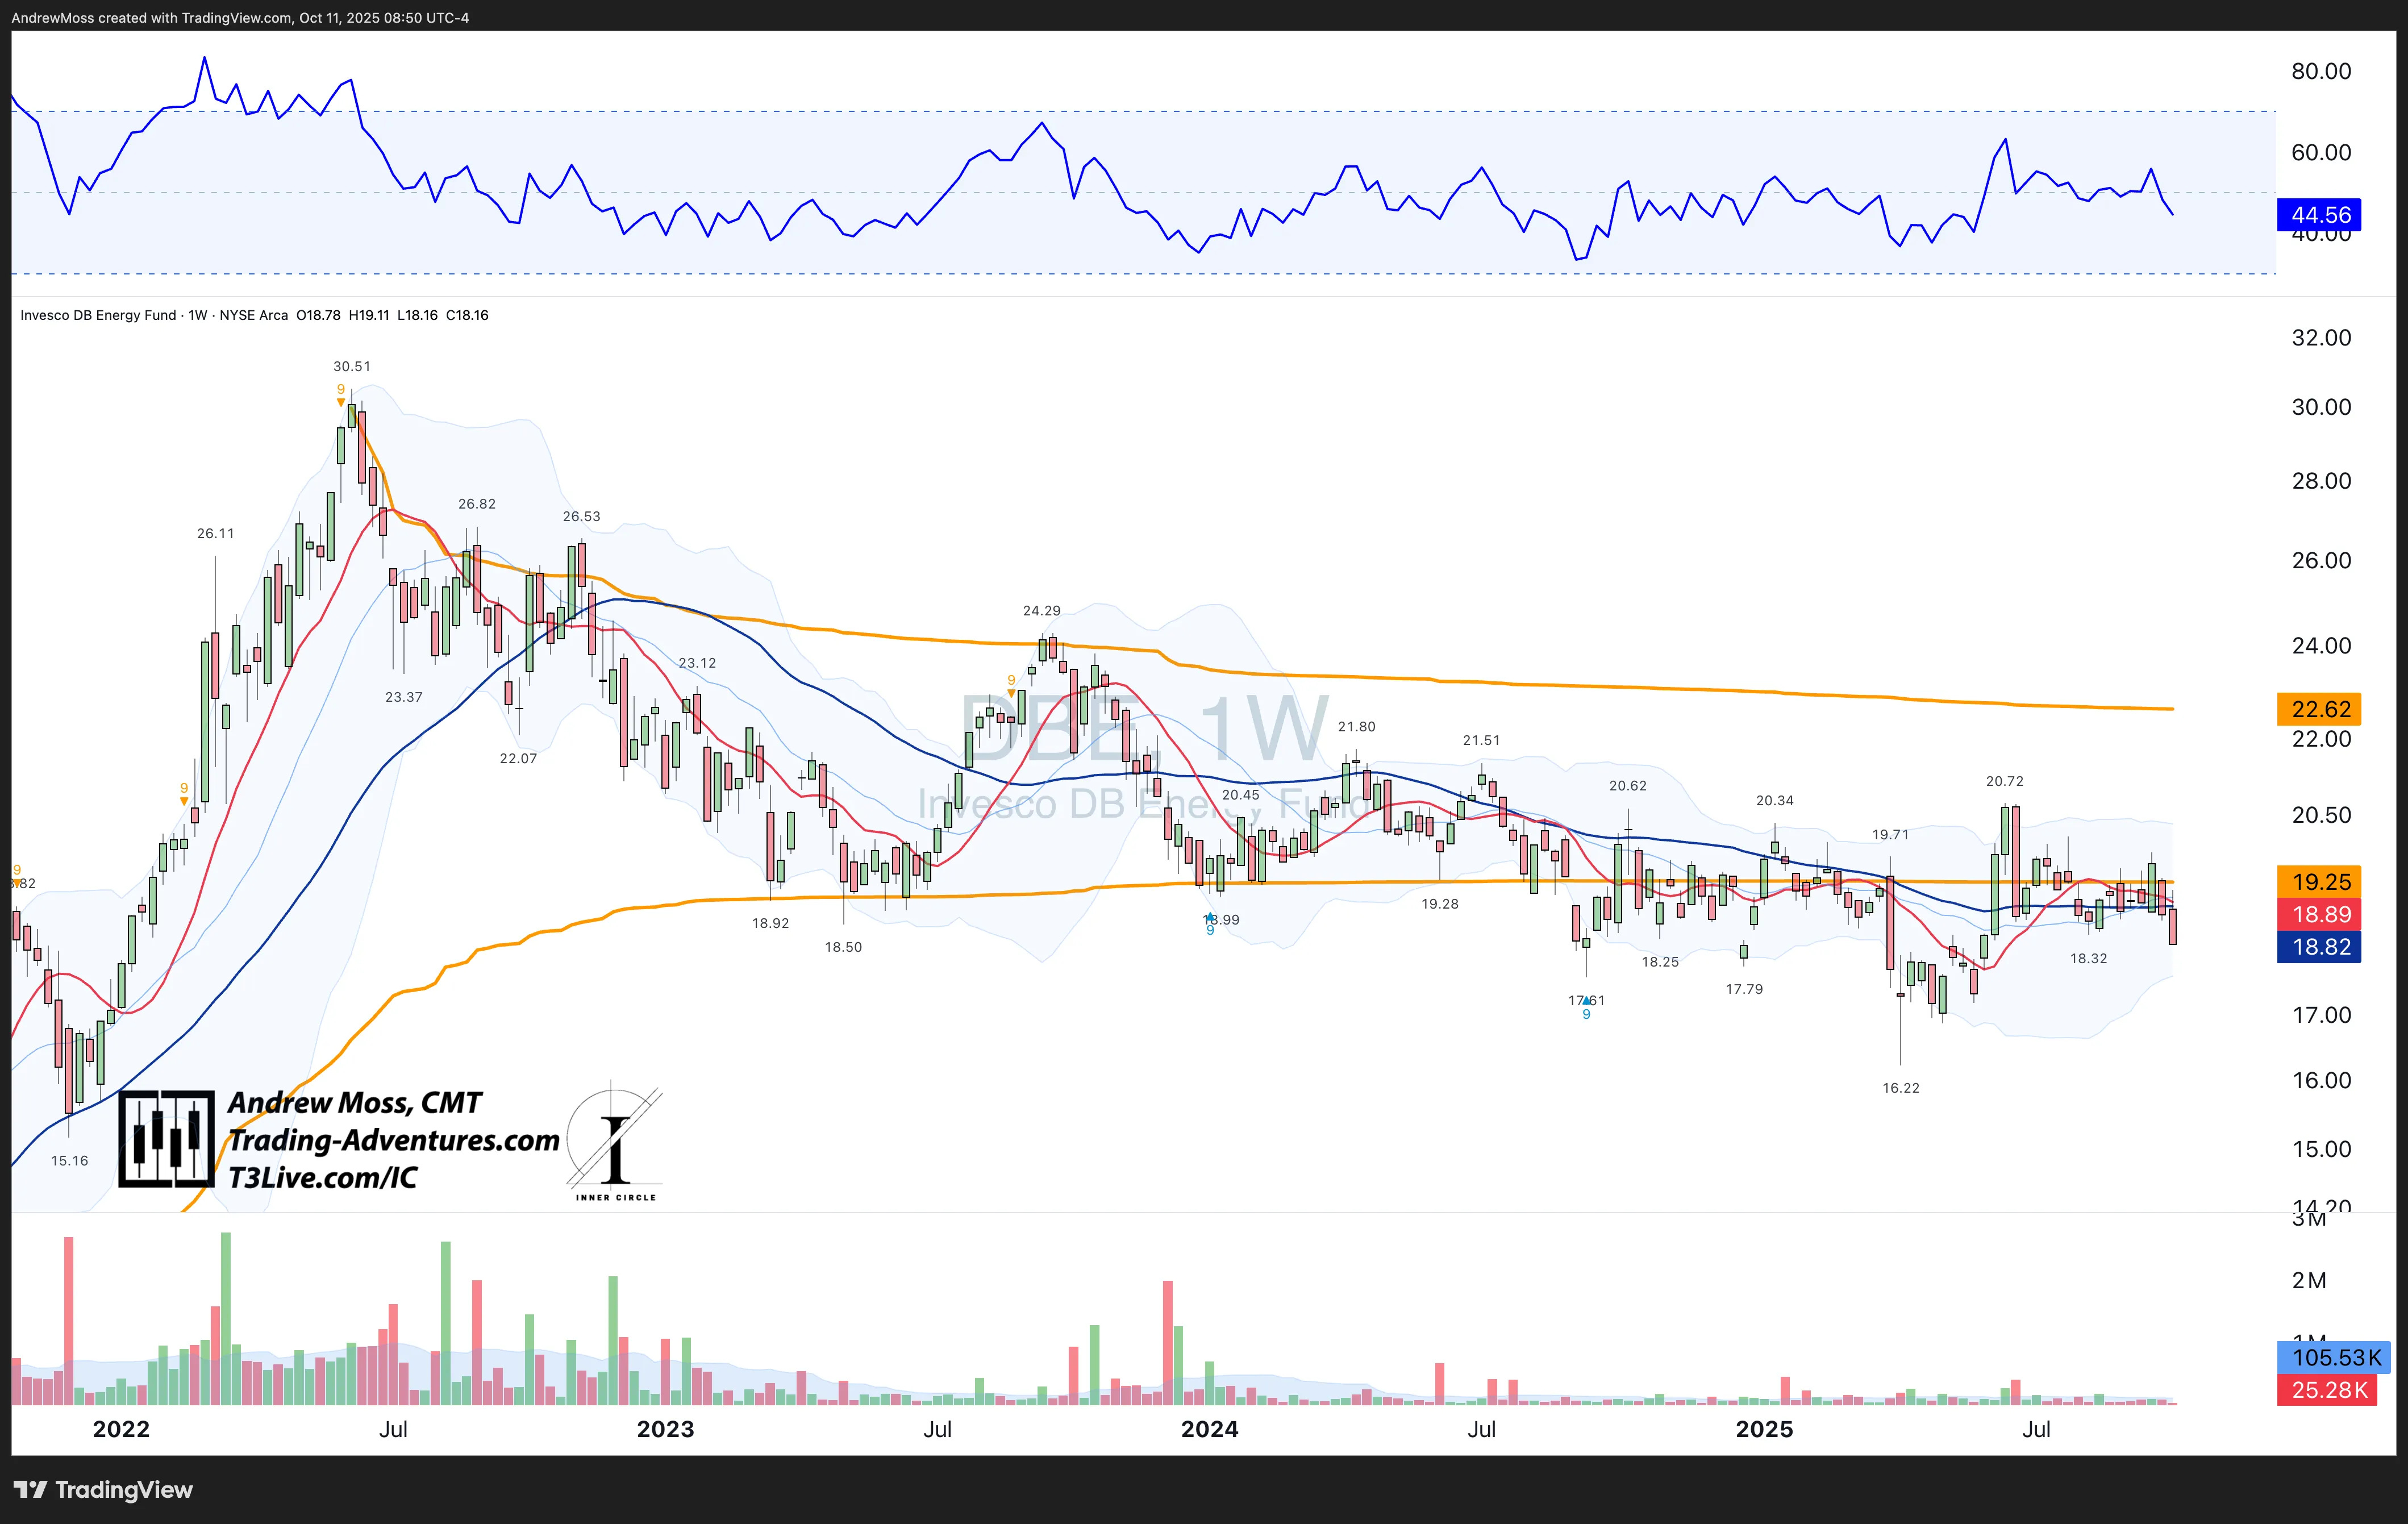
Commodities:
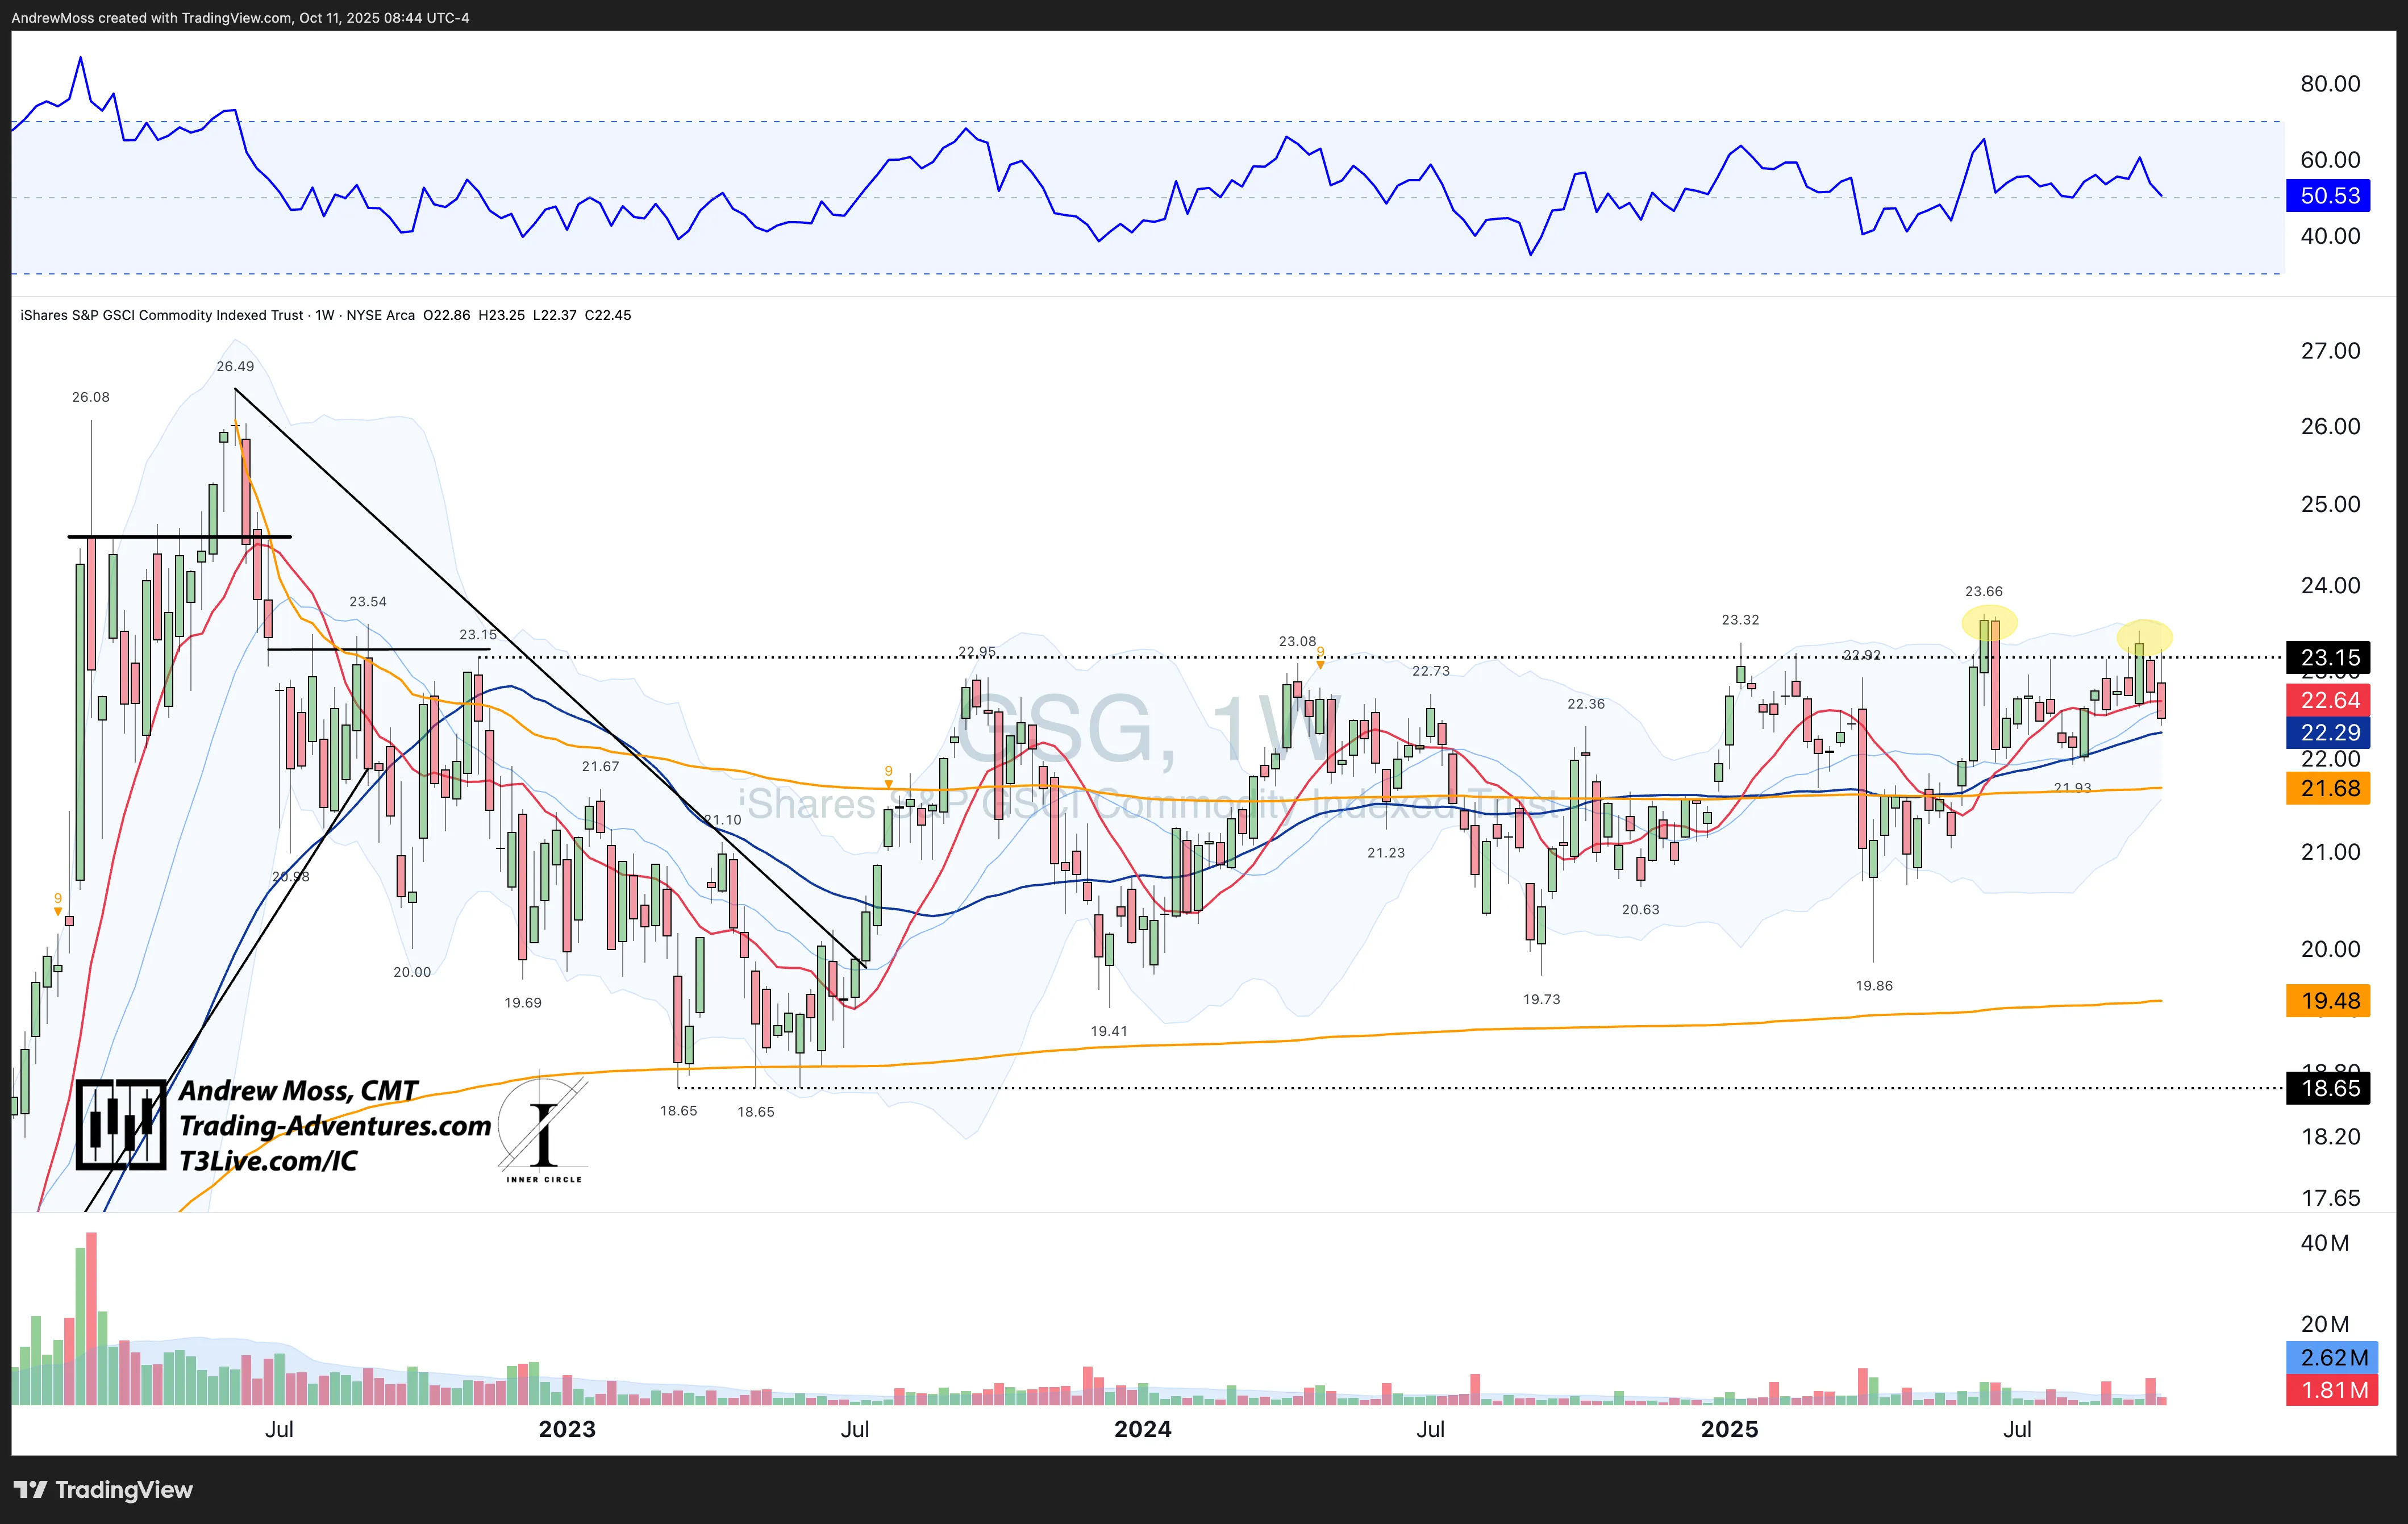
GSG with yet another failed breakout attempt. The group was mixed, though.
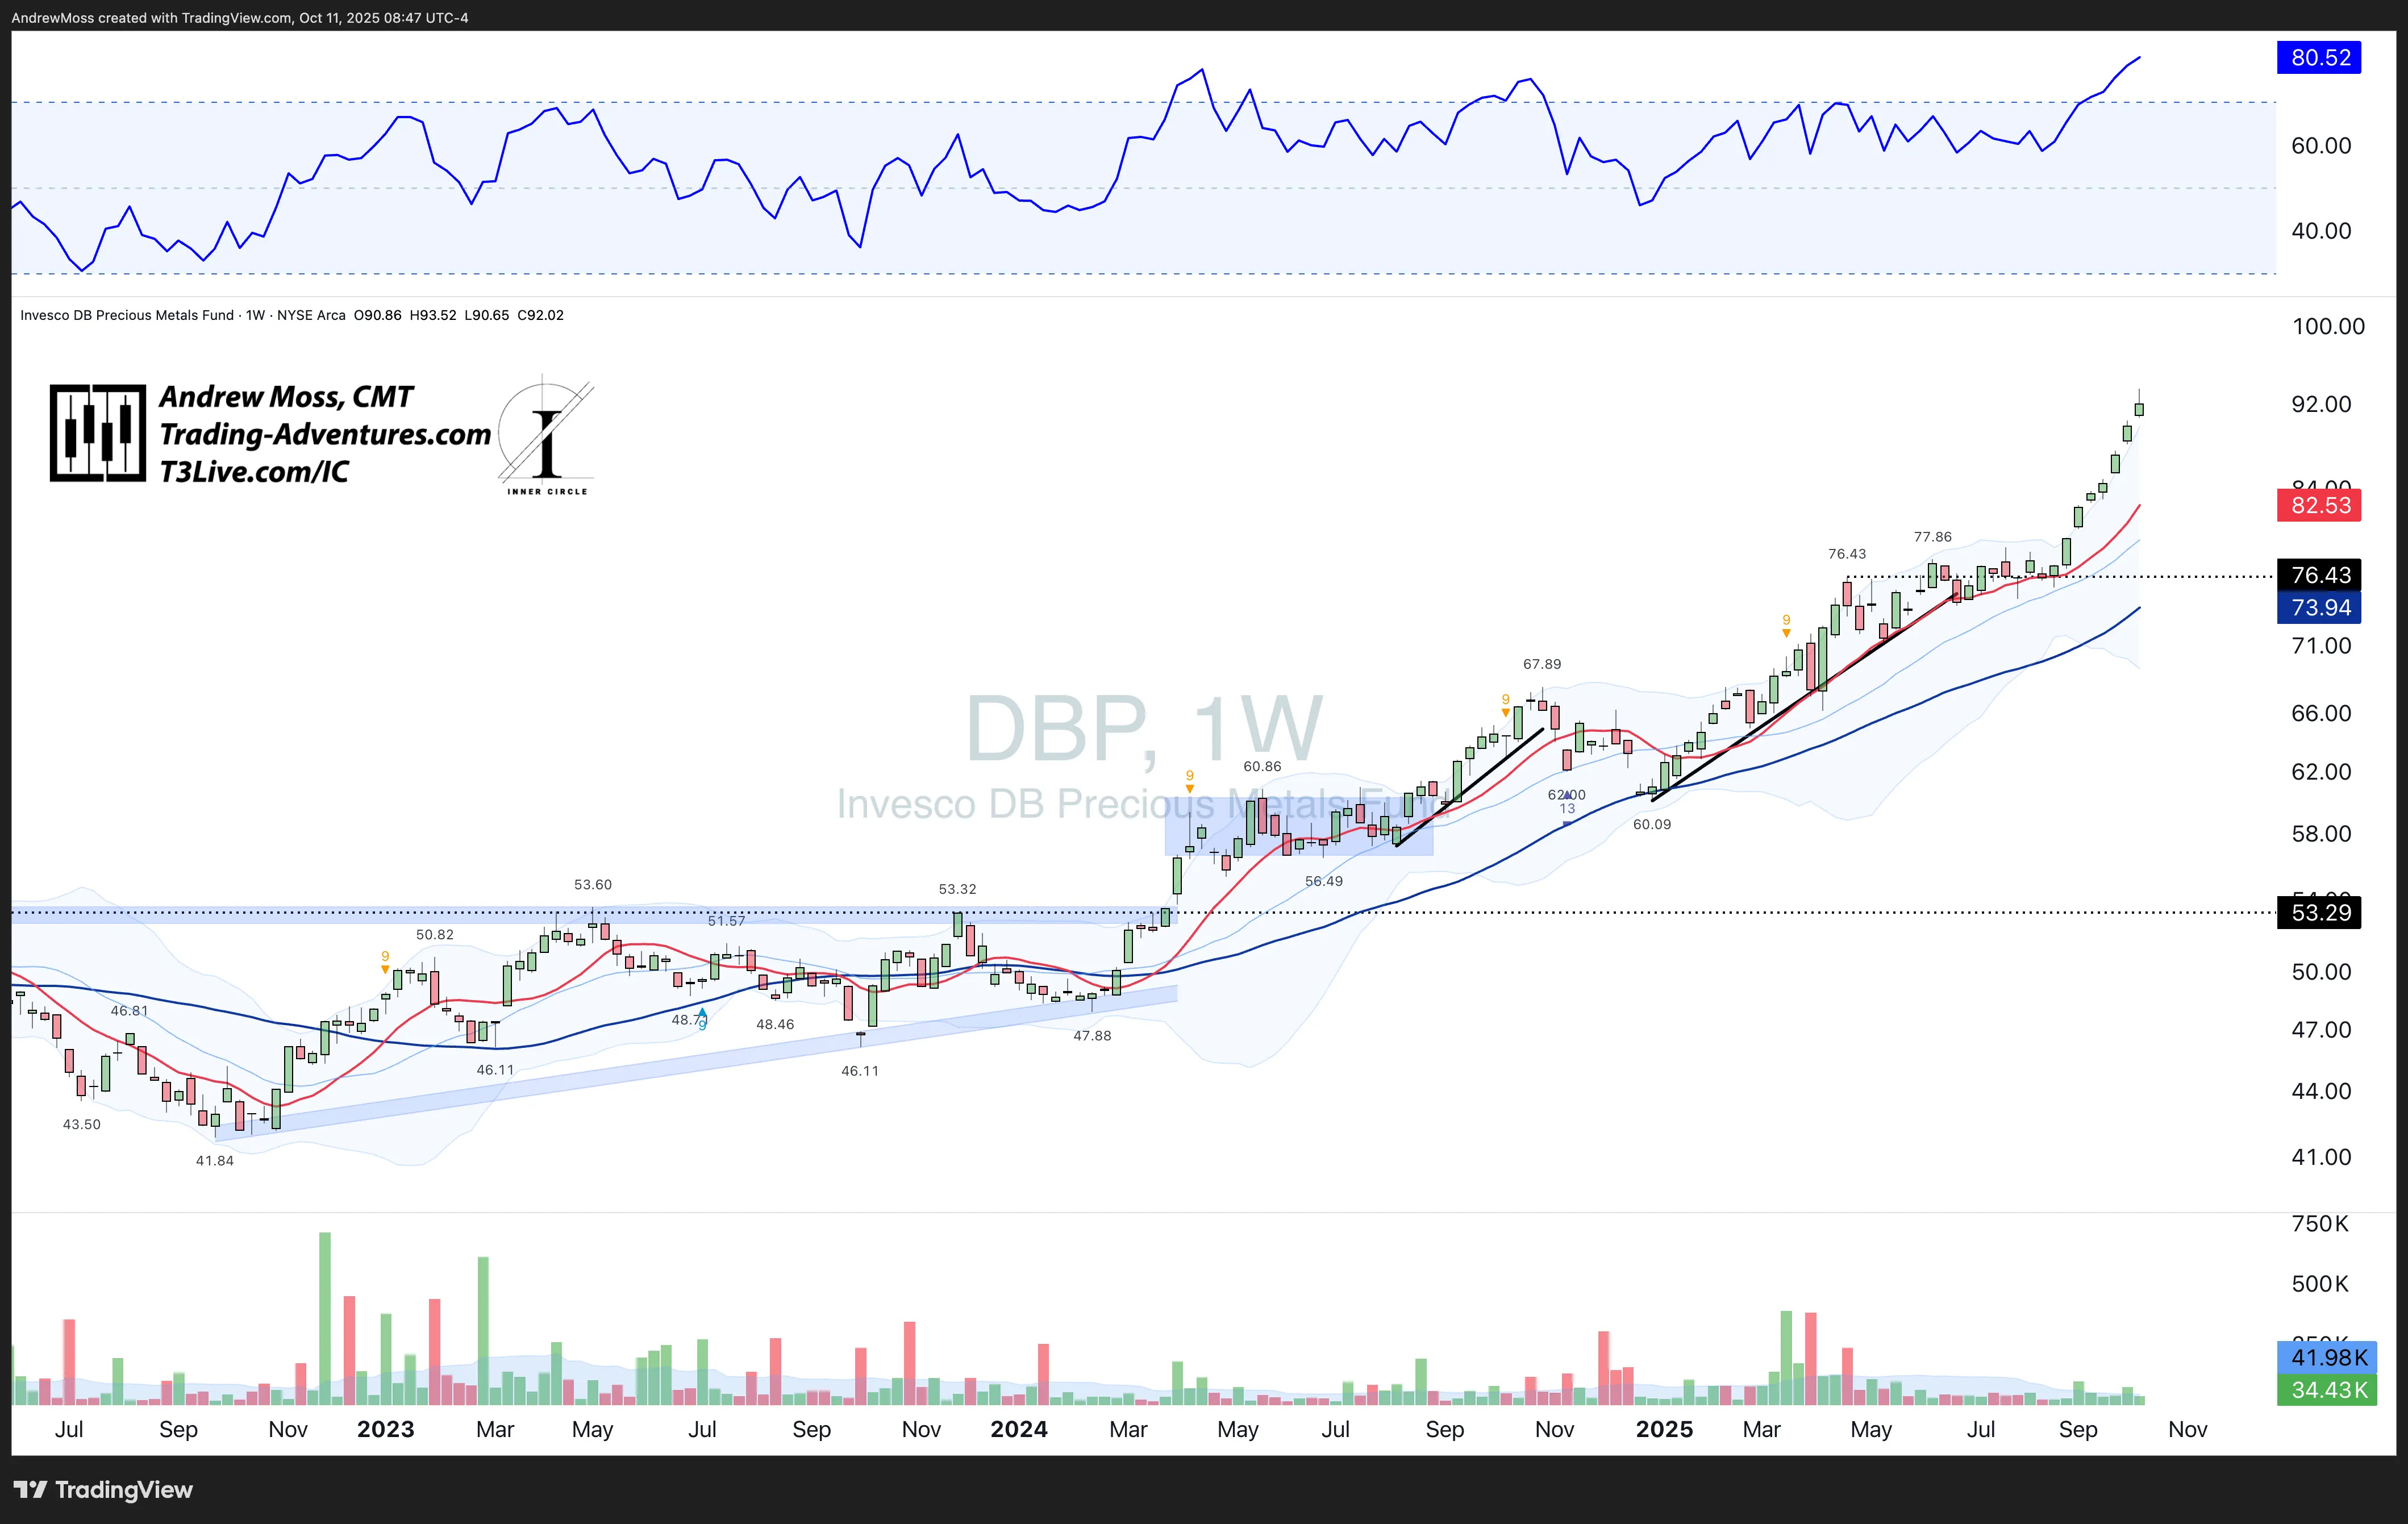
DBP (Precious metals) moved further up in the now parabolic move.
DBB (Base Metals) had strength that faded a bit by the end of the week.
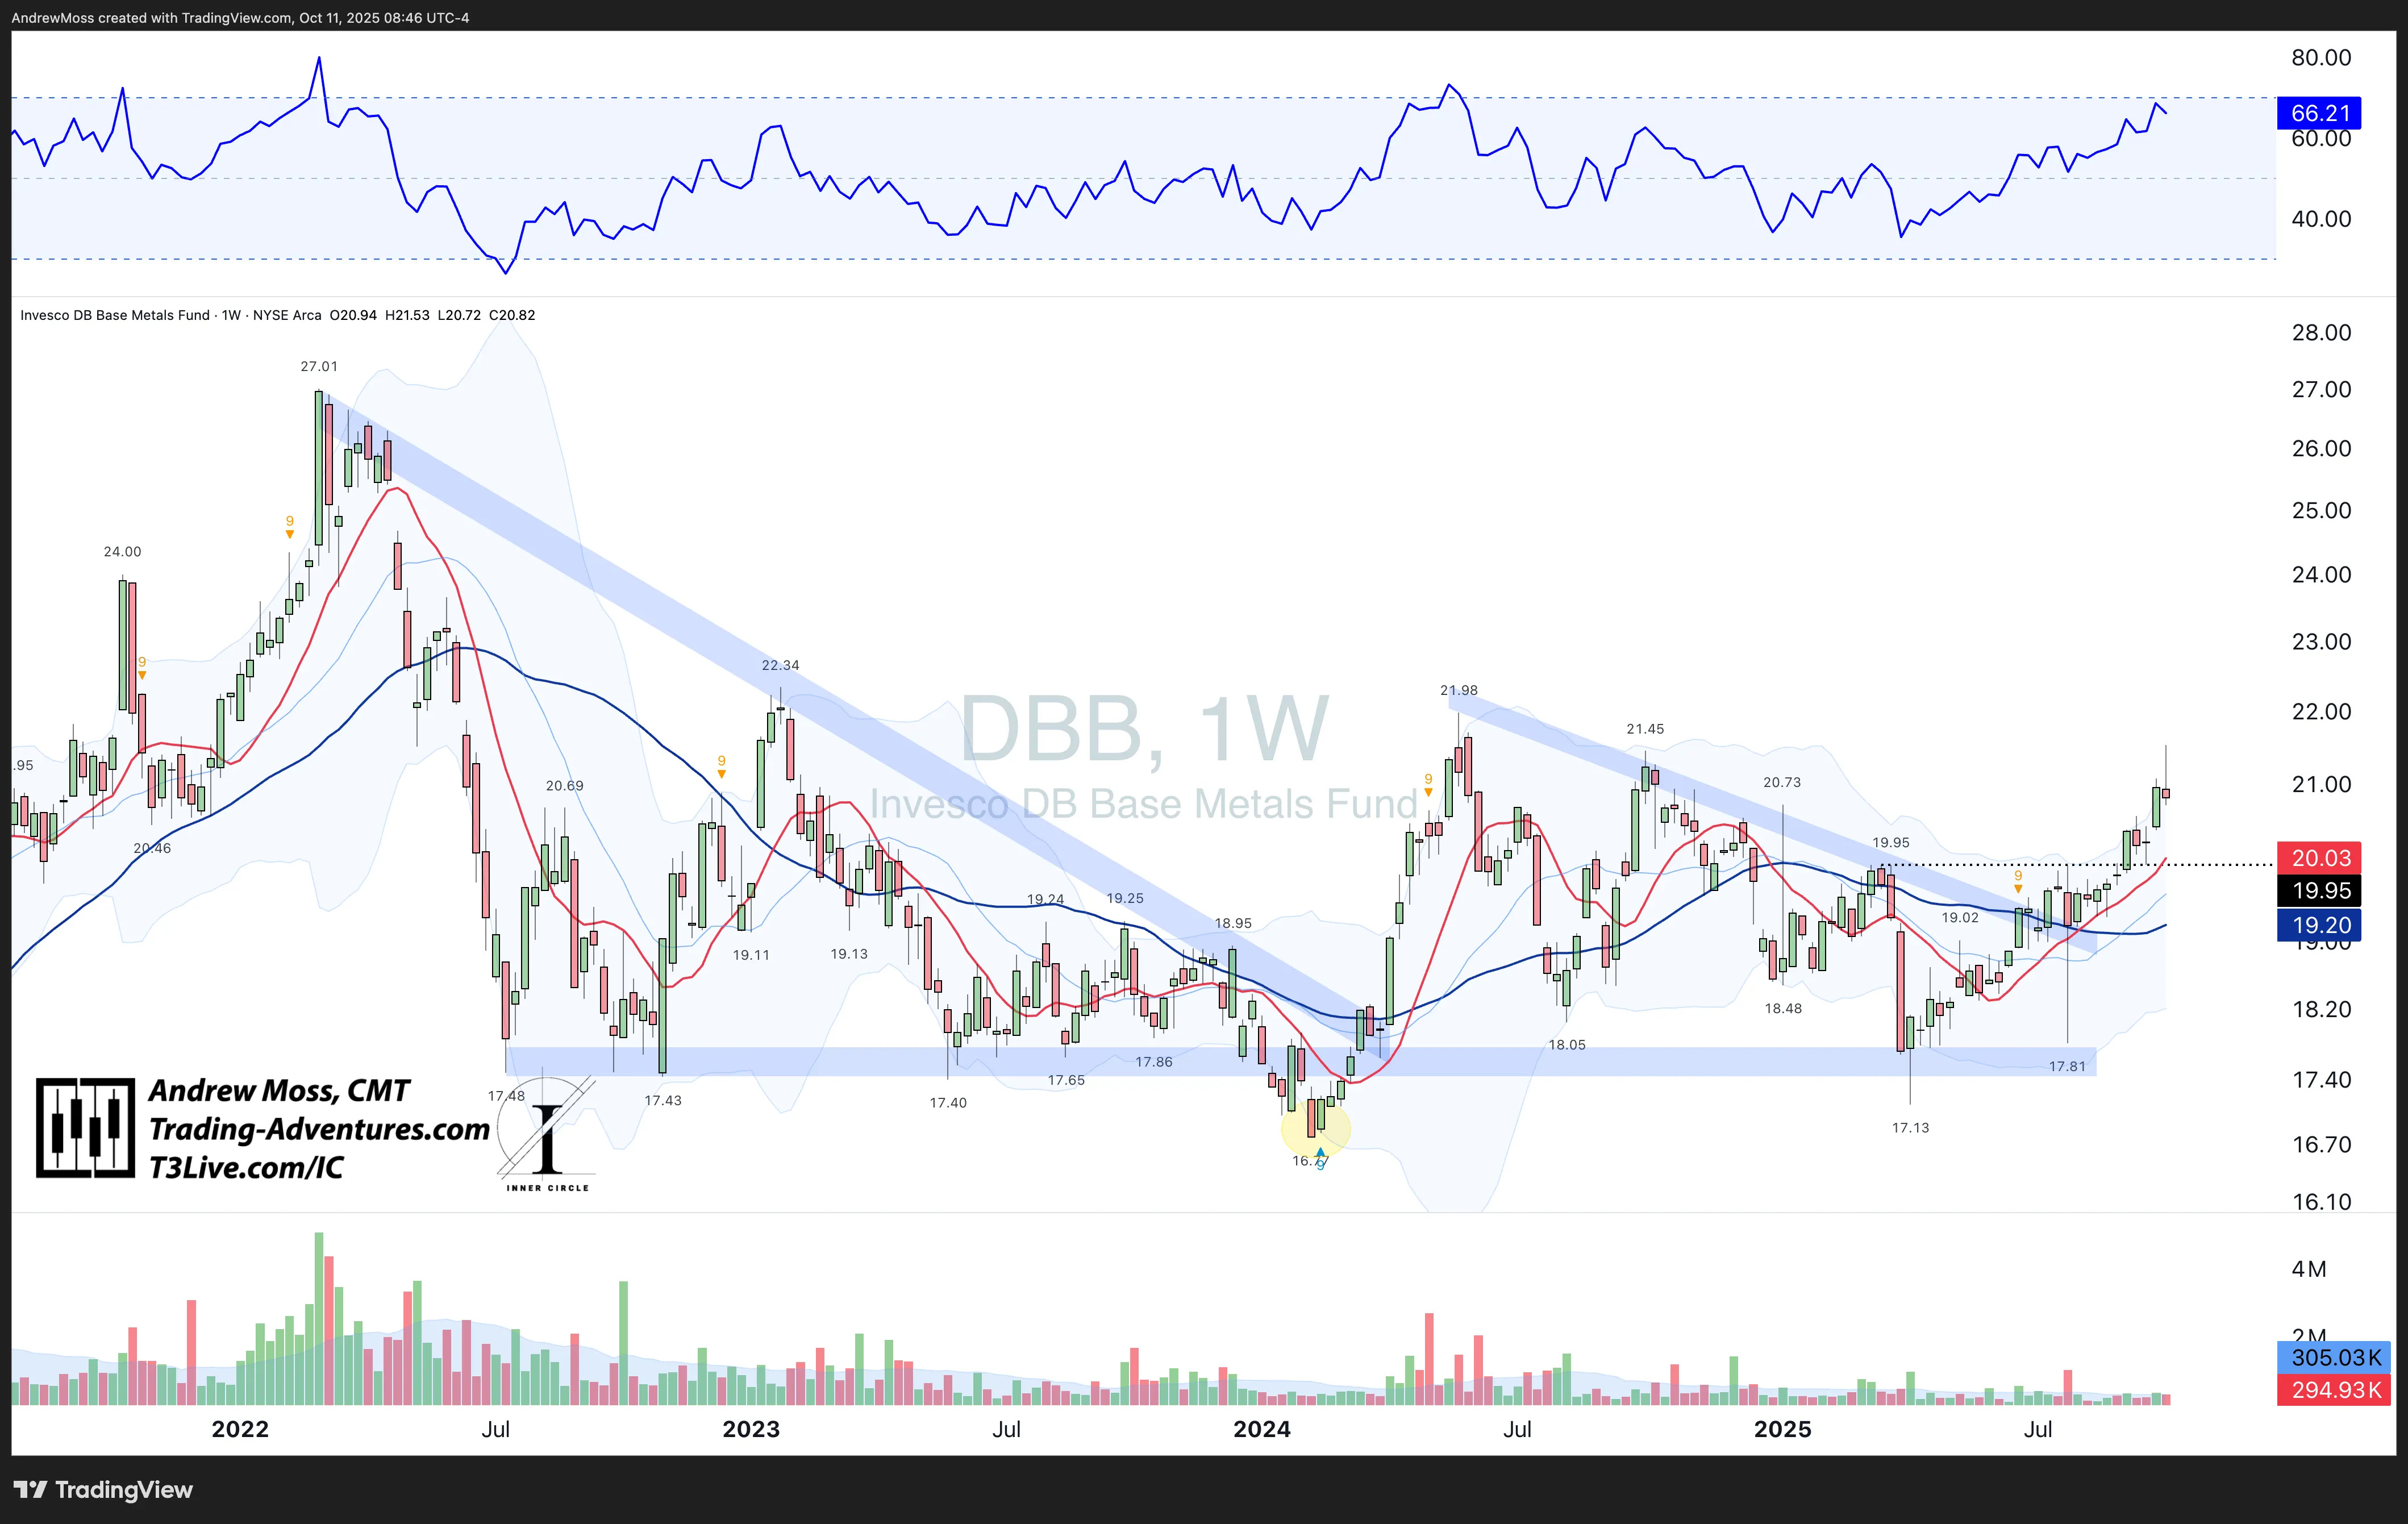
DBA Agriculture and DBE Energy were detractors.
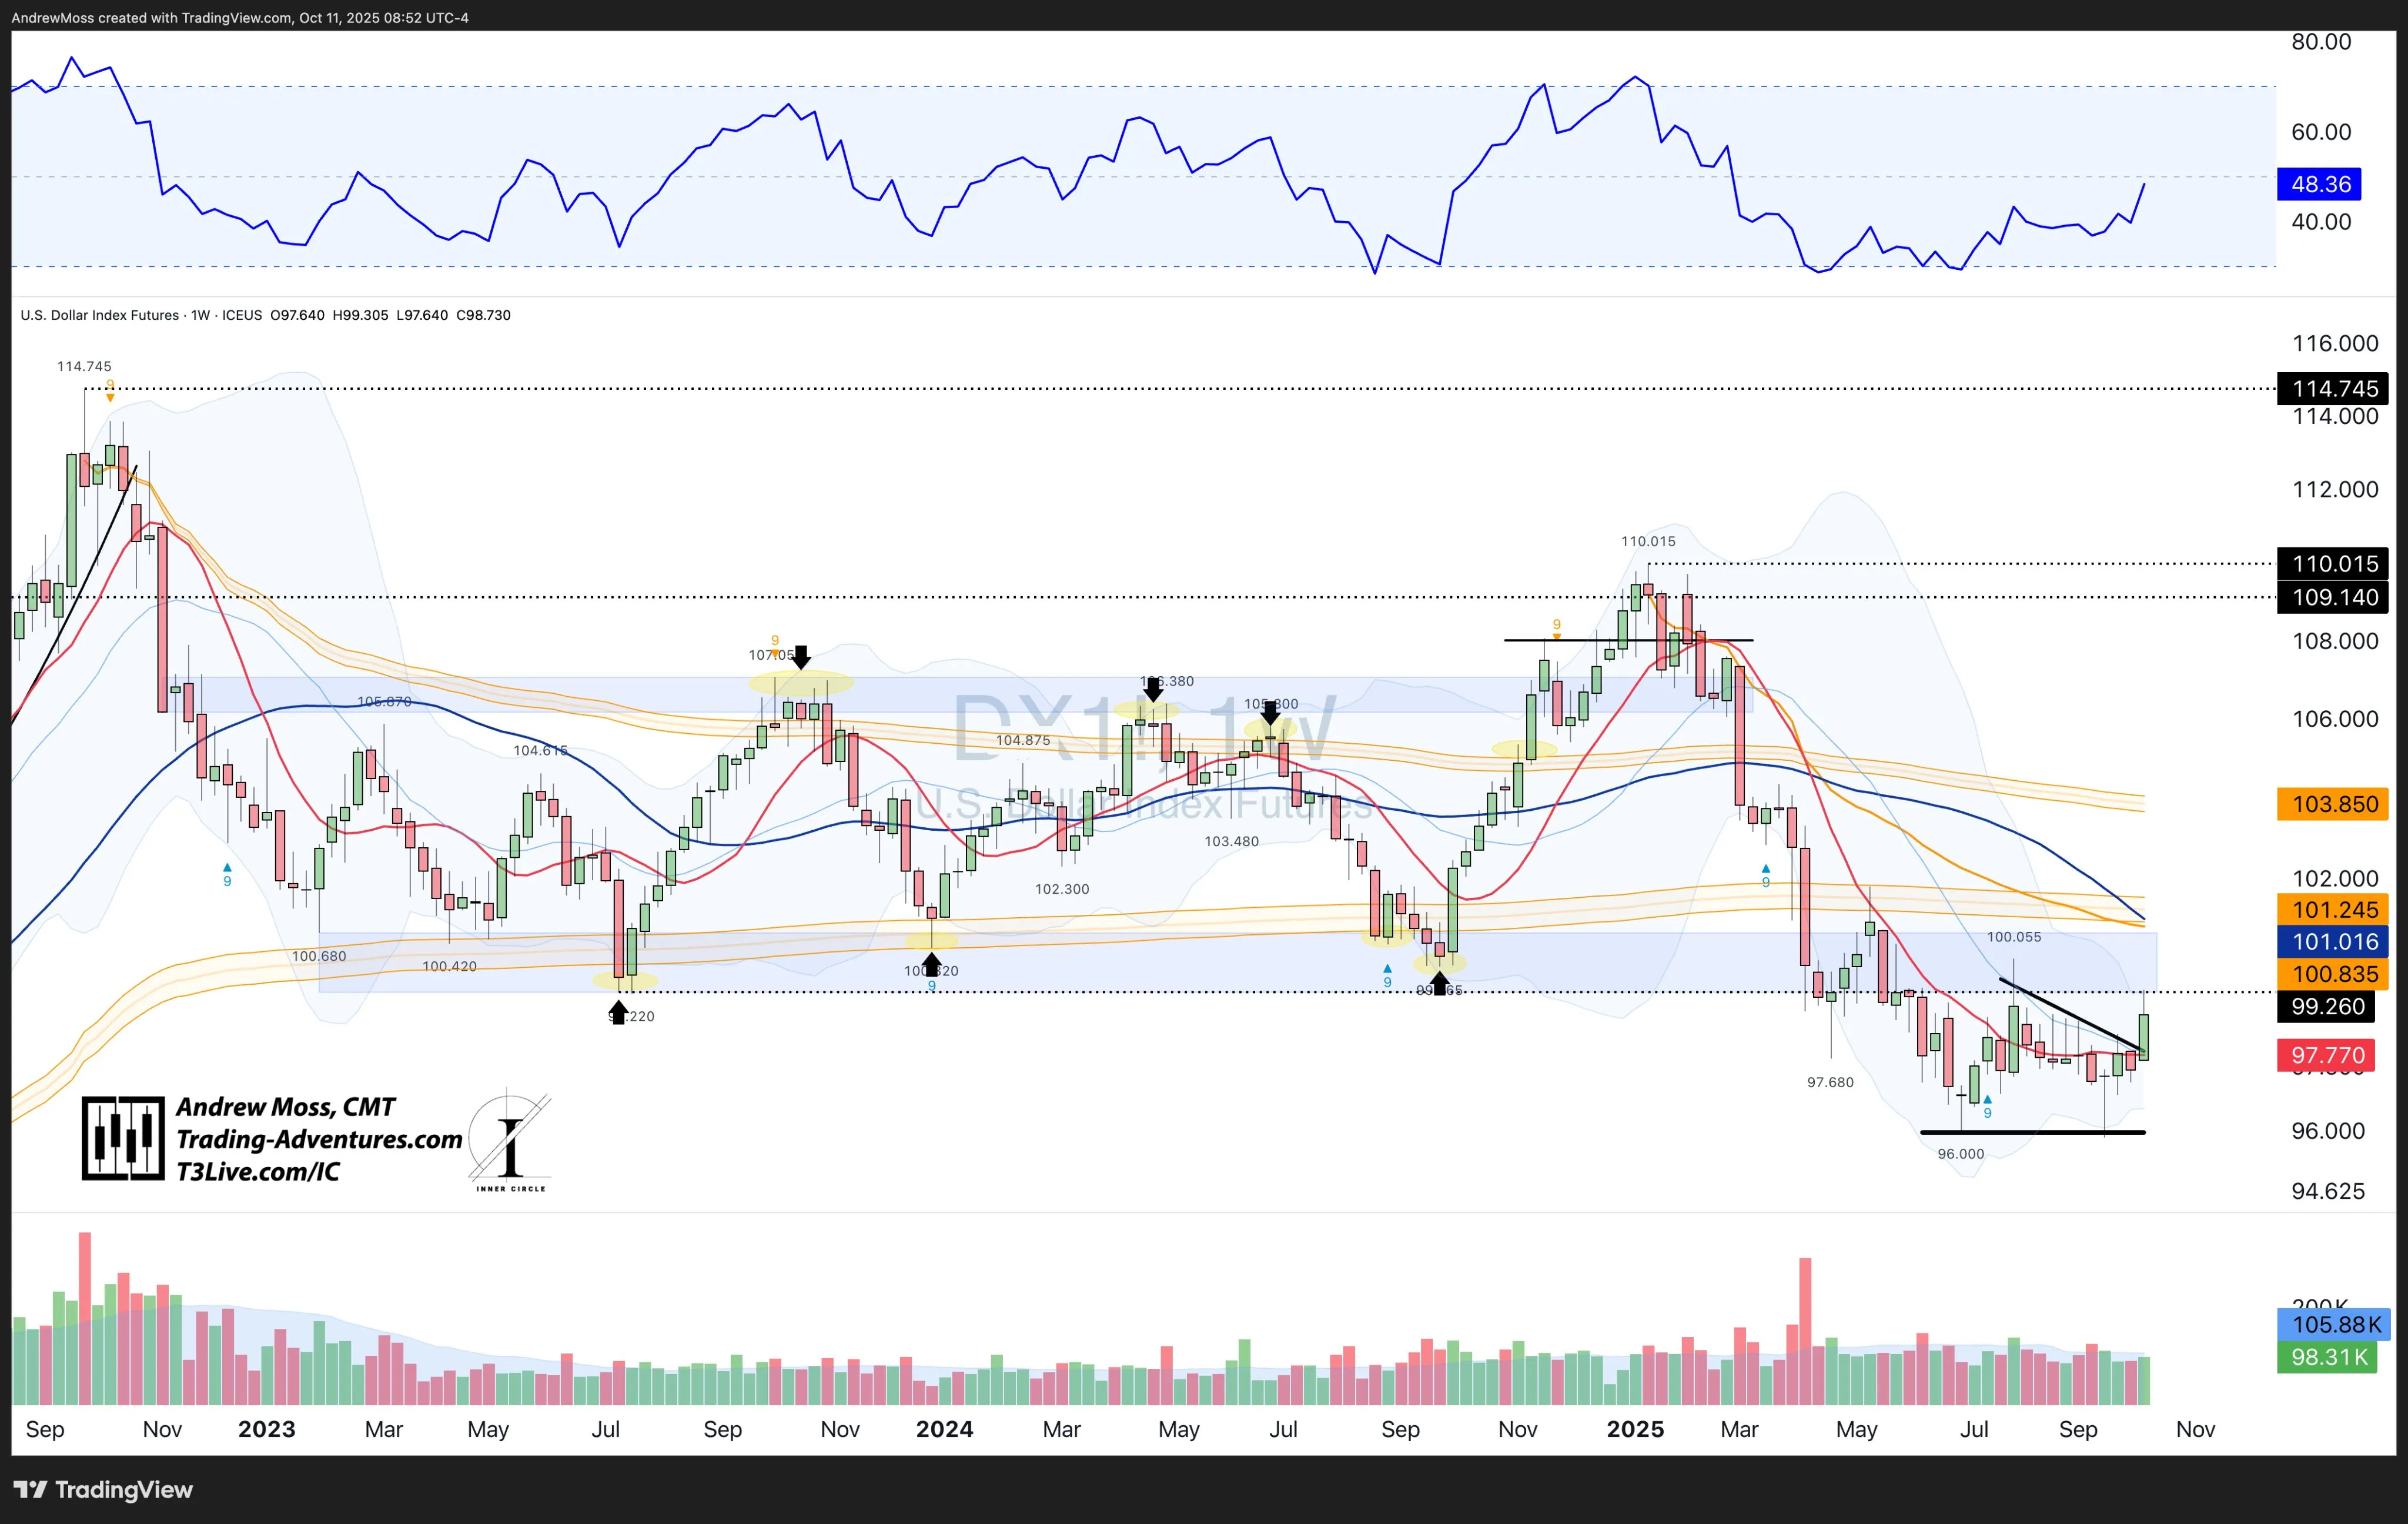
💵 U.S. Dollar
DXY / DX1! The Dollar had a breakout move and looks like it has bottomed for now. Strong move out of the pattern and above the 10‑week MA, finding some resistance exactly where it should — the bottom of the long‑standing range.
₿ Crypto Check
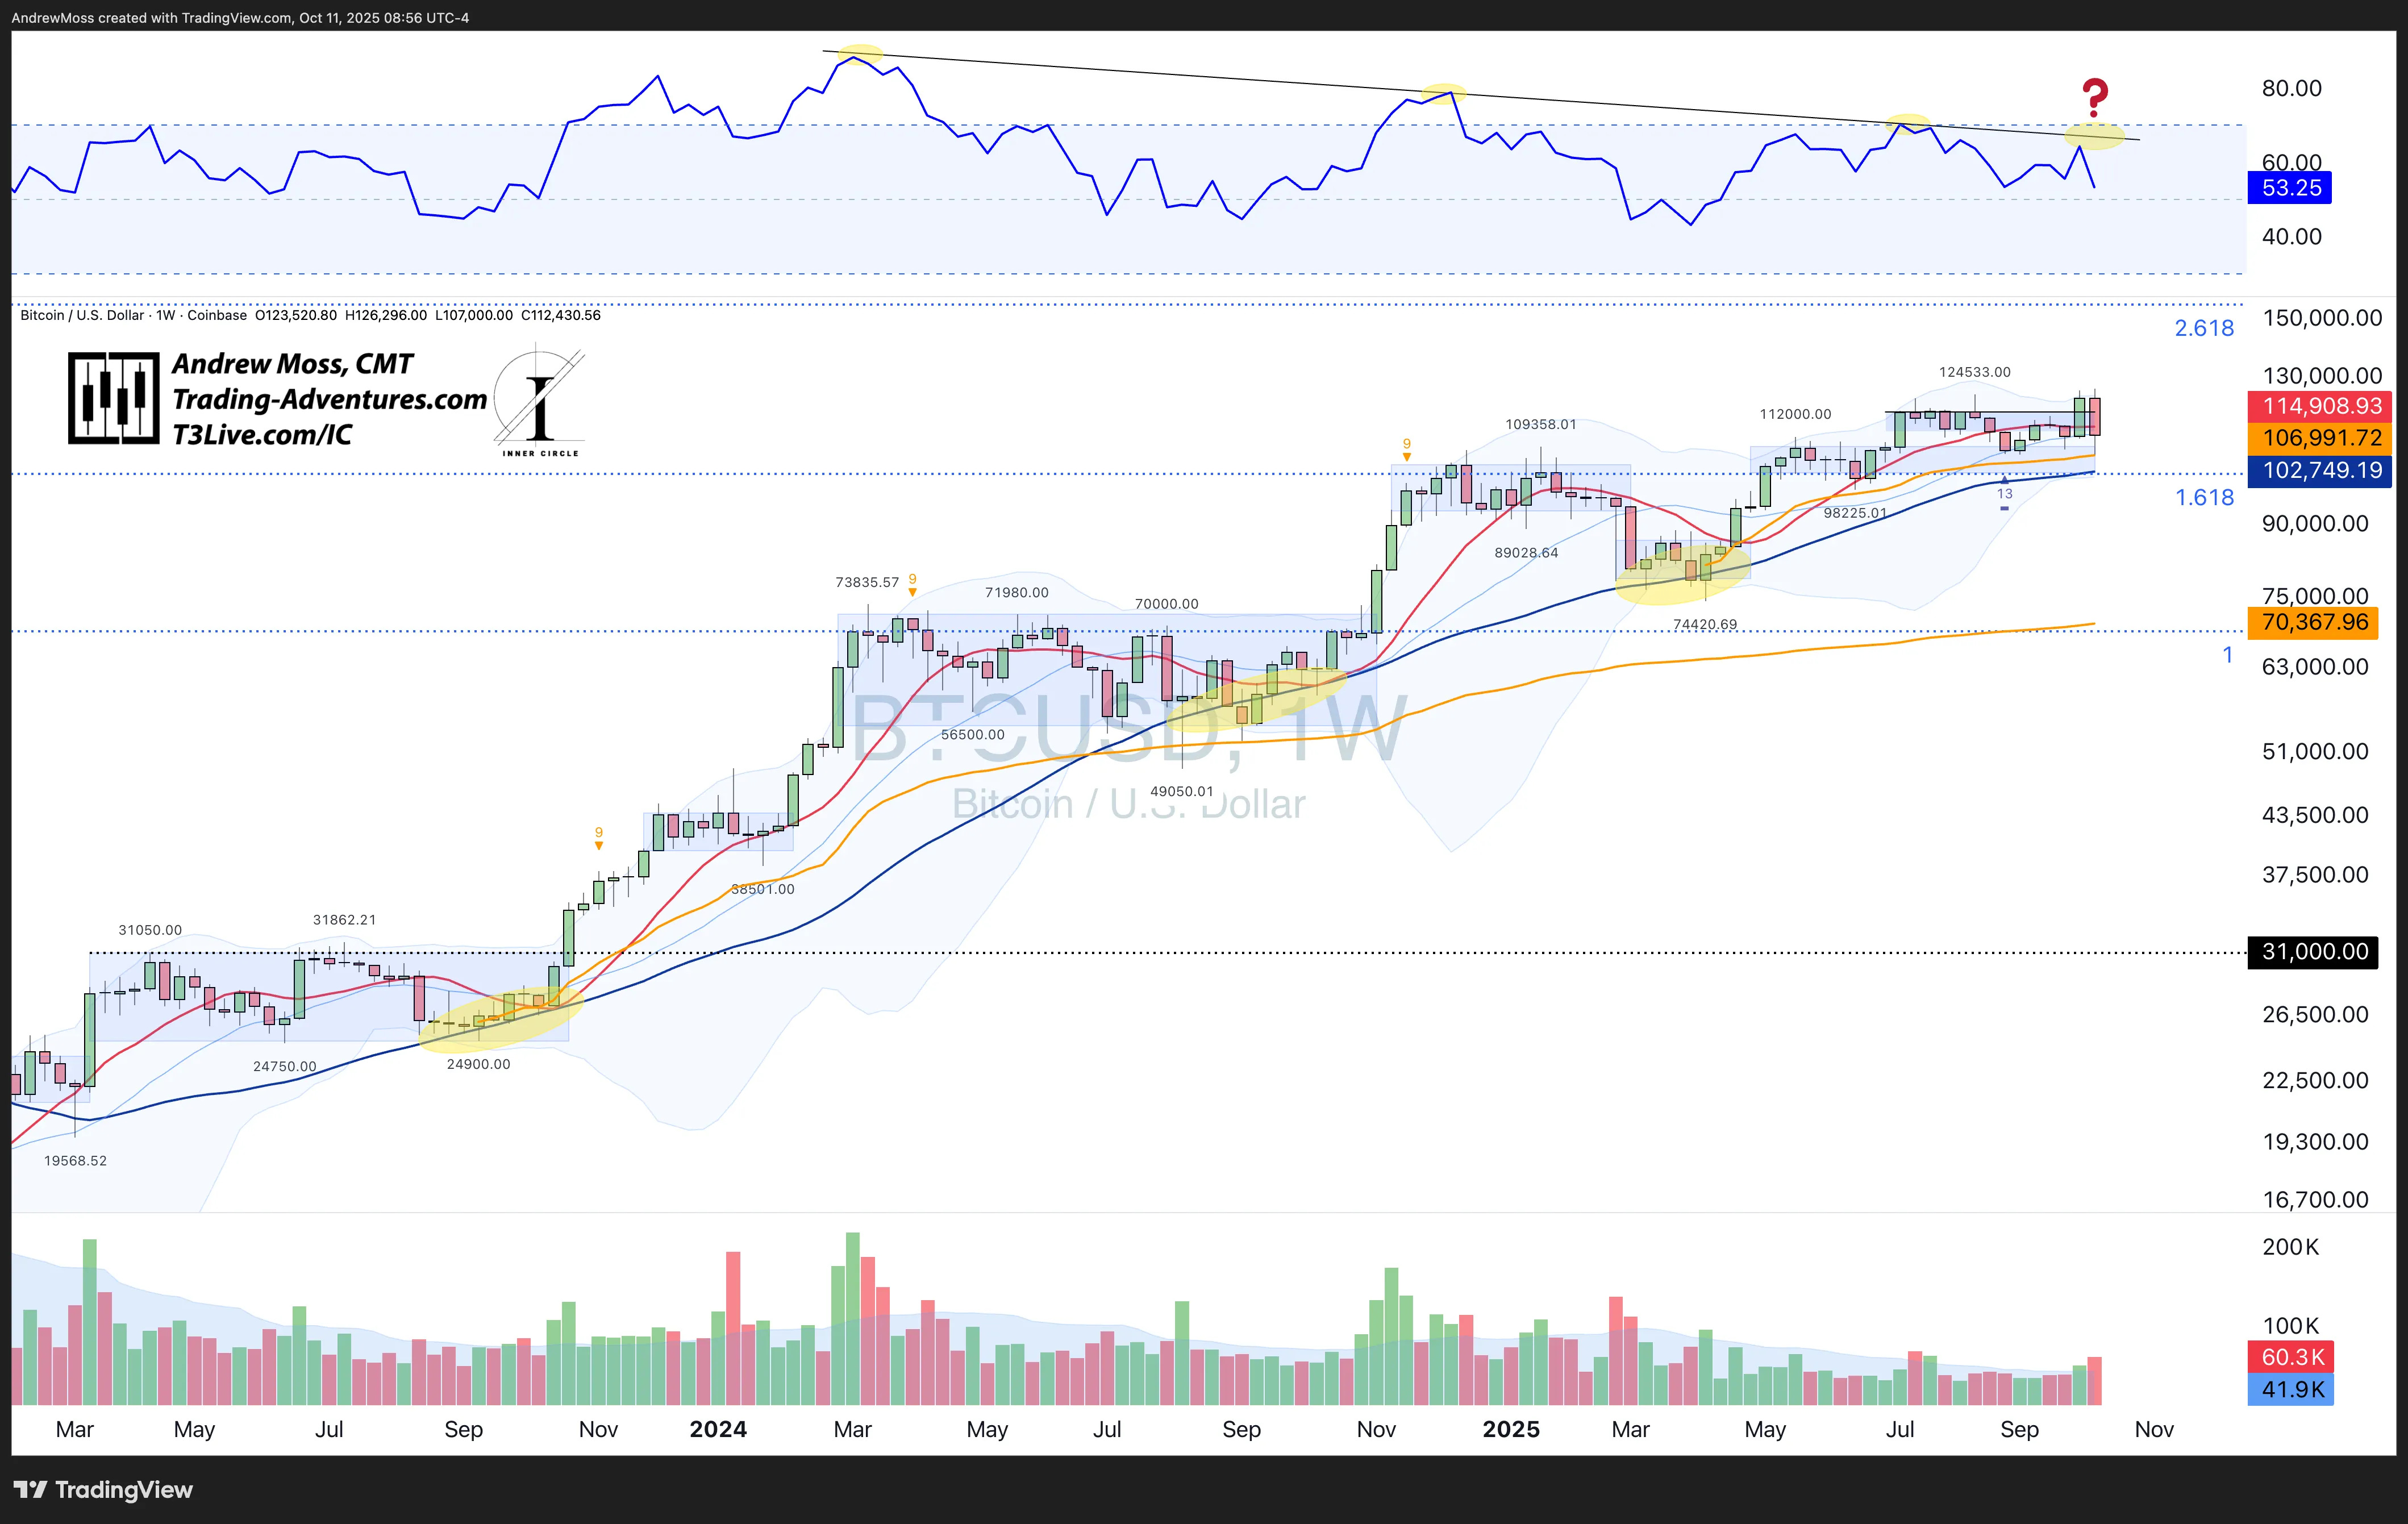
Bitcoin (BTC): Broke out and made a new ATH. But without a confirming move in RSI, price quickly failed, moving back down to the pivot‑low AVWAP🟠. Failed breakout? Or more of the chop and misdirection we’ve come to expect from the crypto leader? Time will tell.
Ethereum (ETH) - Looked promising early, with a move up and out of the flag pattern. But that soured quickly with a move back to the middle of the BBands. It is trying to hold the pivot‑low AVWAP🟠 for now. And RSI is still in the bullish upper half. Some trickery before the lasting move higher? Or a real signal of risk‑off behavior?

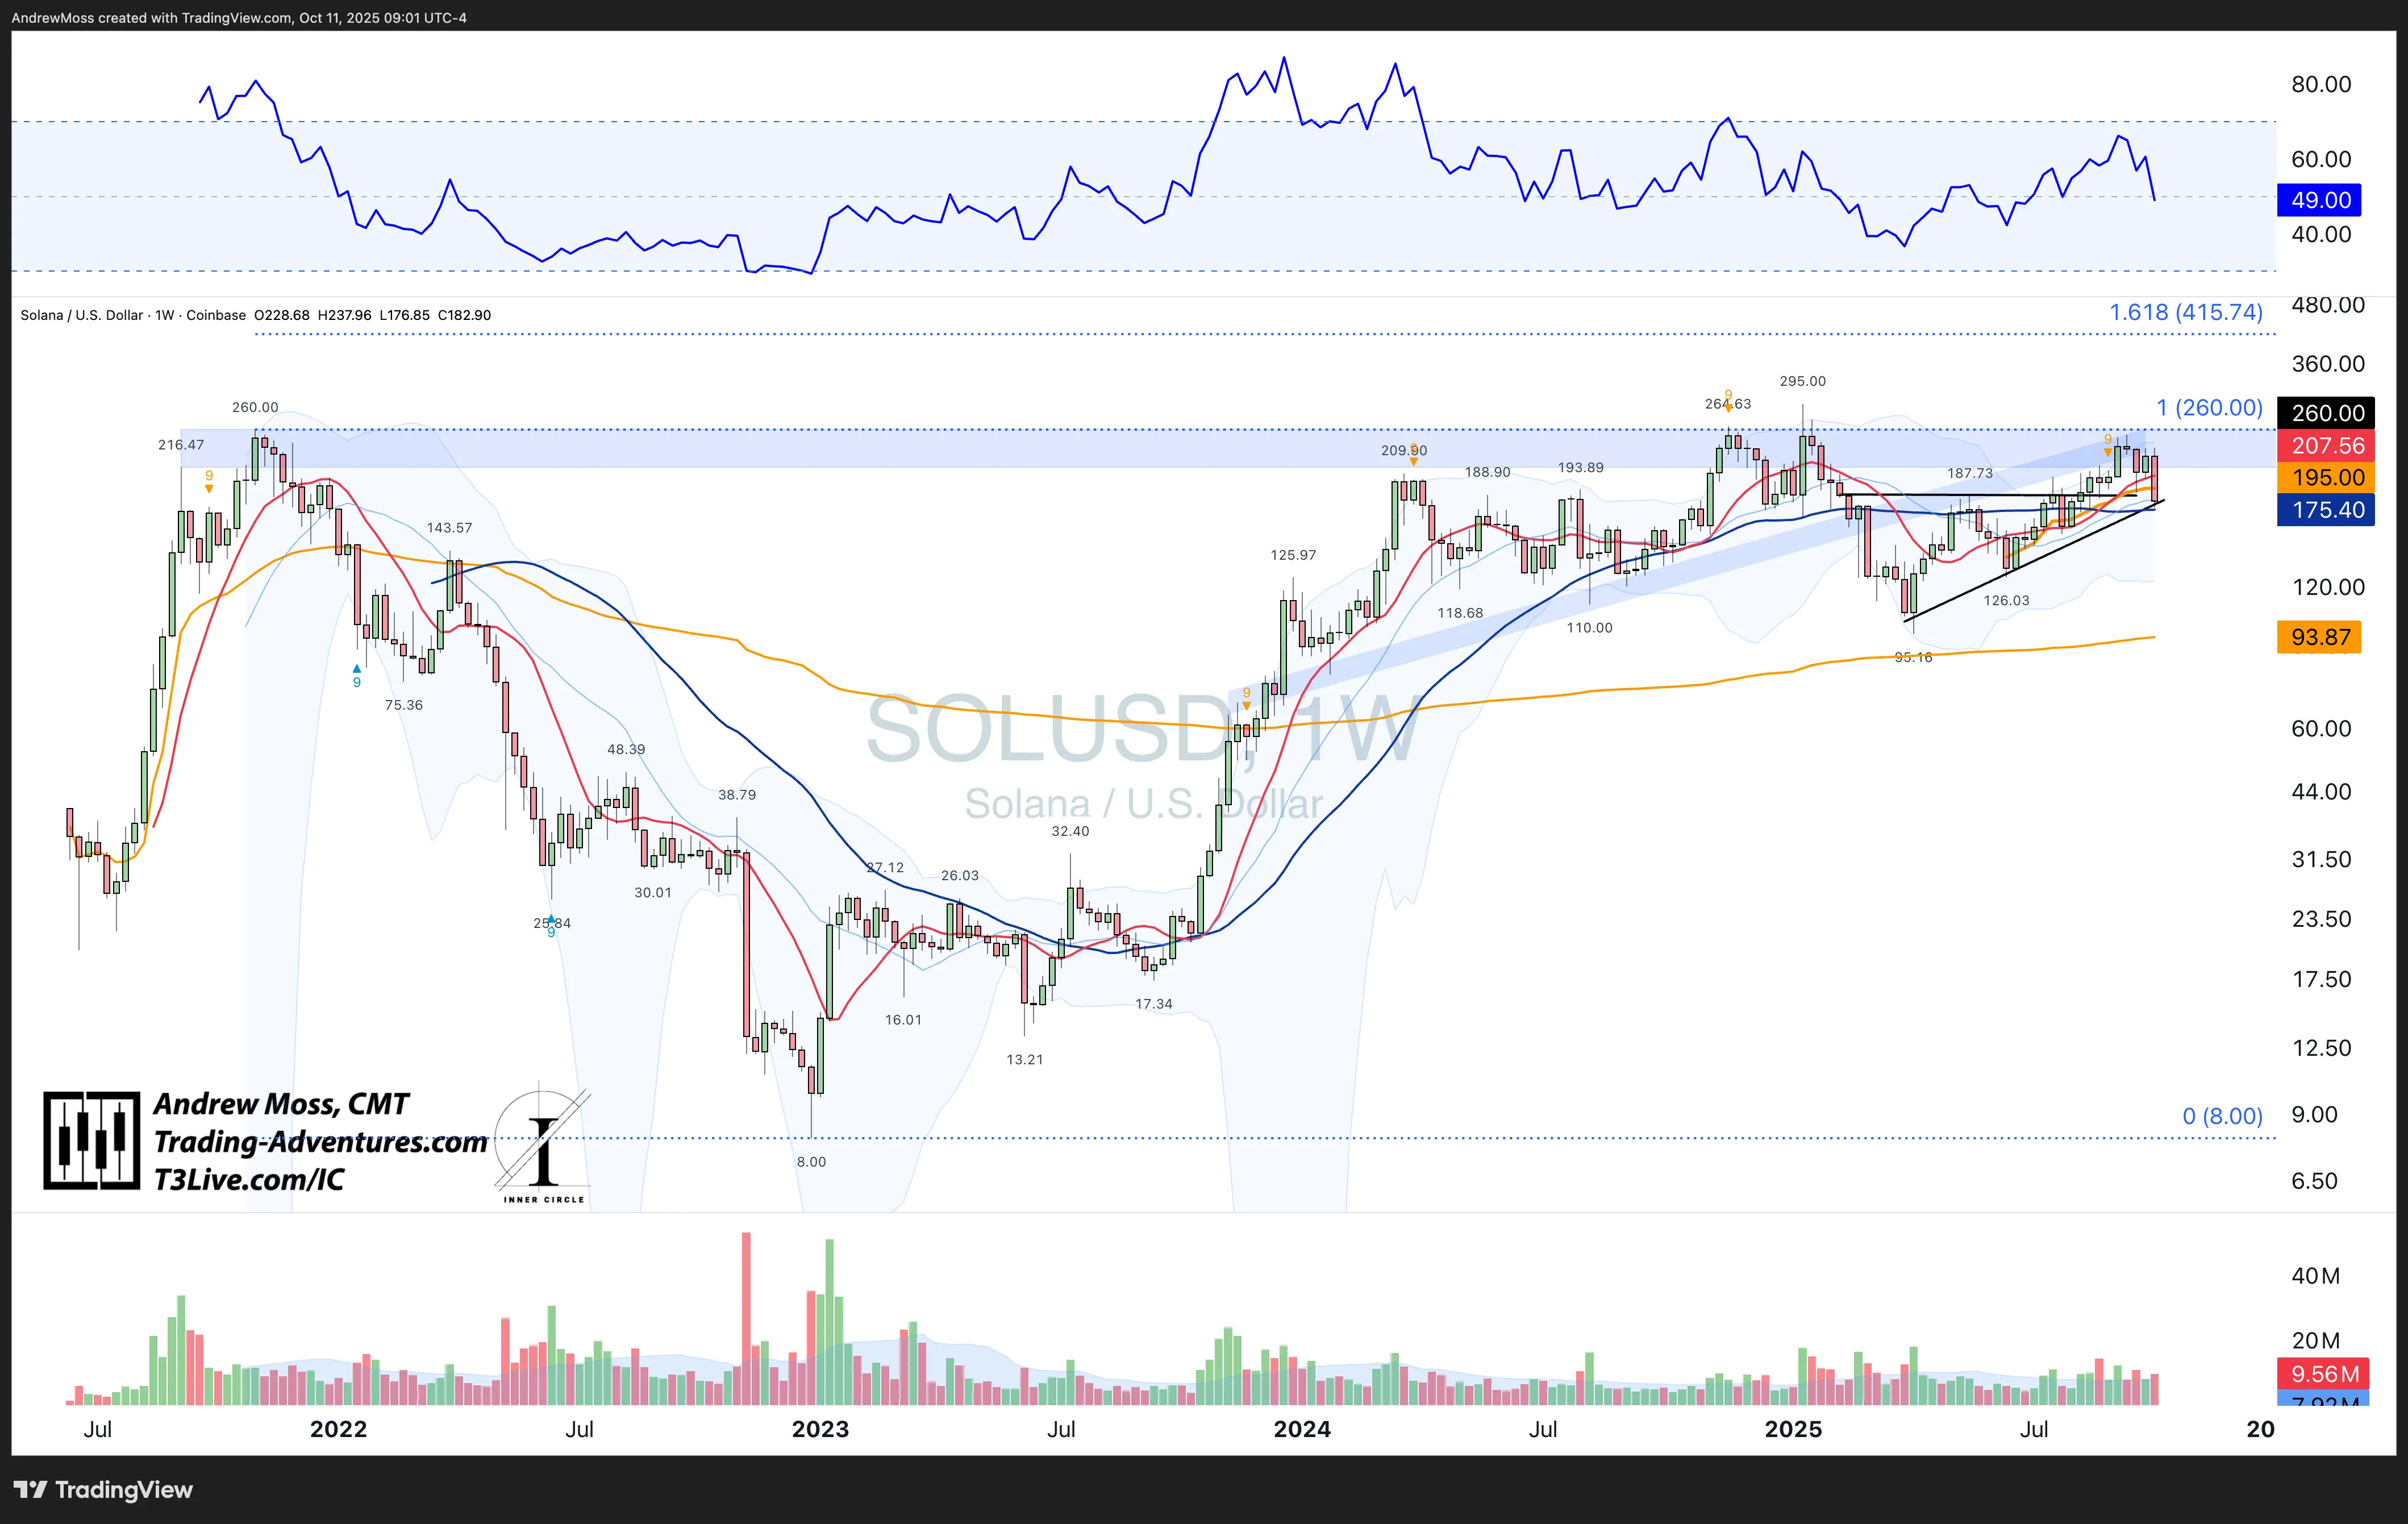
Solana (SOL) - Remains stuck — unable to move beyond $260. Now, can it hold the 40‑week MA and trendline while getting RSI back over 50?
🔁 Relative Strength & Participation
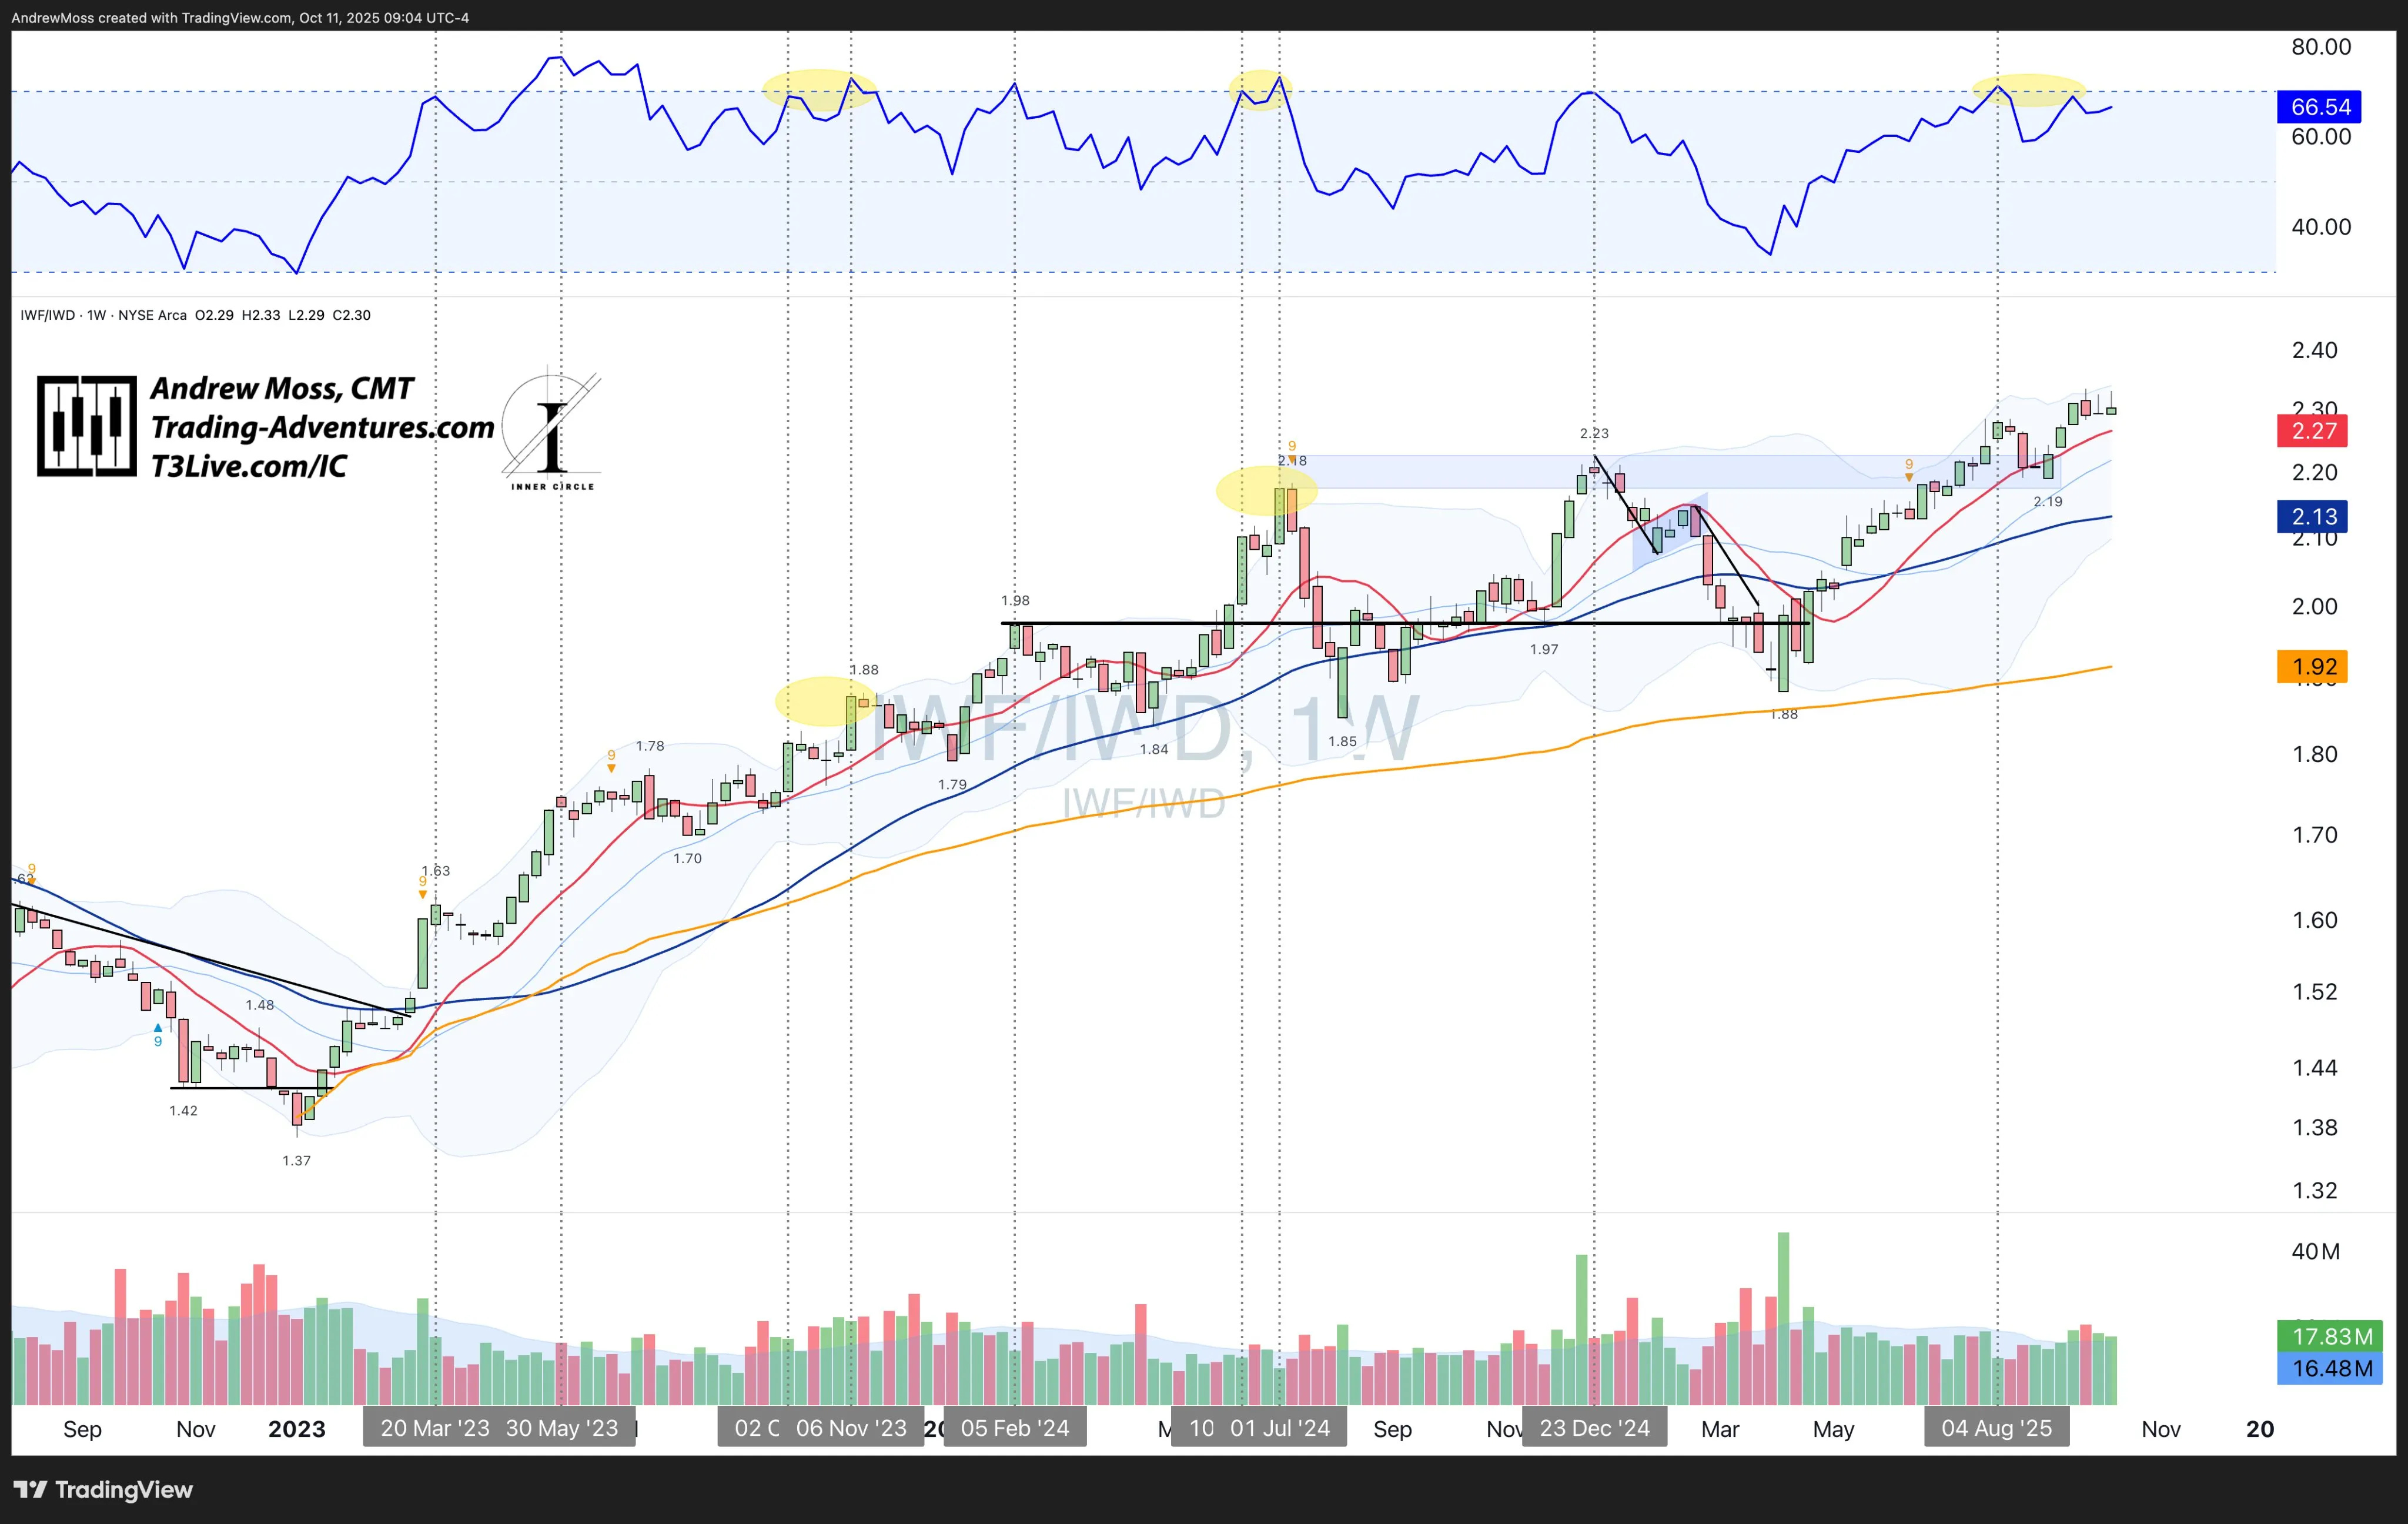
IWF / IWD - Still a positive week, but no real movement in either direction. So far, this just looks like a rest period.
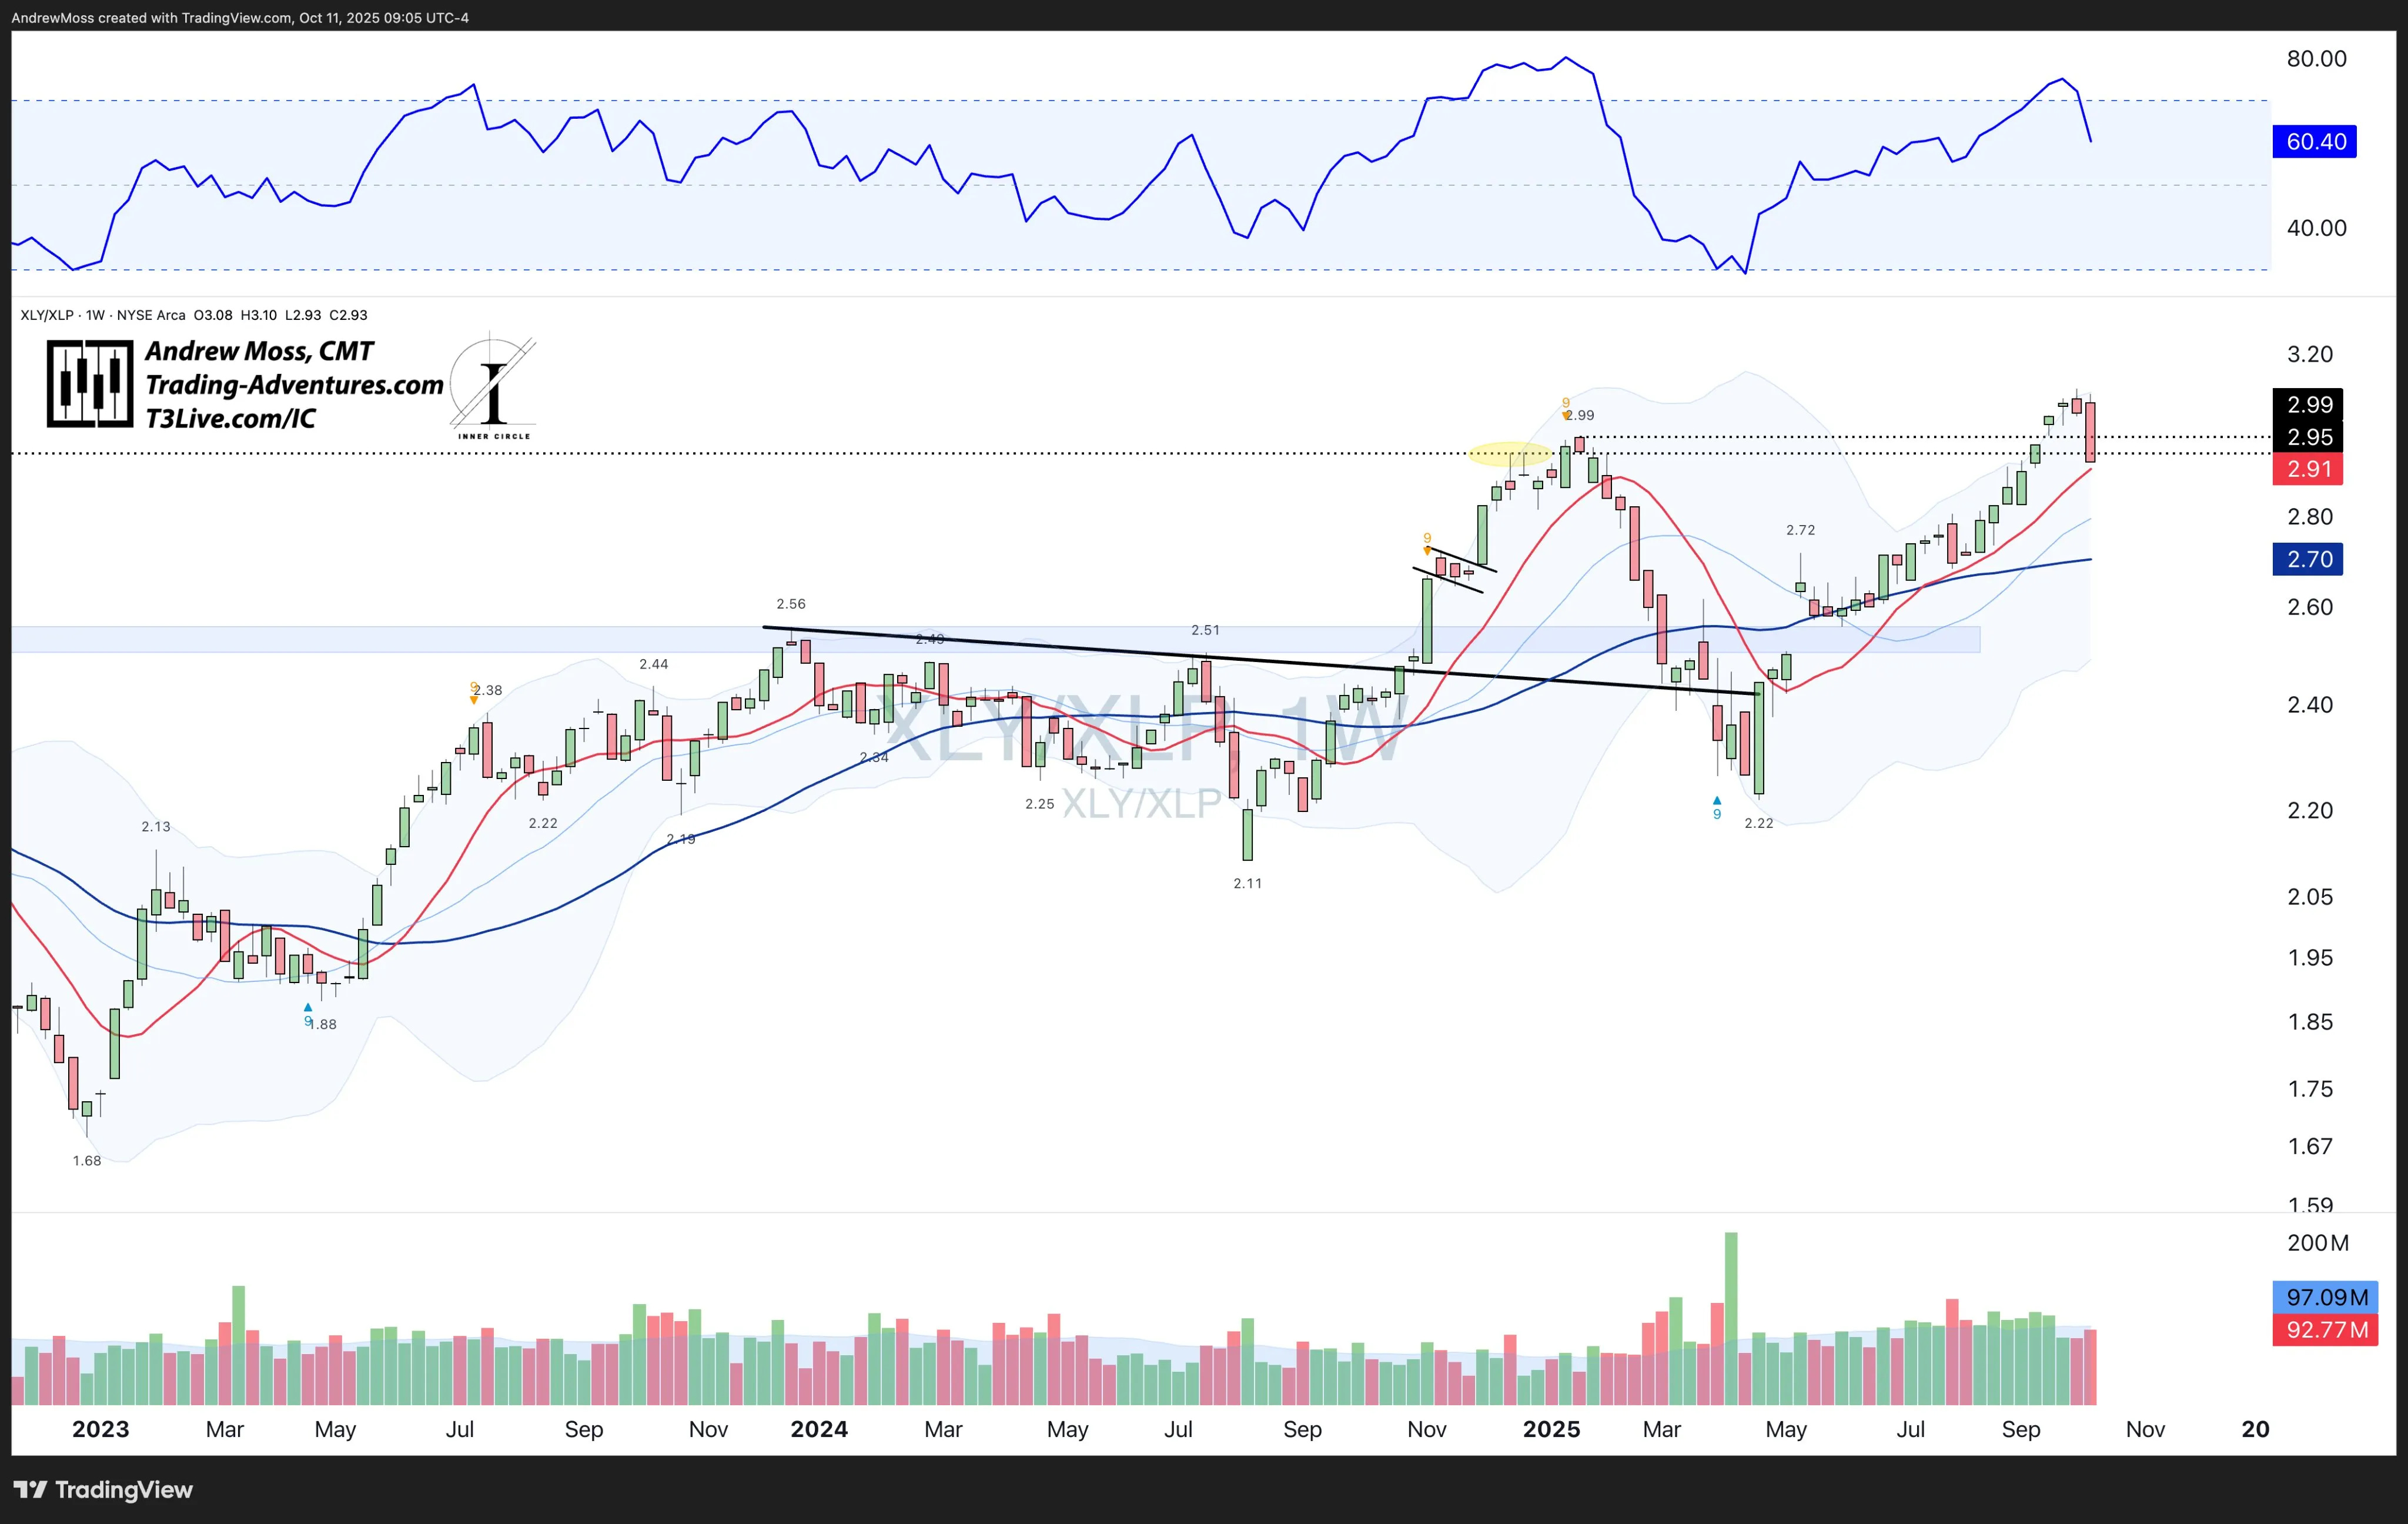
XLY / XLP - Notable shift toward the perceived safety of Consumer Staples.
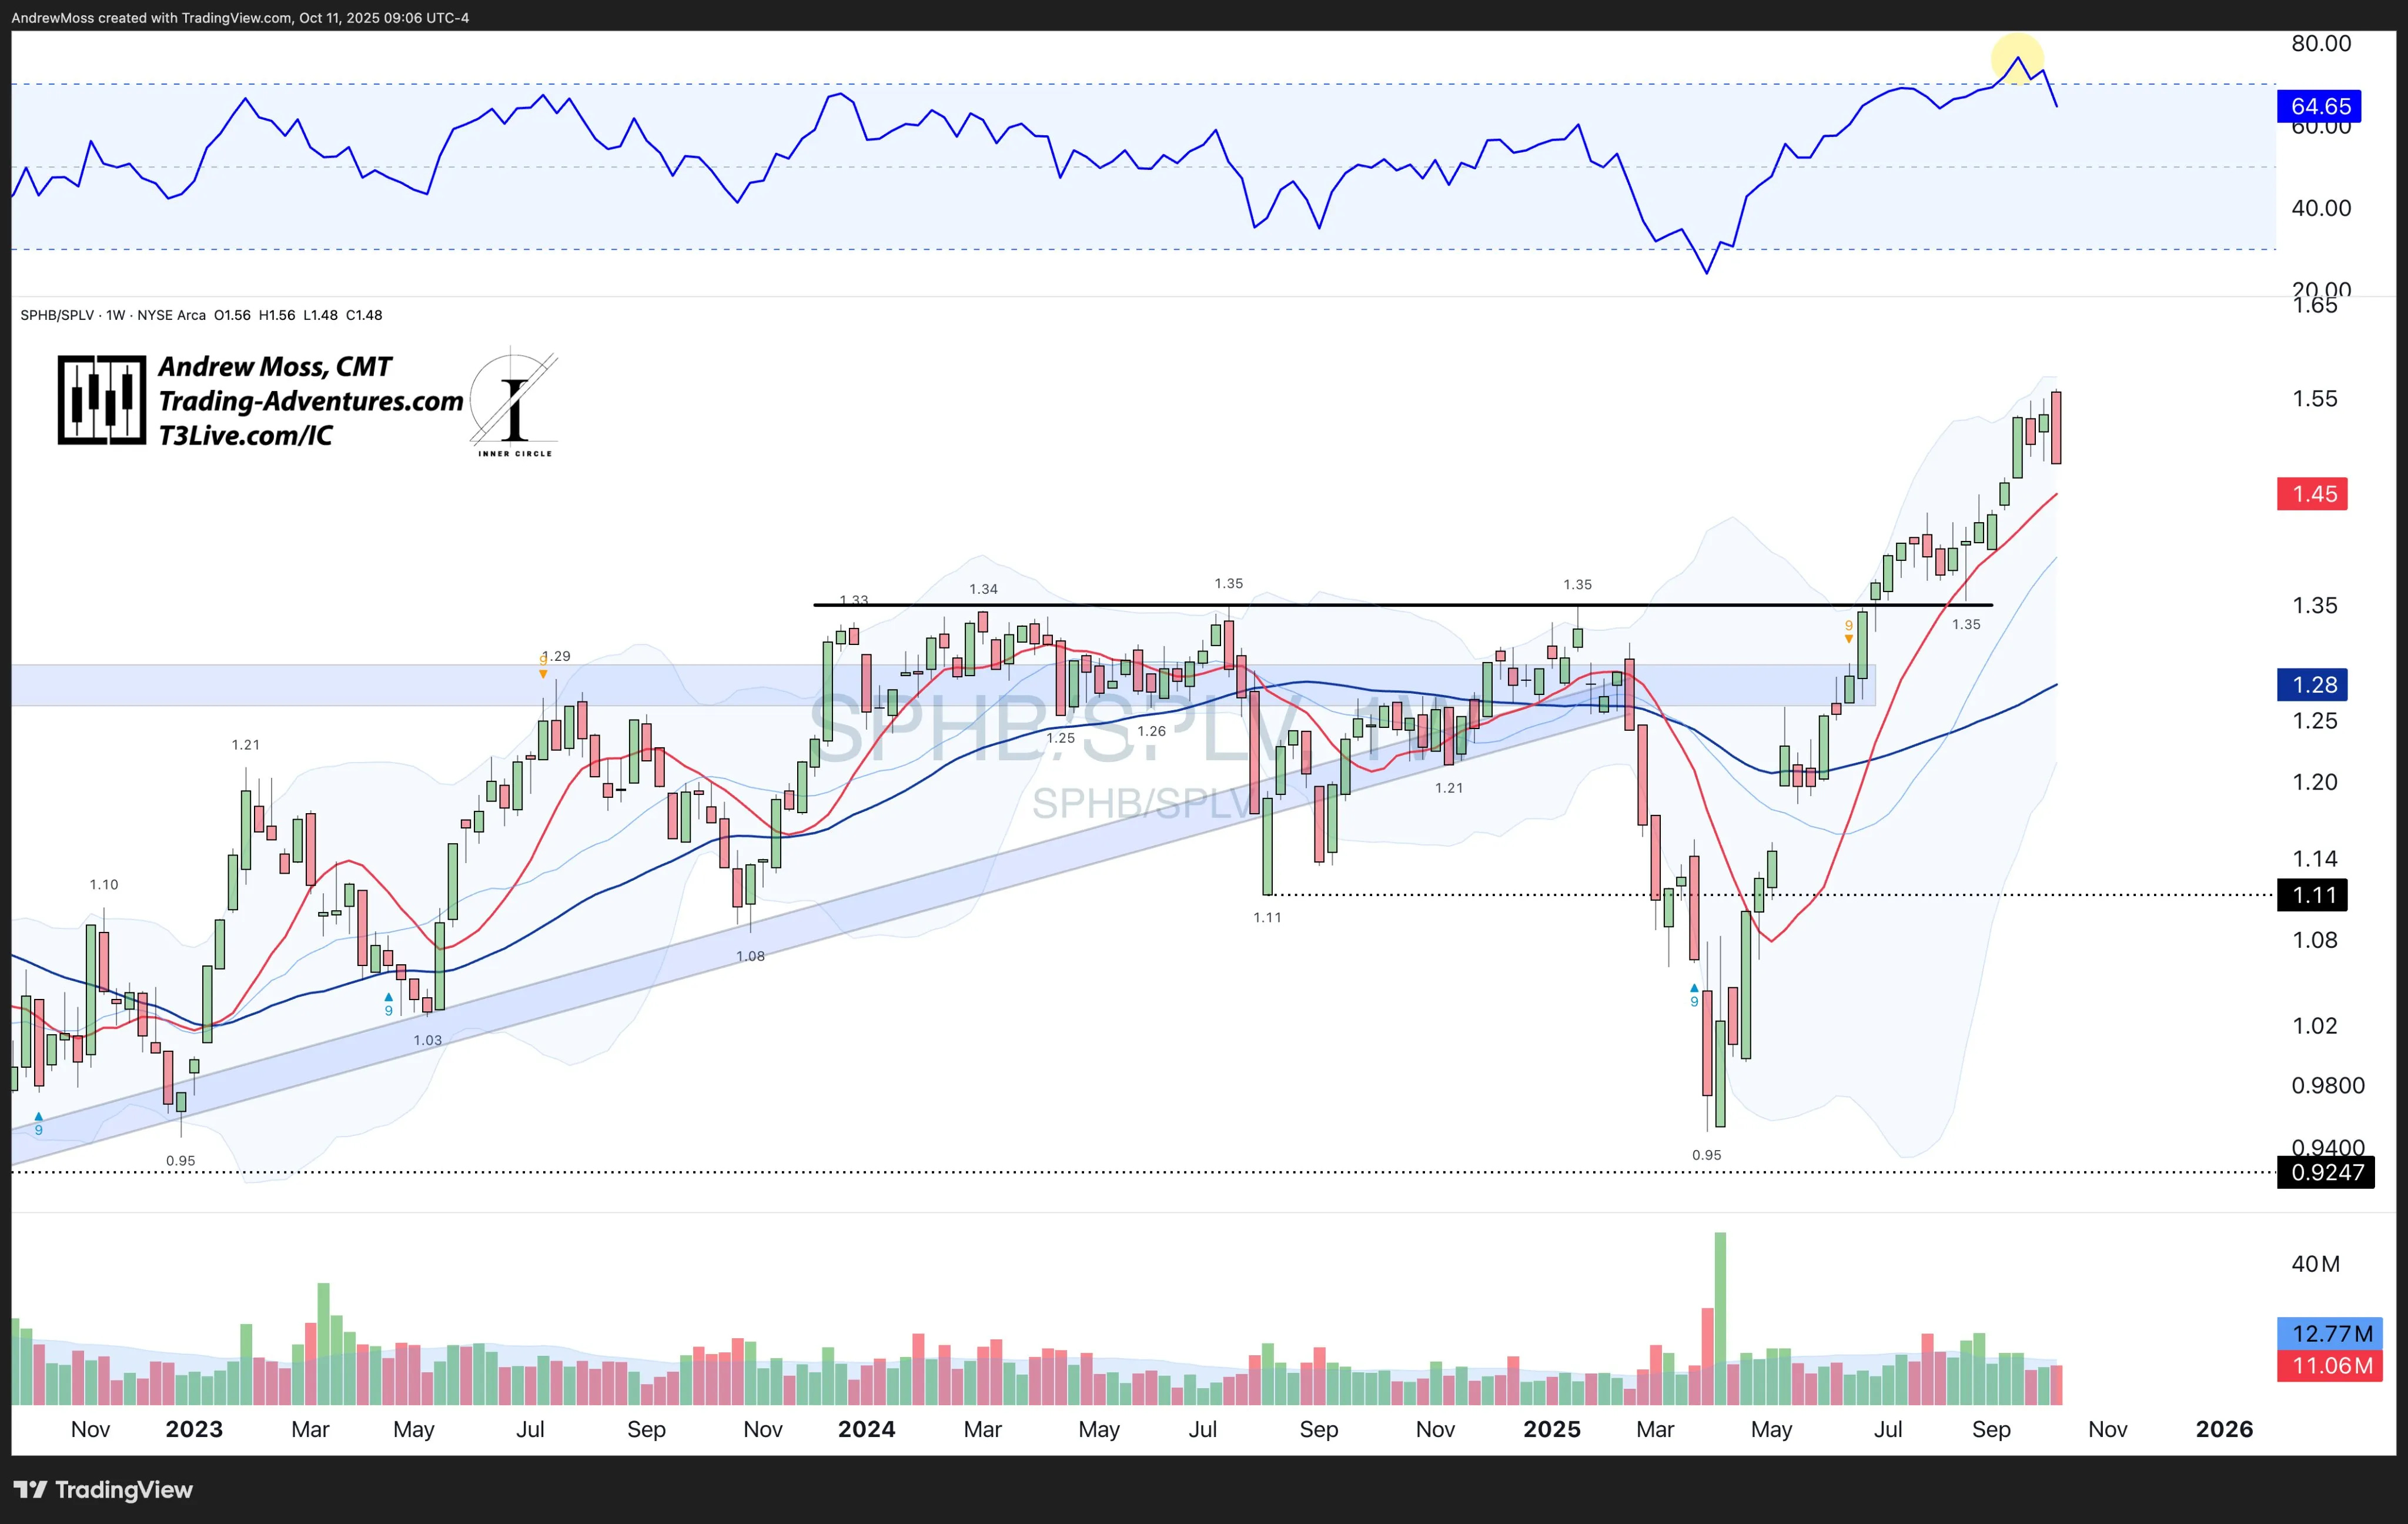
SPHB / SPLV — low volatility was the clear favorite over high‑beta this week.
Relative Strength — What Is It? (Really) in the new Chart School section.

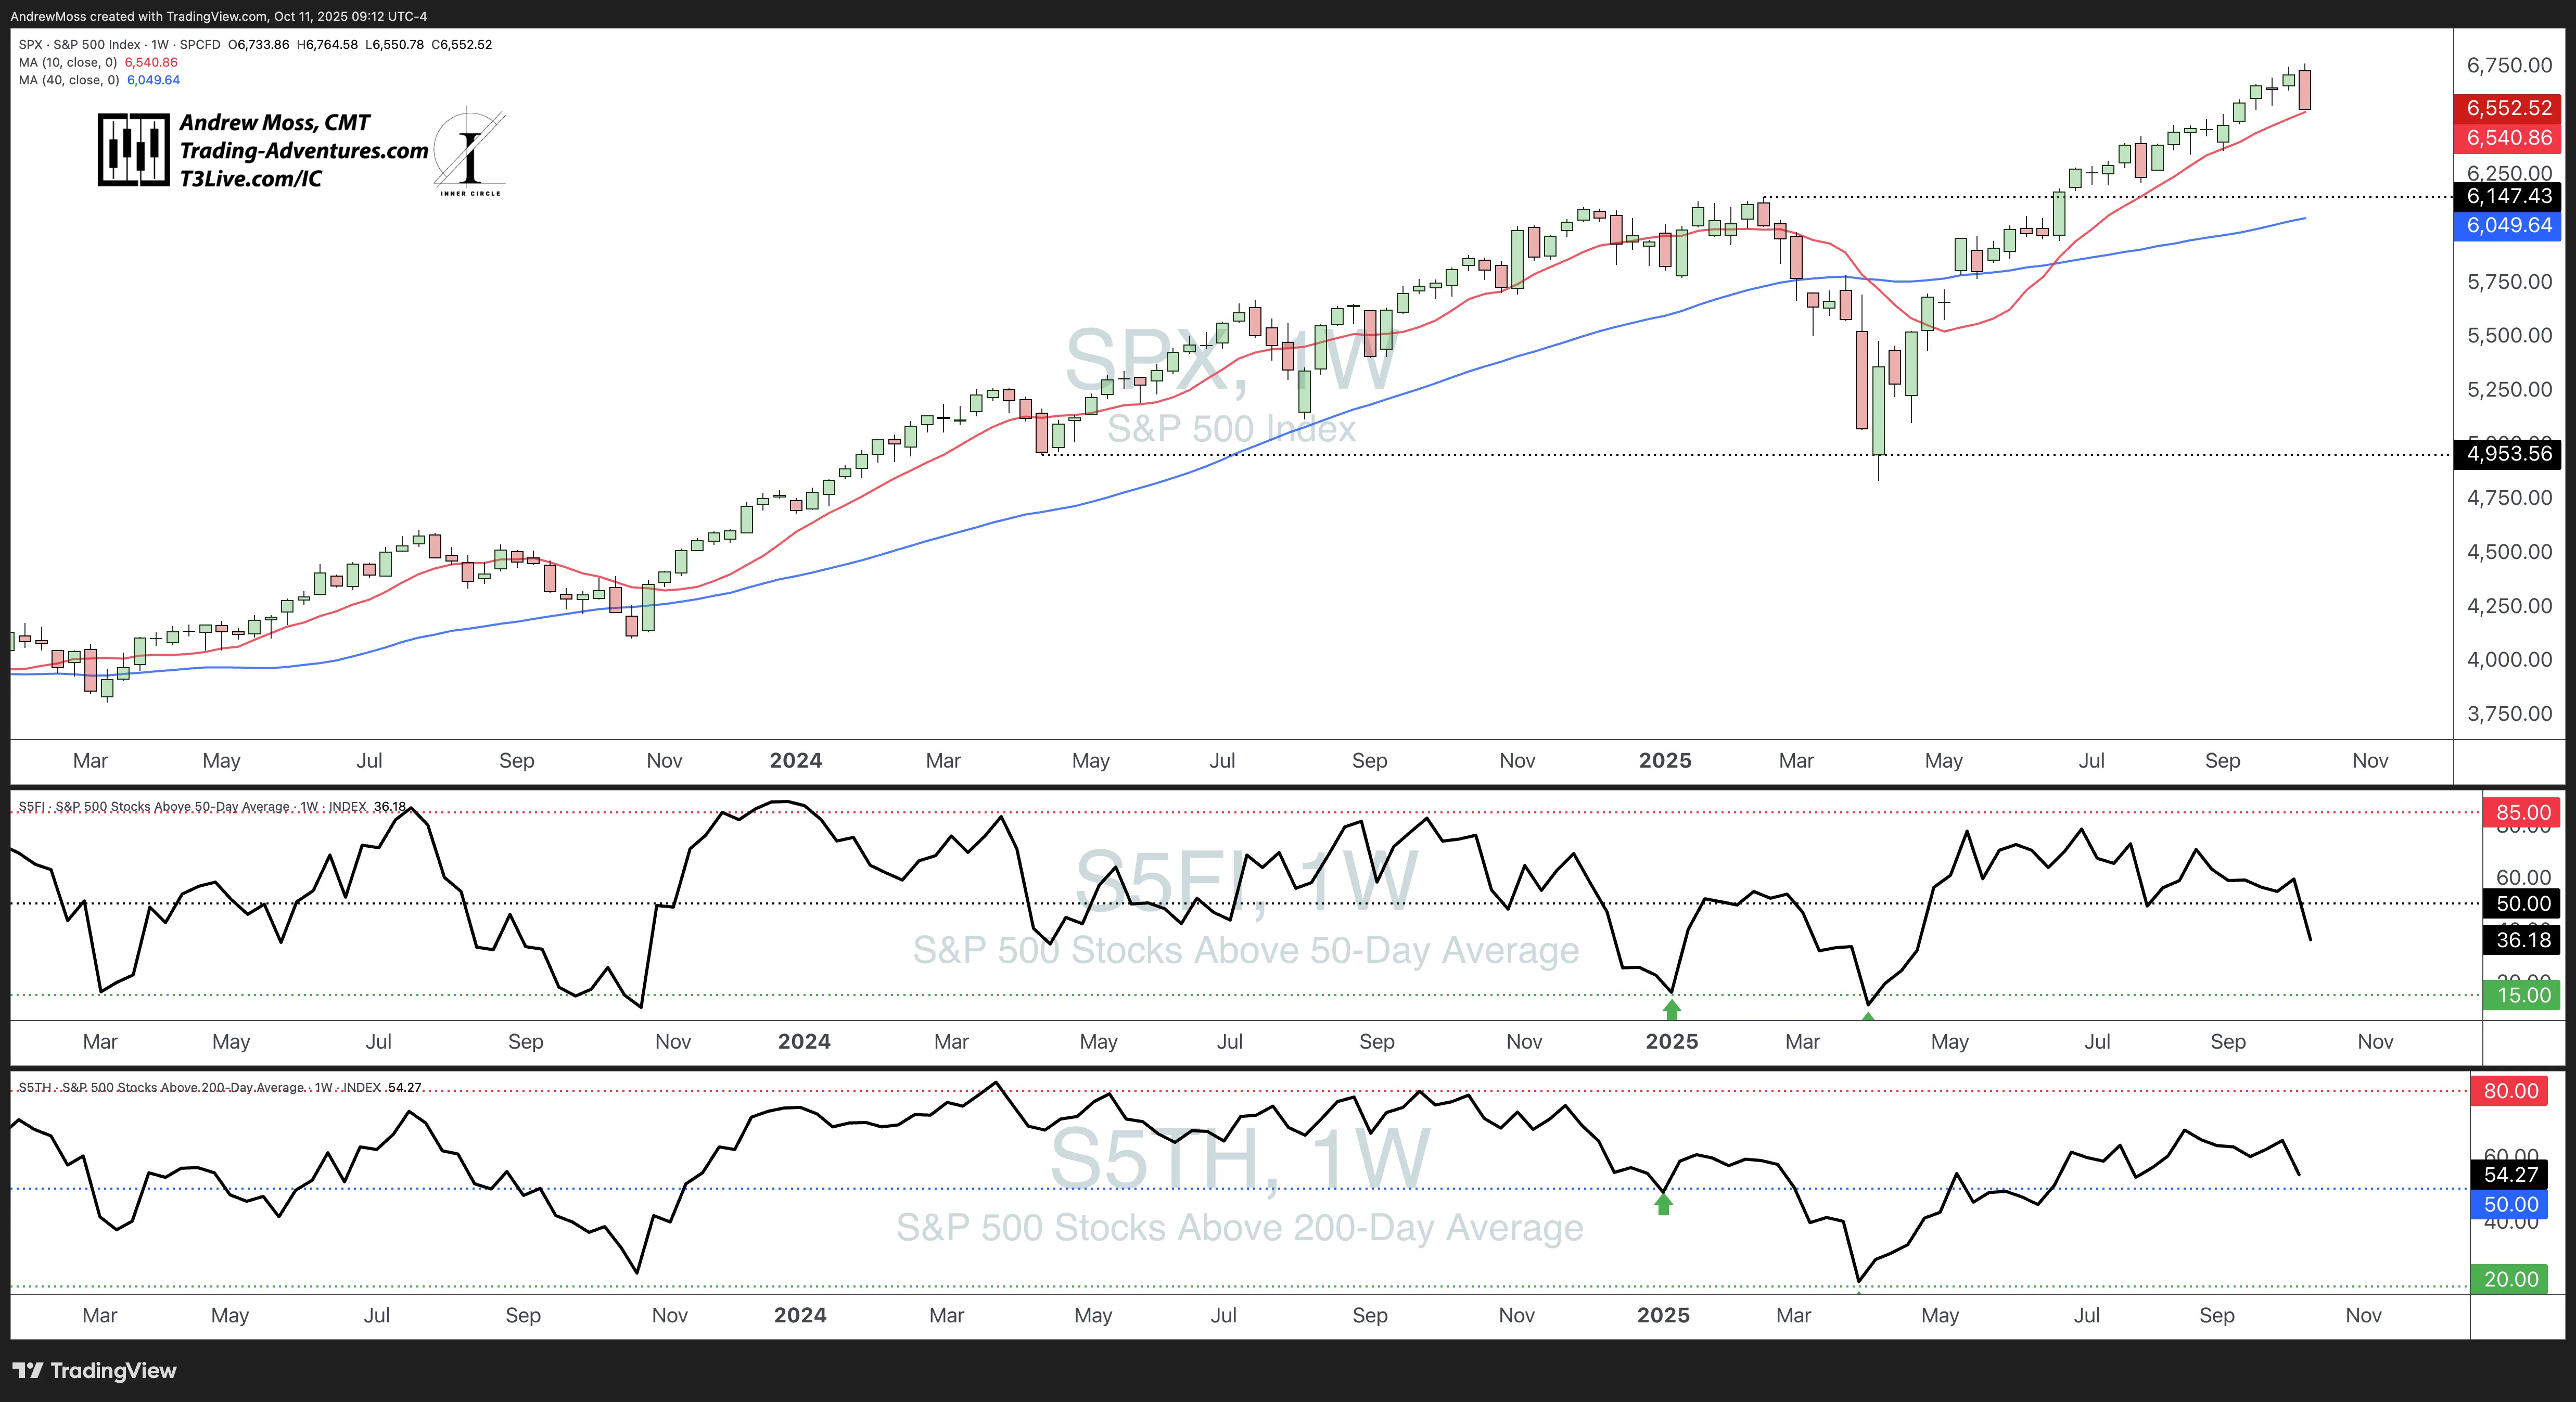
🧠 Breadth
% of SPX above a 50‑day MA dropped sharply, and still has plenty of room before a classic “washout.”
% above a 200‑day MA remains > 50.
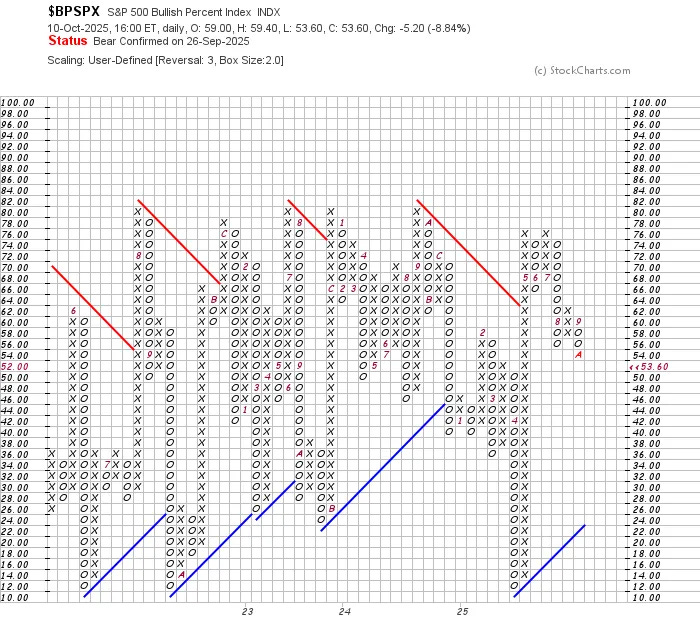
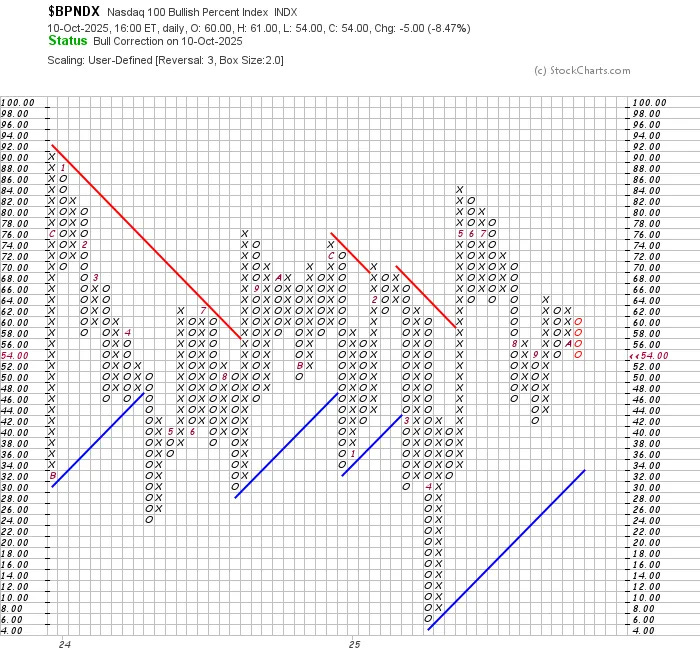
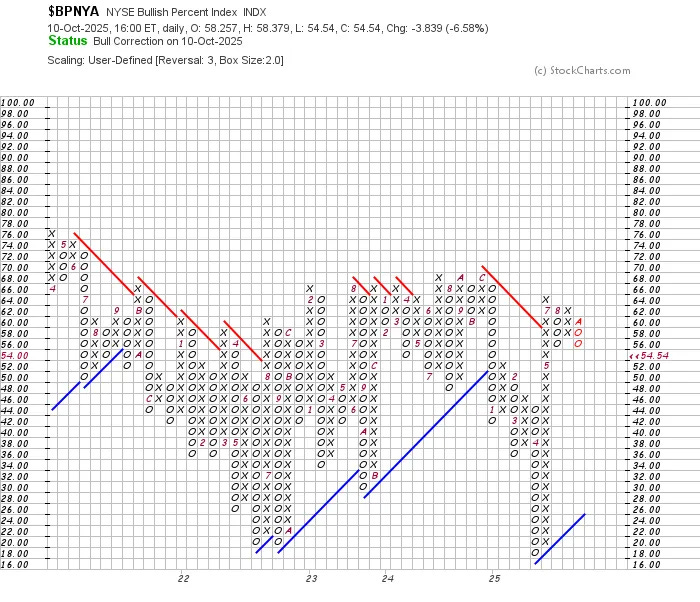
Bullish Percent Indices:
Read this for a refresher:

$BPSPX = Bear Confirmed
$BPNDX and $BPNYA = Bull Correction with minor pullbacks.
🧭 Now What?
Probably could’ve saved some time and just posted this one chart. 😂
VT — global equities pulled back to test their 50‑day MAs and pivot‑low AVWAPs🟠. That sums it up: this week was a synchronized test of trend support across nearly every major region and asset class.

Short‑Term
Markets are testing key support zones after a heavy‑volume reversal week.
Momentum cooled sharply, but not enough to trigger a full trend shift yet.
Volatility elevated — expect some chop as traders digest the move.

Medium‑Term
Broader trend remains intact — but participation is narrowing.
Defensive sectors and Treasuries are gaining traction, hinting at a maturing phase rather than full risk‑off.
If SPX, QQQ, and DIA stabilize near 10‑week MAs and pivot AVWAPs, that could set a base into year‑end.
Watch breadth for confirmation.
Long‑Term
Structural uptrend across global markets still alive.
Inflation and rates trending favorably.
Weekly momentum divergences (MAGS, SPX) bear watching; can resolve through time as much as price.
🗓 The Week Ahead
Plenty of catalysts on deck — and plenty of uncertainty about whether we’ll even get the data. The government shutdown could delay key U.S. releases like CPI, PPI, Jobless Claims, Retail Sales, and NFP.
That alone could add some headline-driven volatility.
Monday: Construction Spending — light start to the week.
Tuesday: Powell speaks and earnings season officially kicks off with the big banks. Expect positioning ahead of JPM, WFC, and GS reports.
Wednesday: CPI — if it prints, it’s the week’s biggest event. Watch how rates and TLT react.
Thursday: PPI, Retail Sales, and Jobless Claims — potential confirmation or contradiction to CPI trends.
Friday: Nonfarm Payrolls — still the ultimate test for risk sentiment, assuming the data hits on time.
Globally, we’ll also get Germany CPI and Eurozone inflation, which could influence rate expectations and FX.

Bottom line:
This week marks a transition — from technical tests to macro confirmation. With volatility elevated and earnings ramping up, the next few sessions should clarify whether last week’s reversal was a shakeout or the start of something more defensive.
🧠 Final Thought
Markets don’t move in straight lines — and this week was a reminder of that.
A pullback after an extended run isn’t inherently bearish; it’s often how longer trends reset and strengthen. Volatility can be uncomfortable, but it’s also information. It tells us where conviction fades, and where opportunity might begin to build again. The key now is to watch reaction over direction — how price behaves at these support levels will say more than any single headline or data point.
Stay objective, stay patient, and keep your timeframes aligned with your plan.
🙌 Thanks for Reading
Thank you all for reading and spending some time with me on a Saturday morning!
For a deeper dive, check out the new Chart School section — lessons on breadth, relative strength, AVWAP, and more.
If you found this week’s charts helpful, please -
📤 Share
💬 Comment
♻️ and Repost
It helps more traders see the work and join the discussion.
Also, consider supporting with a paid subscription to keep them coming.
All posts remain public — no locked content. Just charts, signals, and steady updates to help you trade with confidence.
—Andy
Looking For More?
Elevate Your Trading Adventure Even Further With These Offerings.

The Disclosures
***This is NOT financial advice. This is NOT a recommendation to buy, sell, or trade any security. The content presented here is intended for educational purposes only.