📈Weekly Charts📉 October 18, 2025
Good morning ☕
Another busy week of price discovery as the major indexes worked to recover and find direction. Volatility spiked, then cooled. The week brought solid repair efforts and a few important technical developments across markets.
Let’s zoom out and take a look at the Weekly Charts for perspective.
Reminder: click on the first chart to open a bigger view. Then use your arrows keys to scroll through all the images.😉
📊 U.S. Indexes
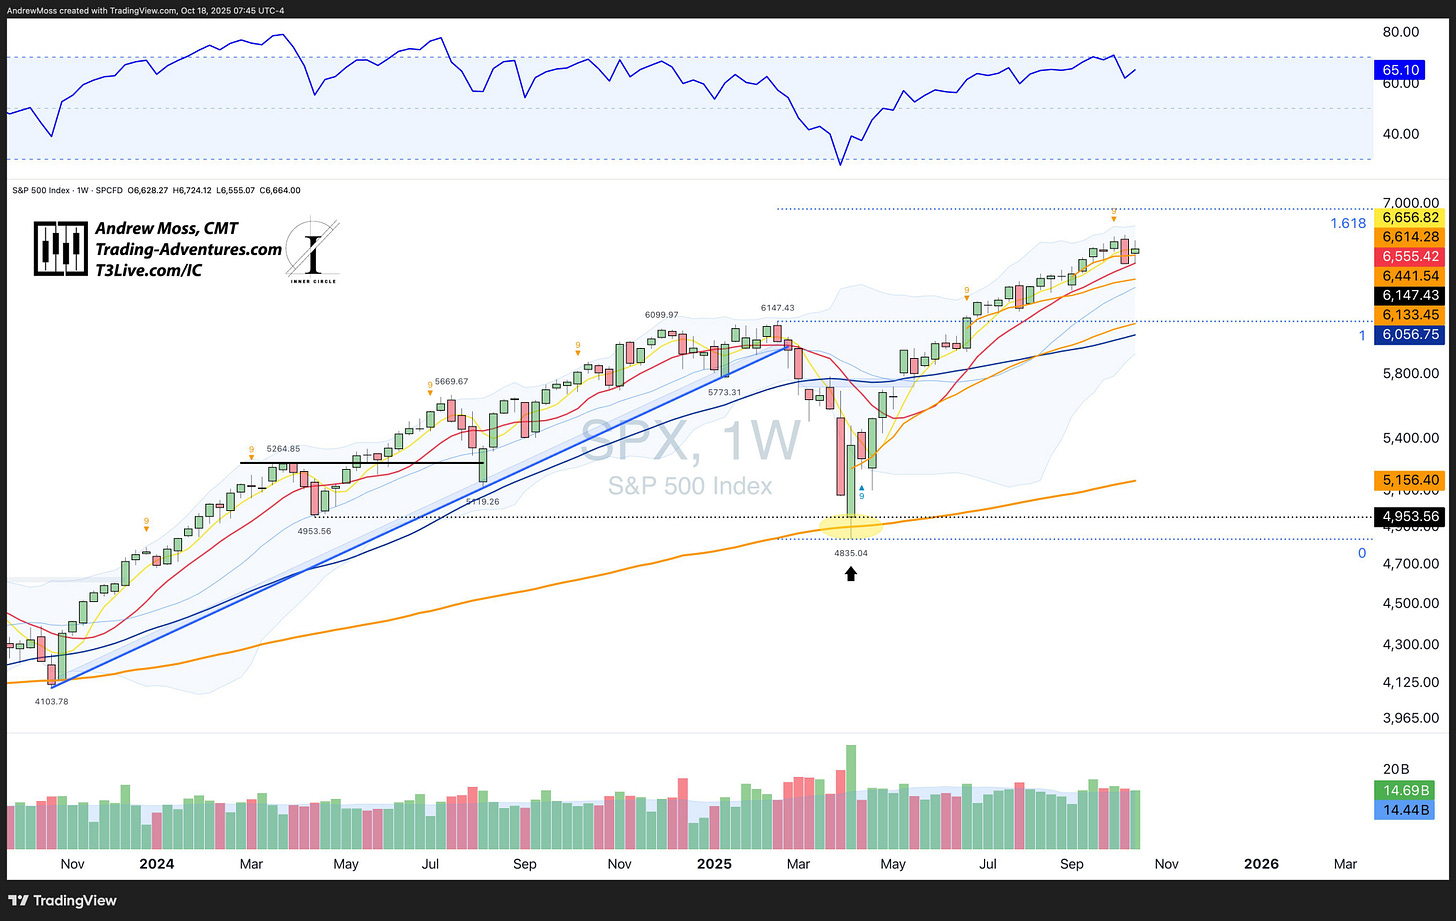
S&P 500 (SPX)
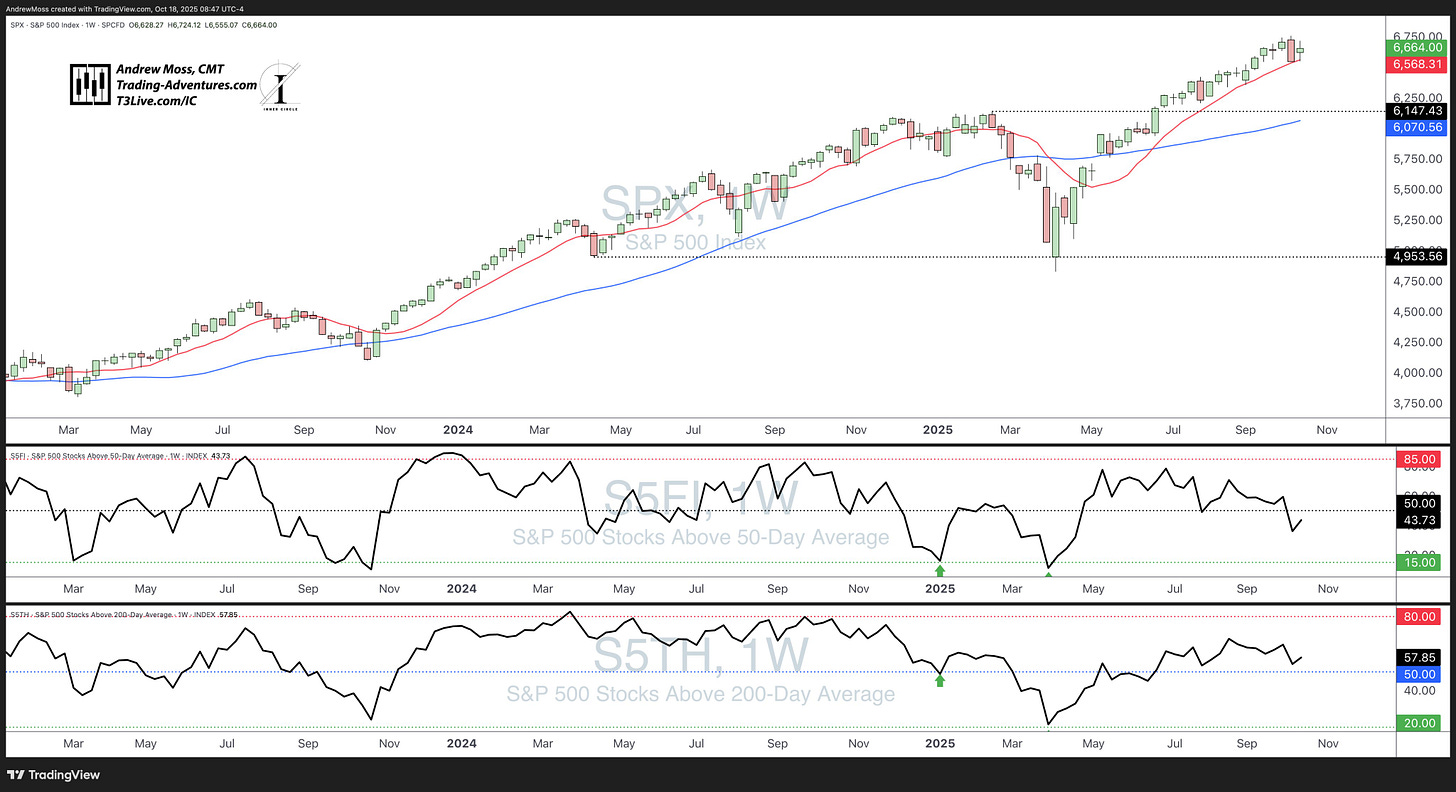
The SPX tapped its 10-week moving average early in the week, bounced, and closed above both the new 4-week moving average and the anchored VWAP from its last 10-week test.
Still mid-range but holding firm.
Volume came in right around the 20-week average.
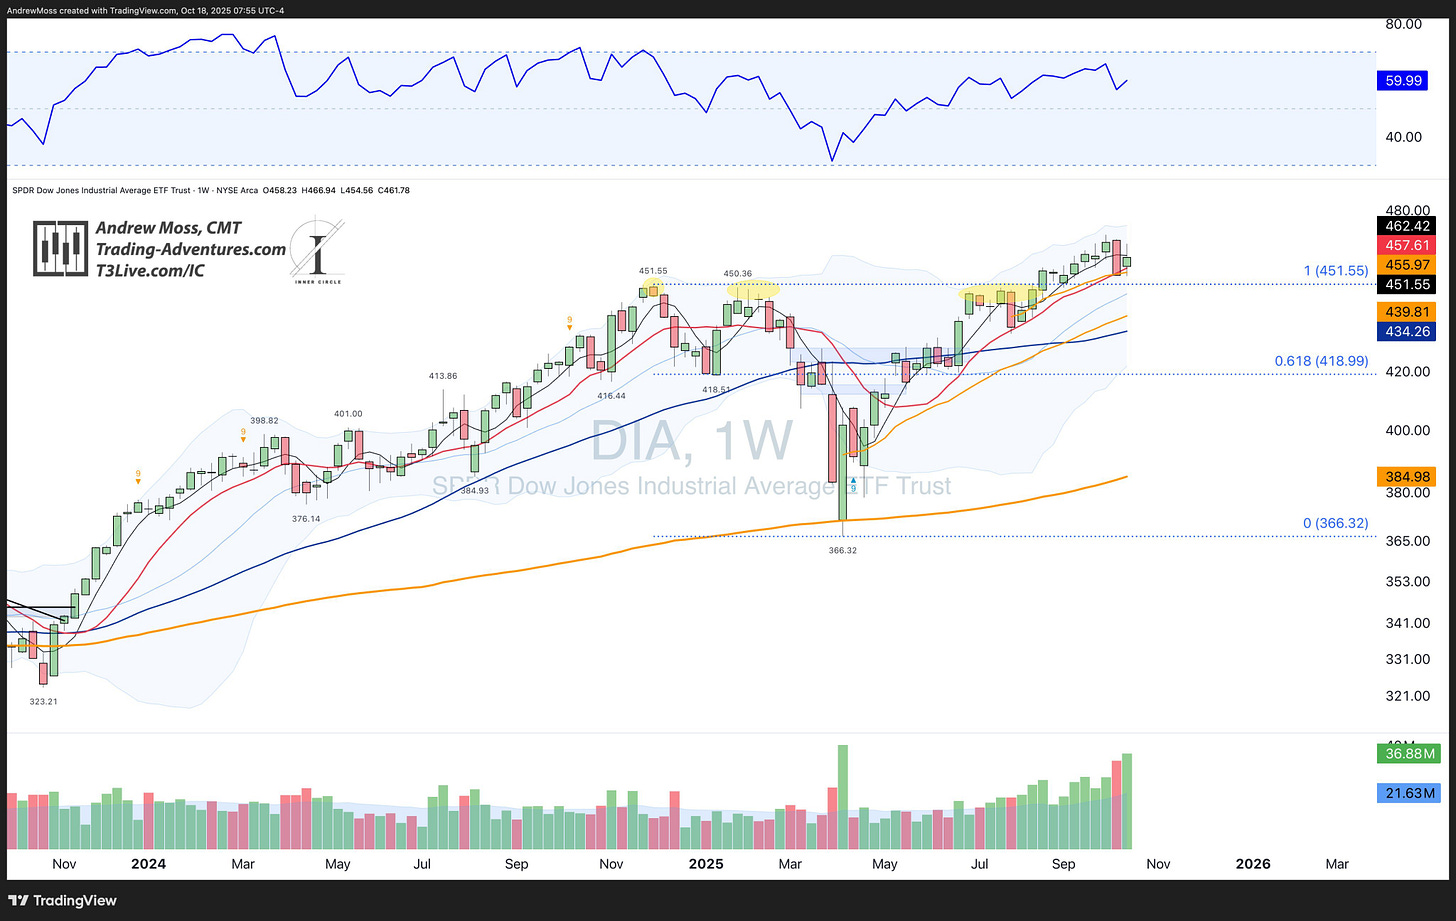
Dow Jones (DIA)
More of the same—steady but uninspiring. The index continues to hug both the 4- and 10-week moving averages.
Volume was very heavy this week.
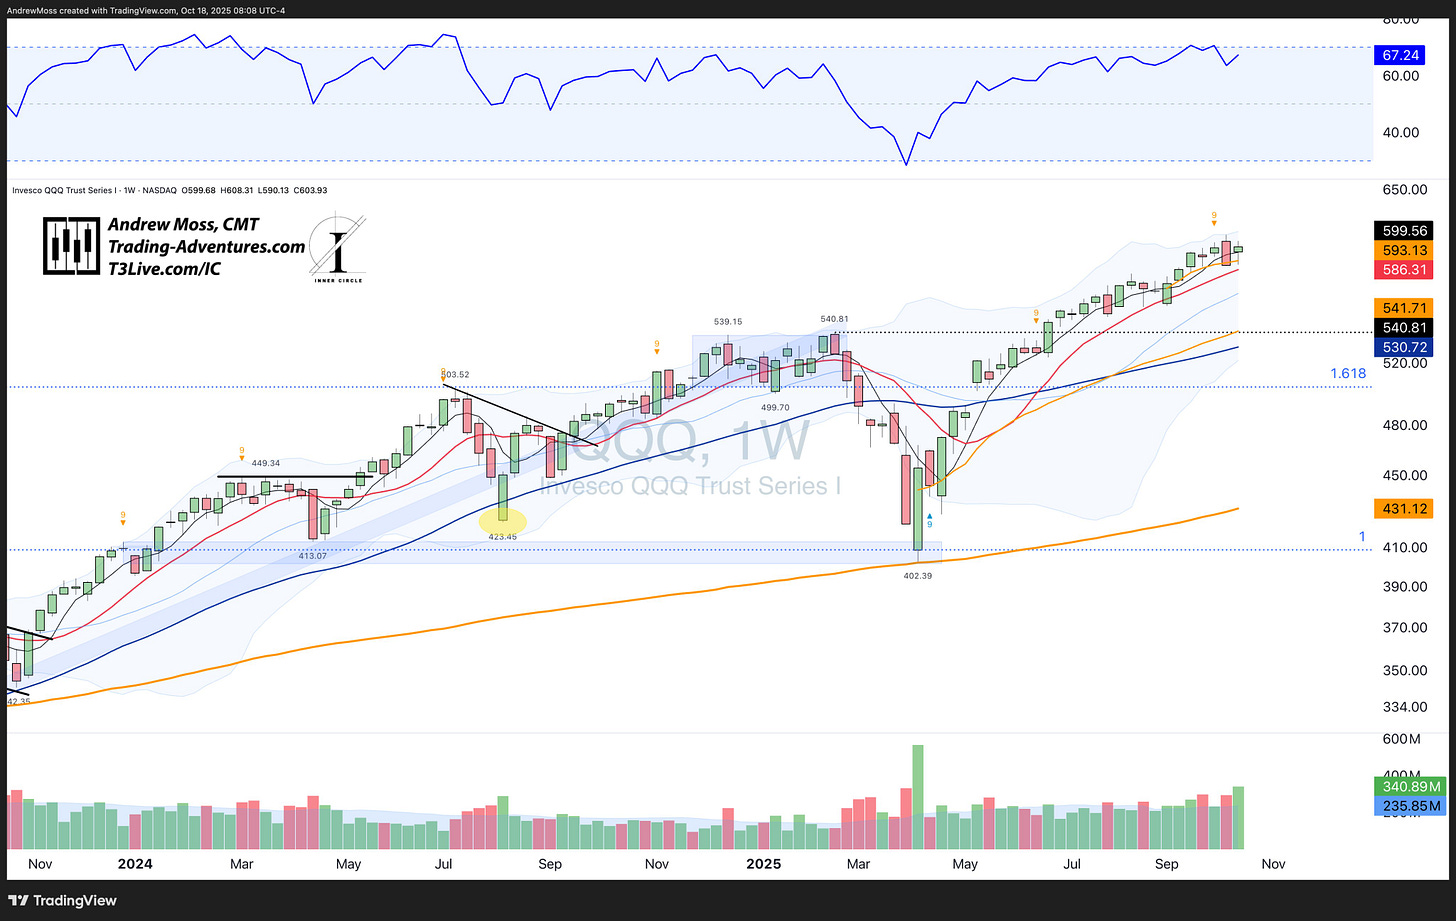
Nasdaq 100 (QQQ)
QQQ closed the week at a new all-time high—by about 75 cents. It traded higher early, reversed, and finished strong.
Volume was slightly heavier than average.
Quick note: the new 4-week moving average (thin black line) roughly equates to a 20-day MA and gives a cleaner short-term read on weekly charts.
🌍 Small Caps & International
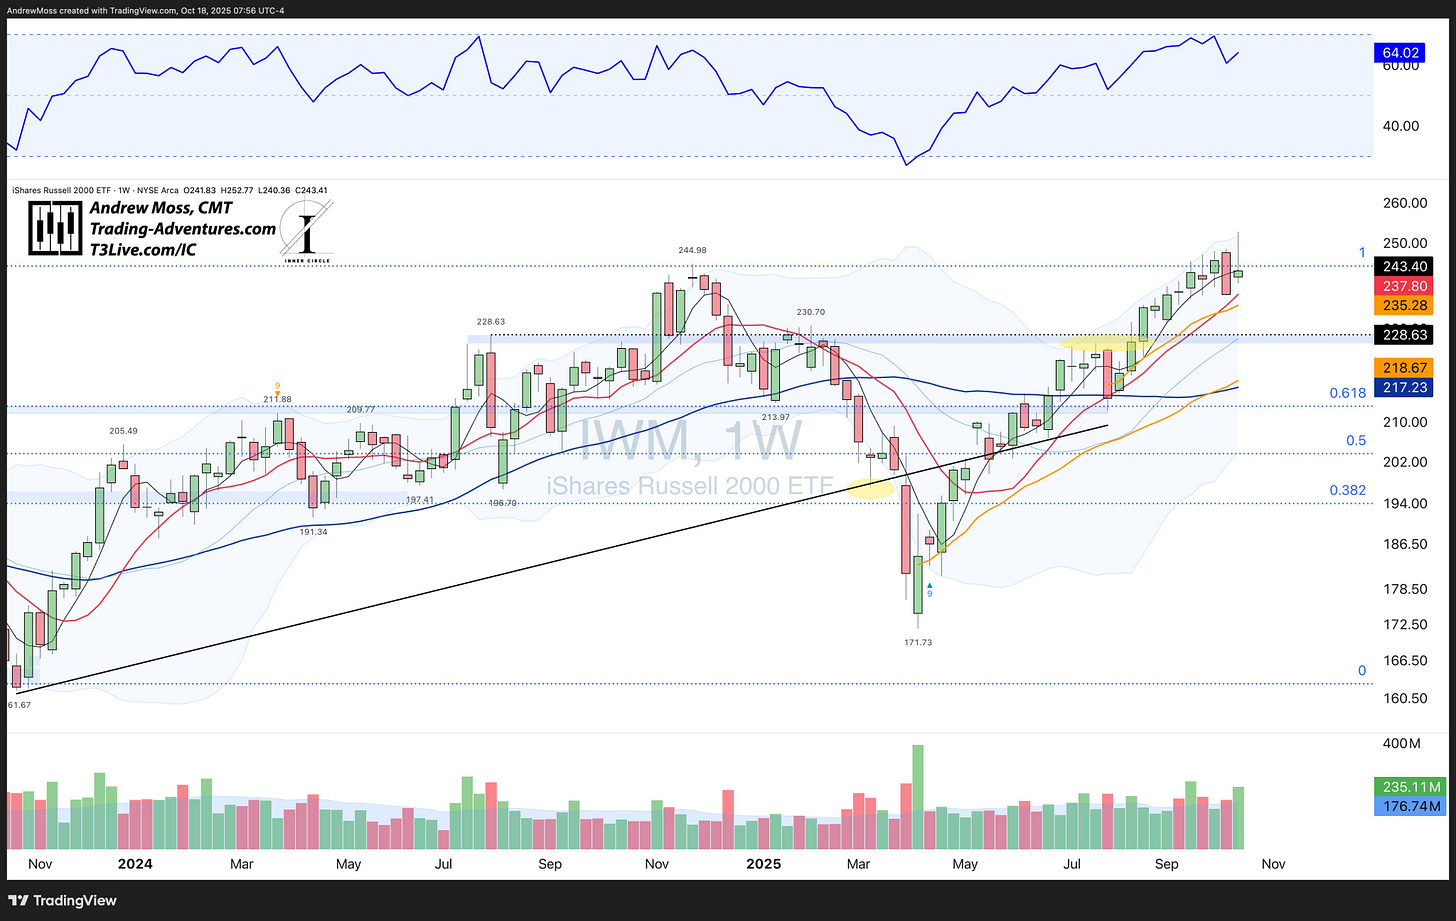
Russell 2000 (IWM)
Small caps led early, made a new high, but couldn’t hold it. IWM closed right on the 4-week moving average.
Volume was slightly above average, showing early enthusiasm that faded by week’s end.
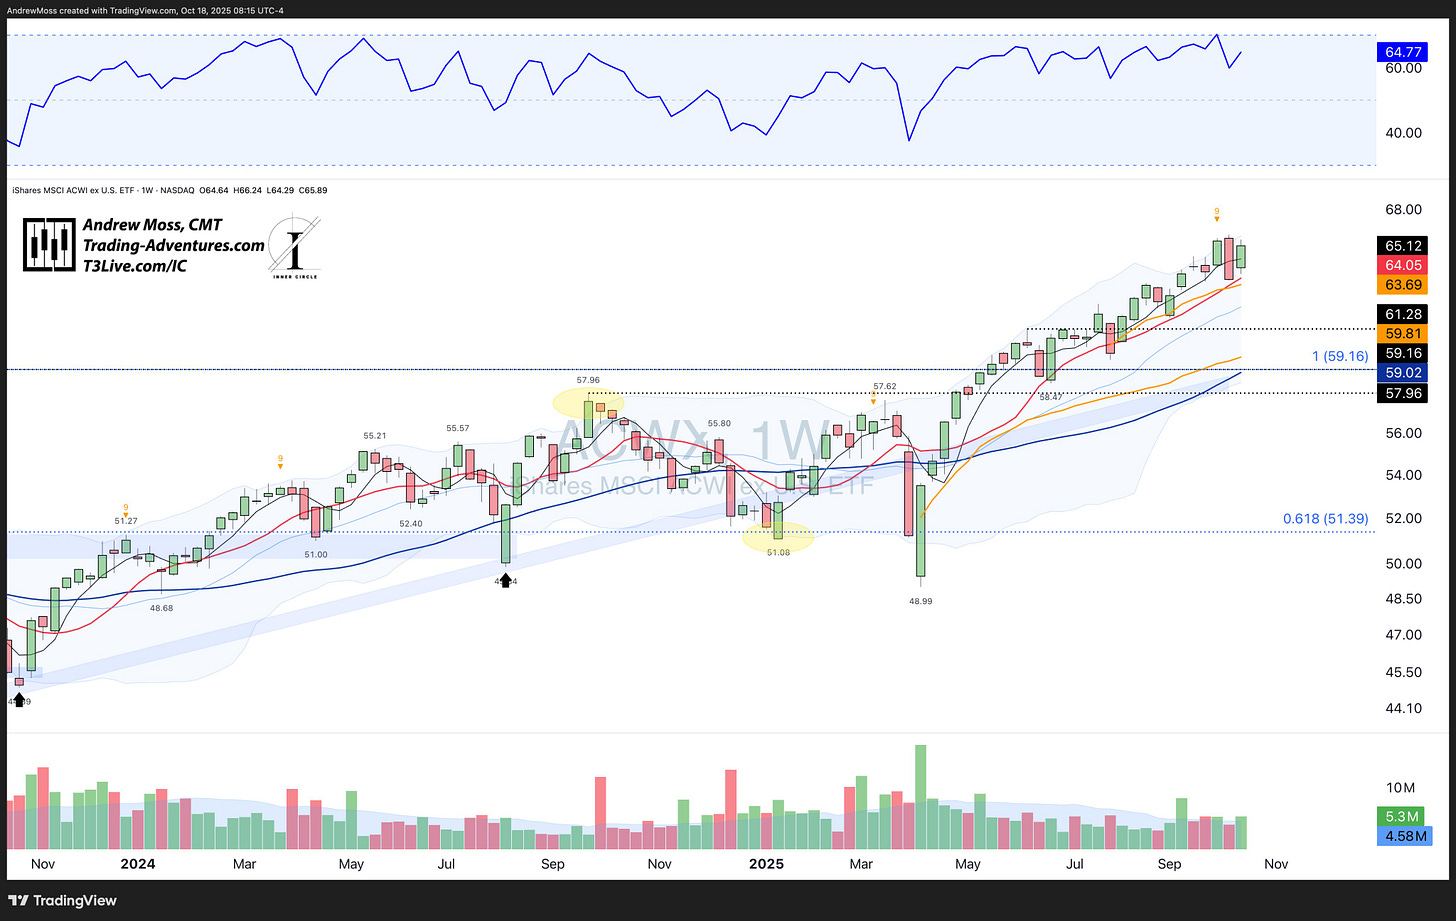
Global Equities (ACWX)
The rest of the world repaired much of last week’s damage, moving back near recent highs on rising volume that climbed back above its 20-week average.
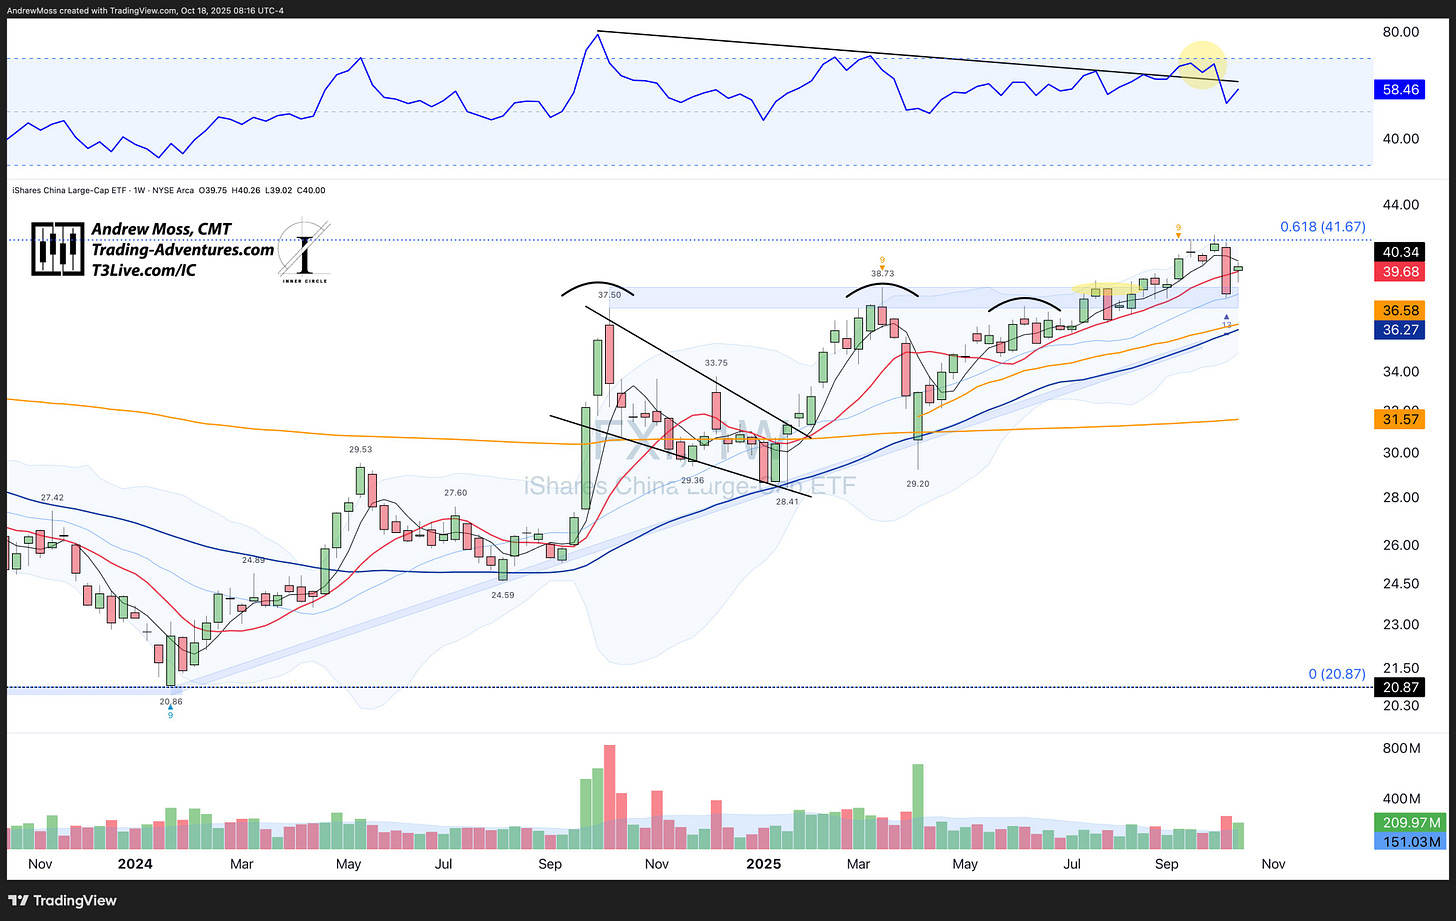
China (FXI)
FXI printed a spinning-top doji between its 4- and 10-week moving averages—right in the middle of last week’s sell-off range.
Volume was roughly double the average, signaling indecision and churn.
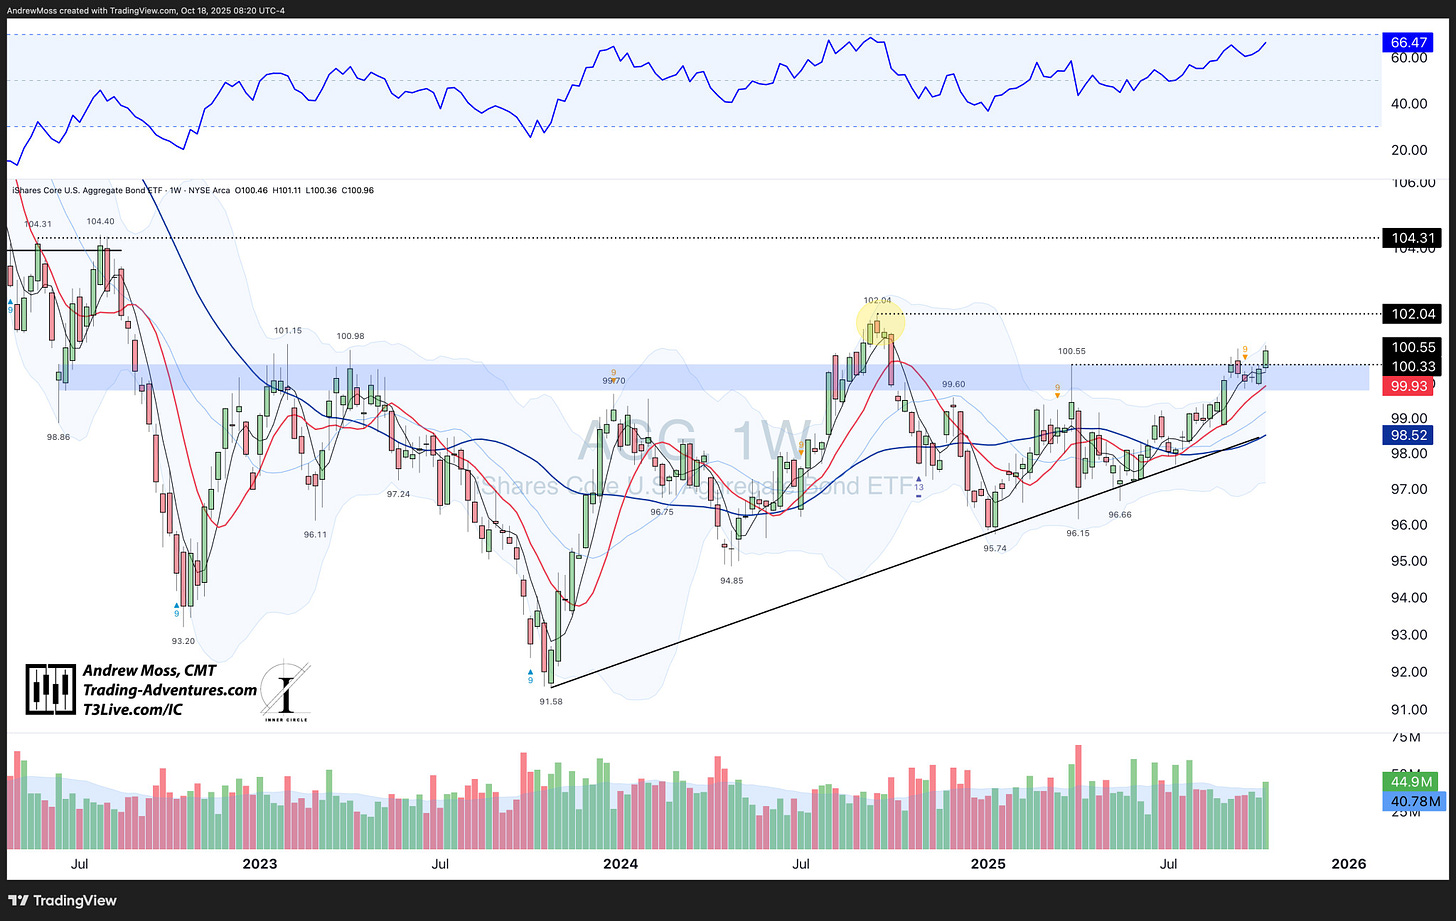
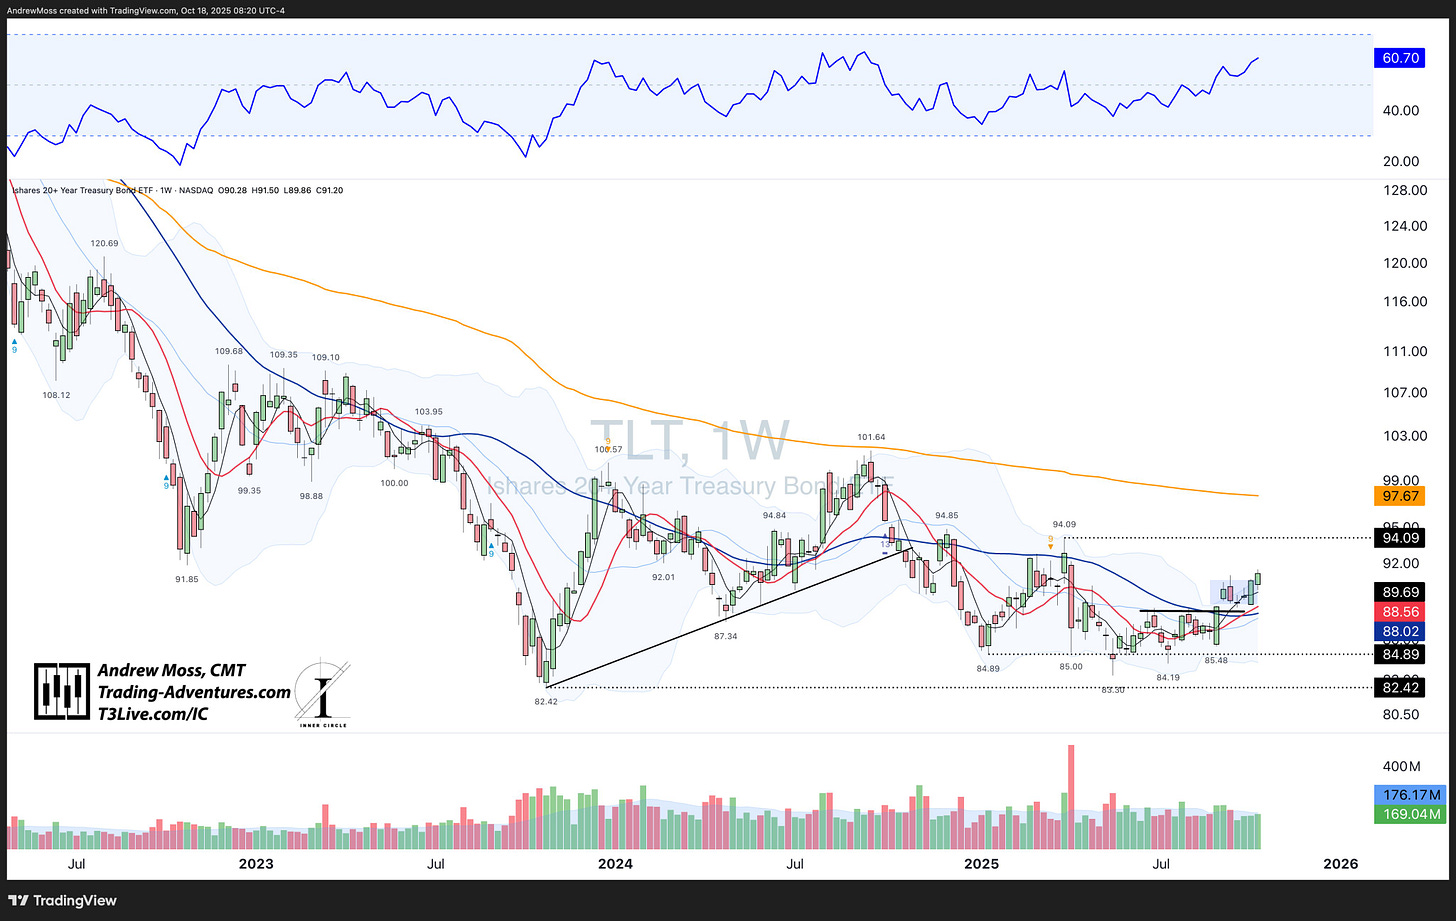
🏦 Bonds
Quality bonds (AGG) broke higher from consolidation.
TLT followed—up and out, though not as far.
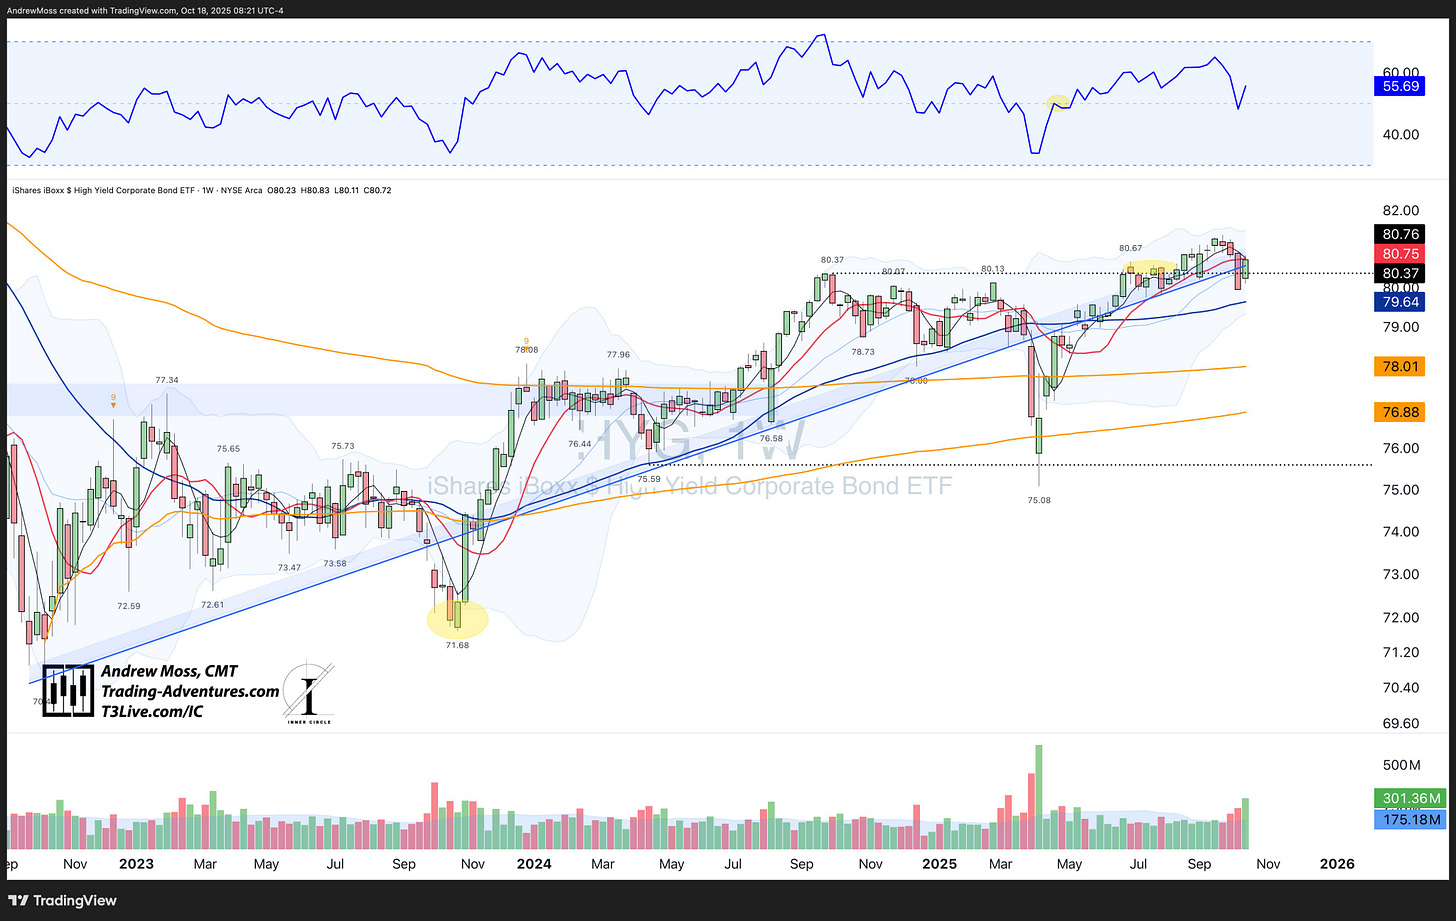
High yield (HYG) recovered most of last week’s losses but finished just below its 10-week moving average.
🧱 Commodities
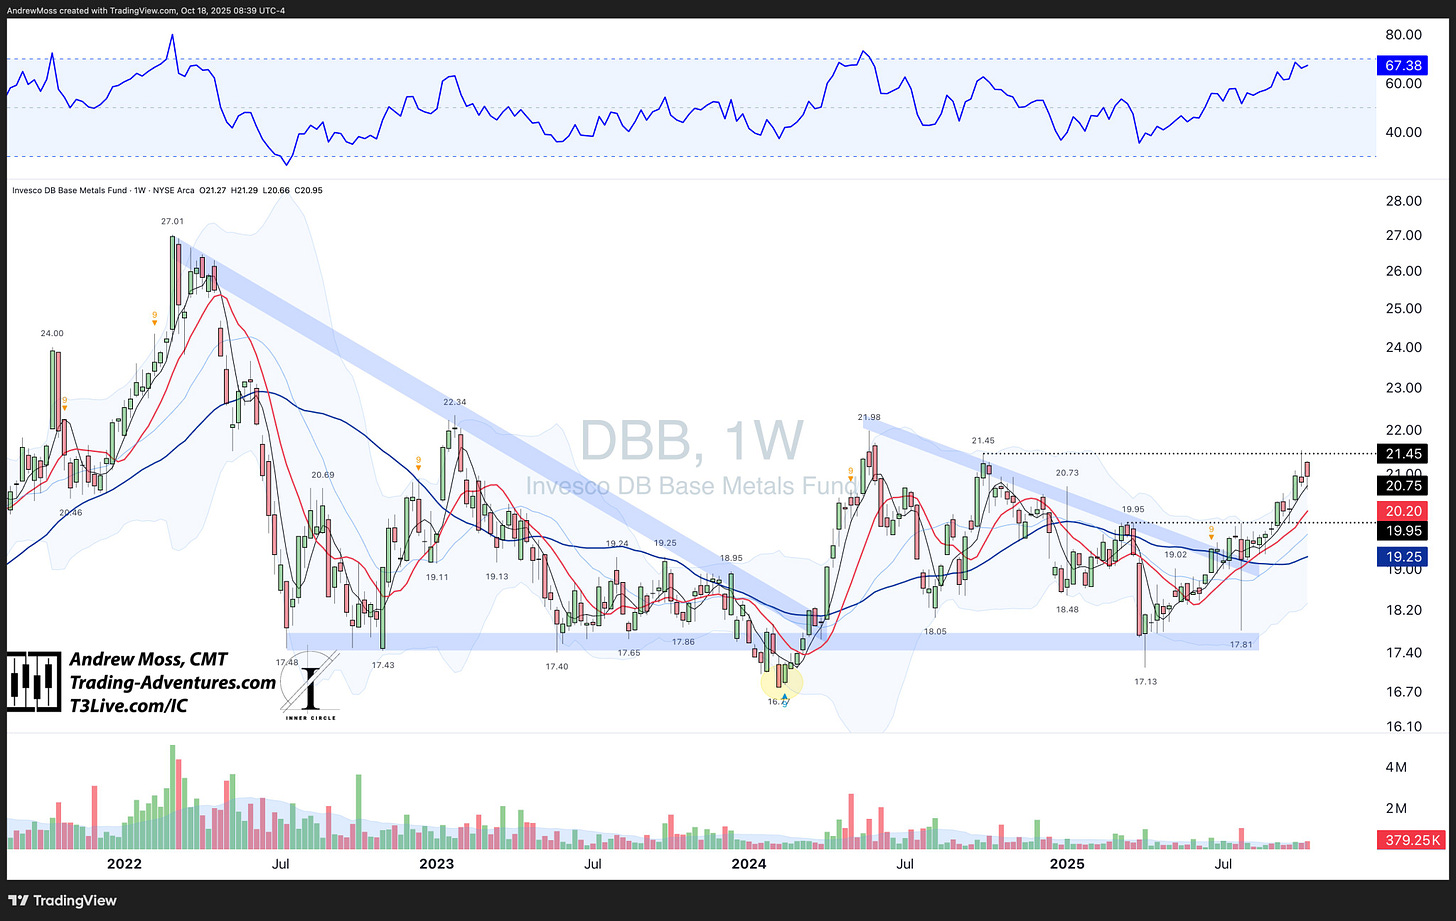
Base Metals (DBB)
Base metals continued higher early in the week, then reversed to close near unchanged.
Momentum remains positive but is showing early signs of slowing.
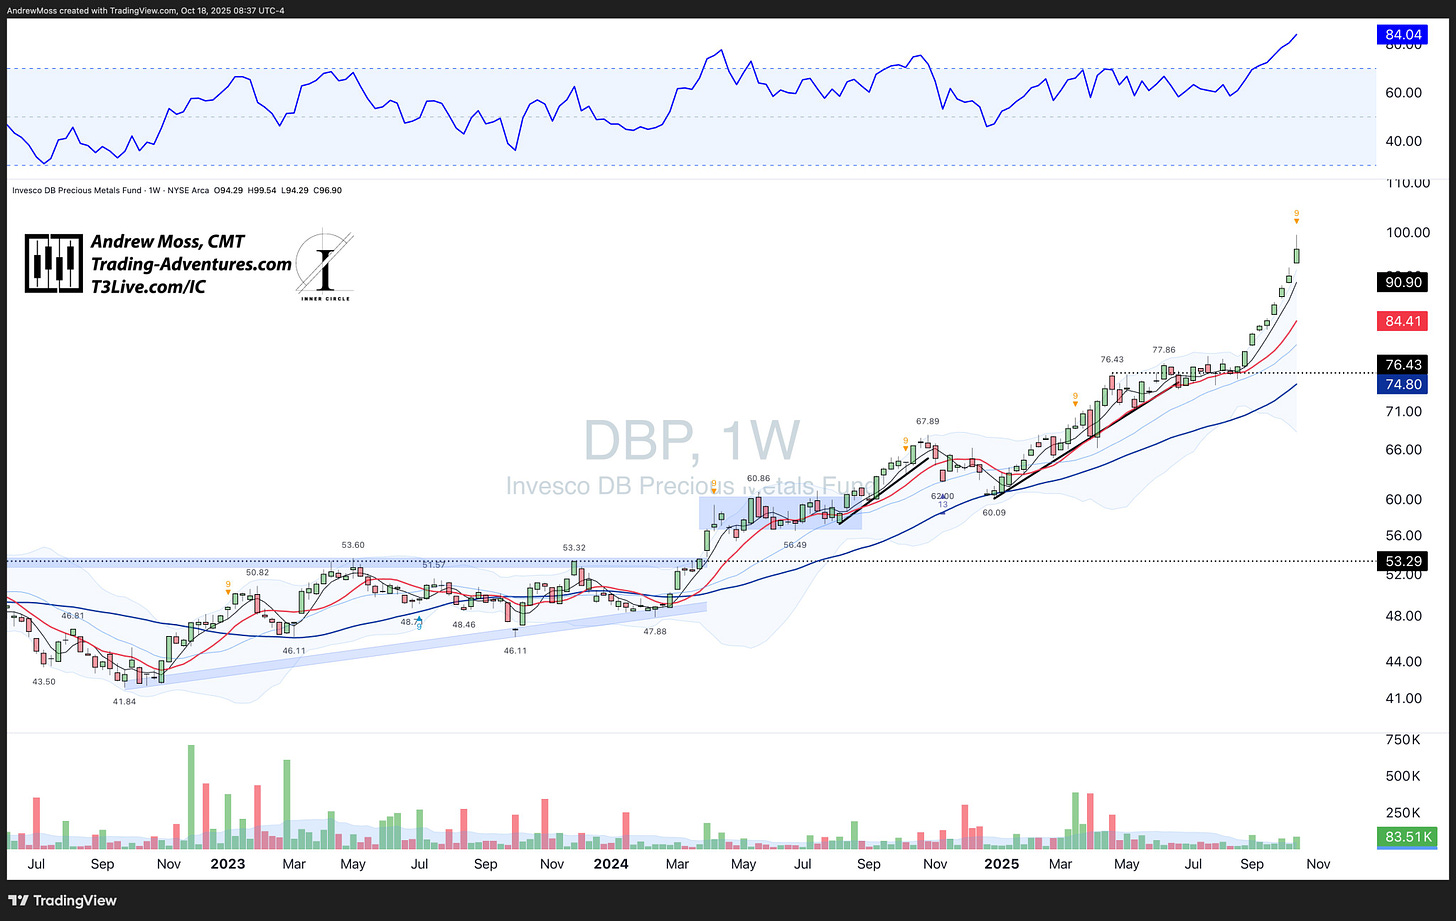
Precious Metals (GLD, SLV, DBP)
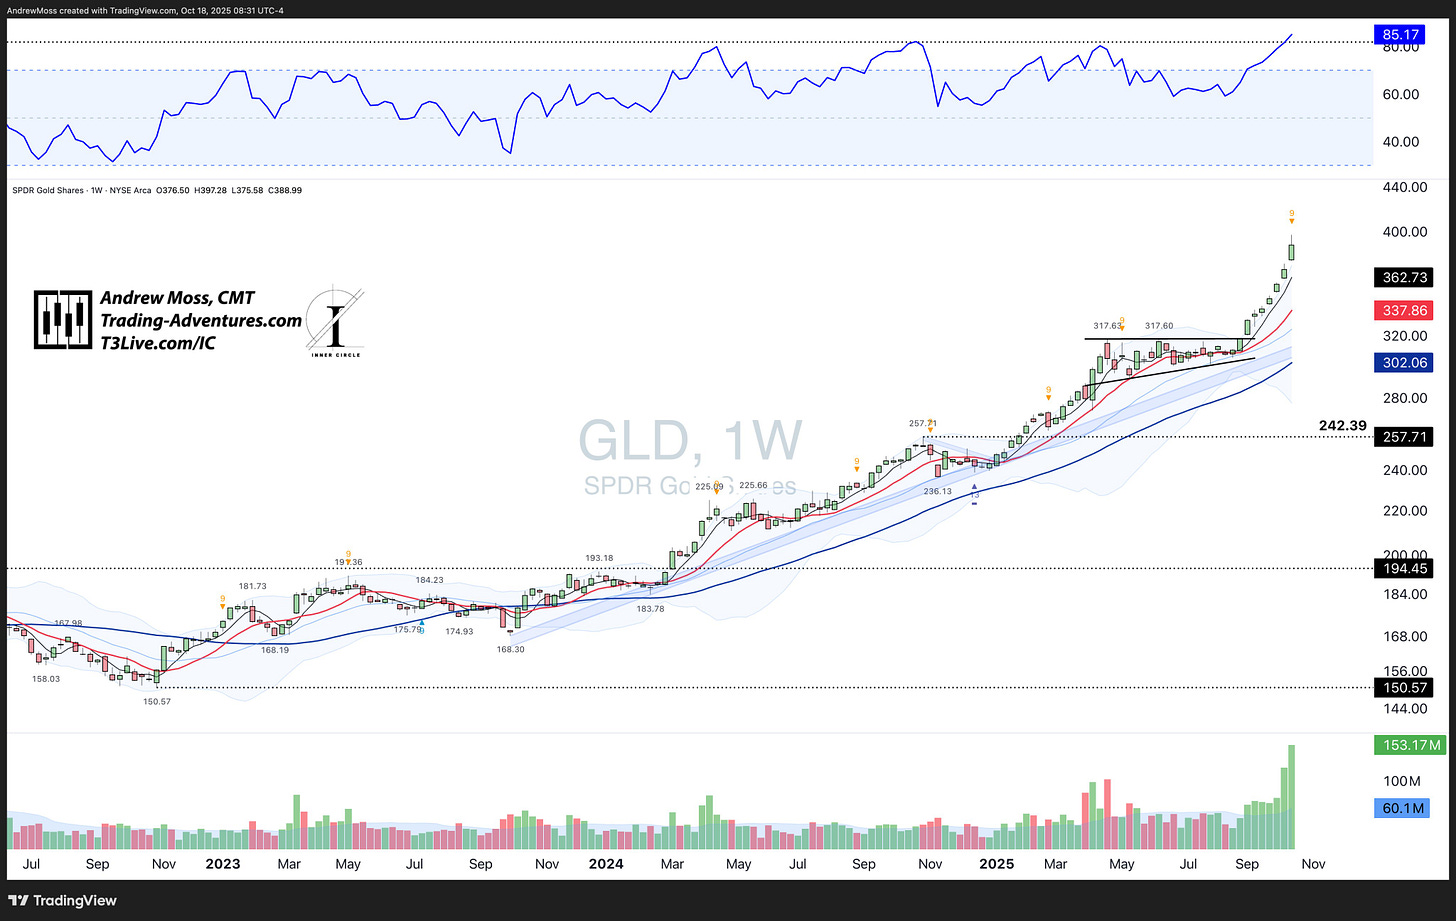
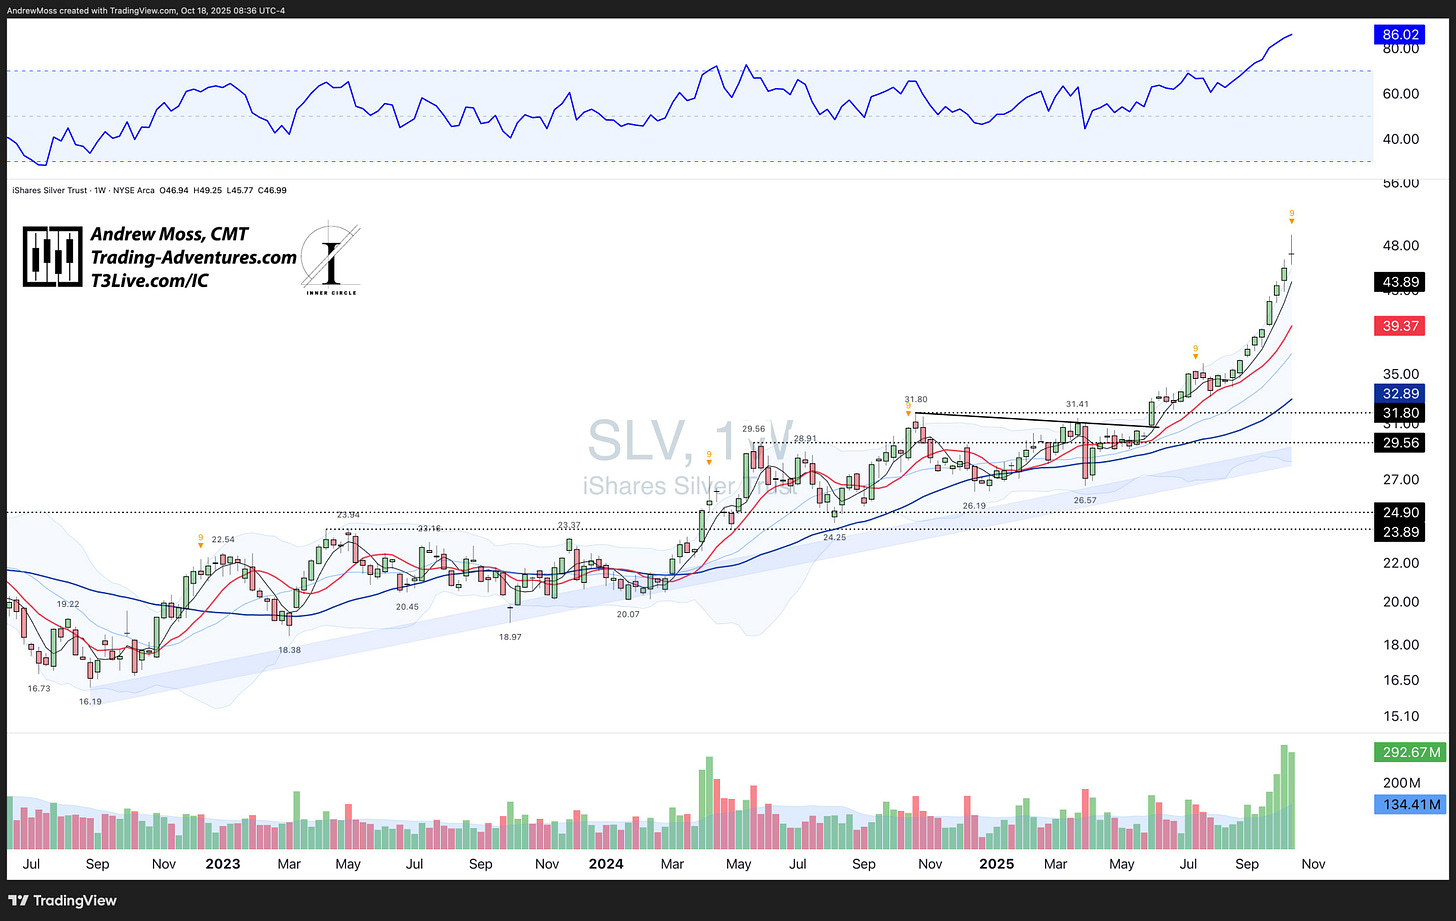
Gold and silver were the headliners again.
GLD extended its streak of “gap-and-go” weeks to seven. Since the breakout near 319, it has gapped up and moved higher every week—on massive and still rising volume.
Weekly RSI sits above 85, roughly 15 % above the 10-week MA, and a DeMark 9 sell setup printed this week. That combination suggests a rest or pullback phase is due.
SLV mirrors the pattern—same extended RSI, heavy but cooling volume, and a potential topping candle.
The DBP composite of precious metals tells the same story: strong trend, stretched conditions, and likely short-term exhaustion.
💵 U.S. Dollar
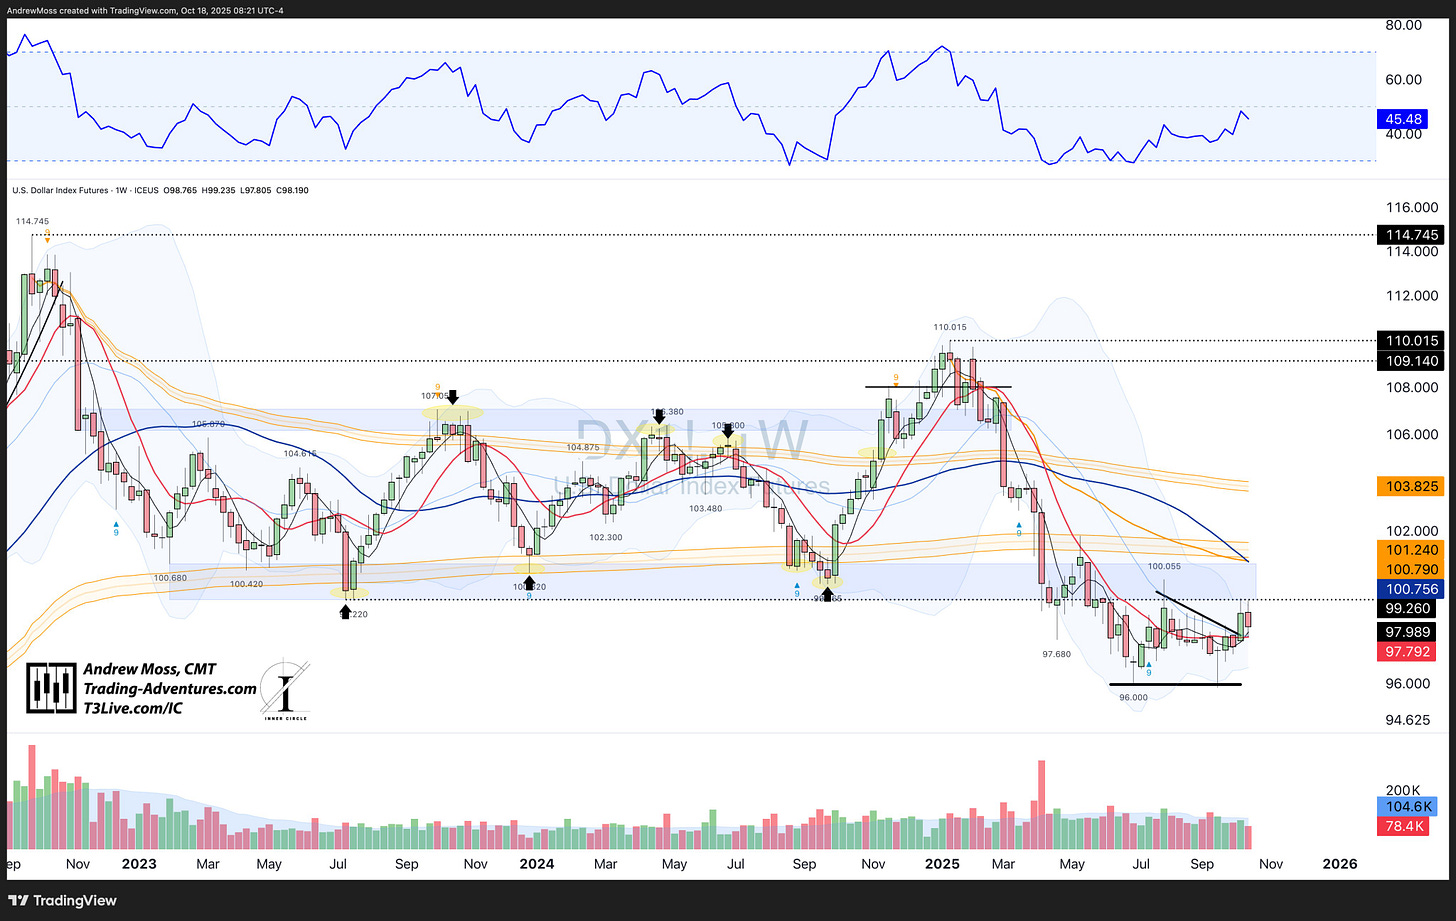
The dollar spent another week testing resistance near 99.25 while dipping to its 10-week moving average.
A range-bound week that reflects uncertainty in rates and risk appetite.
₿ Crypto Check
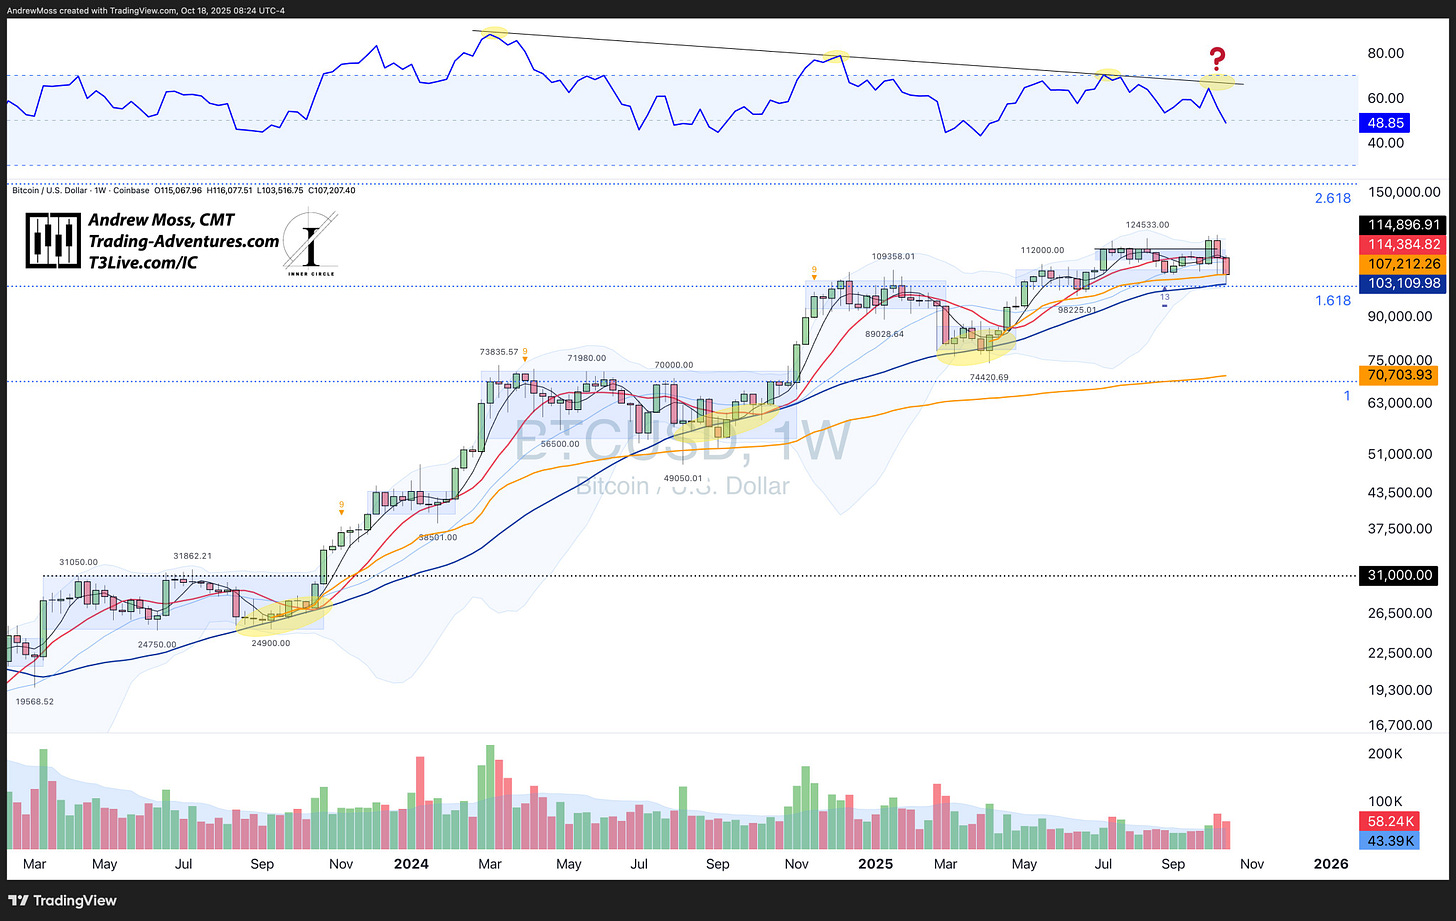
Bitcoin (BTC) touched its 40-week moving average and Fibonacci extension near 103,000 before bouncing to 107,000.
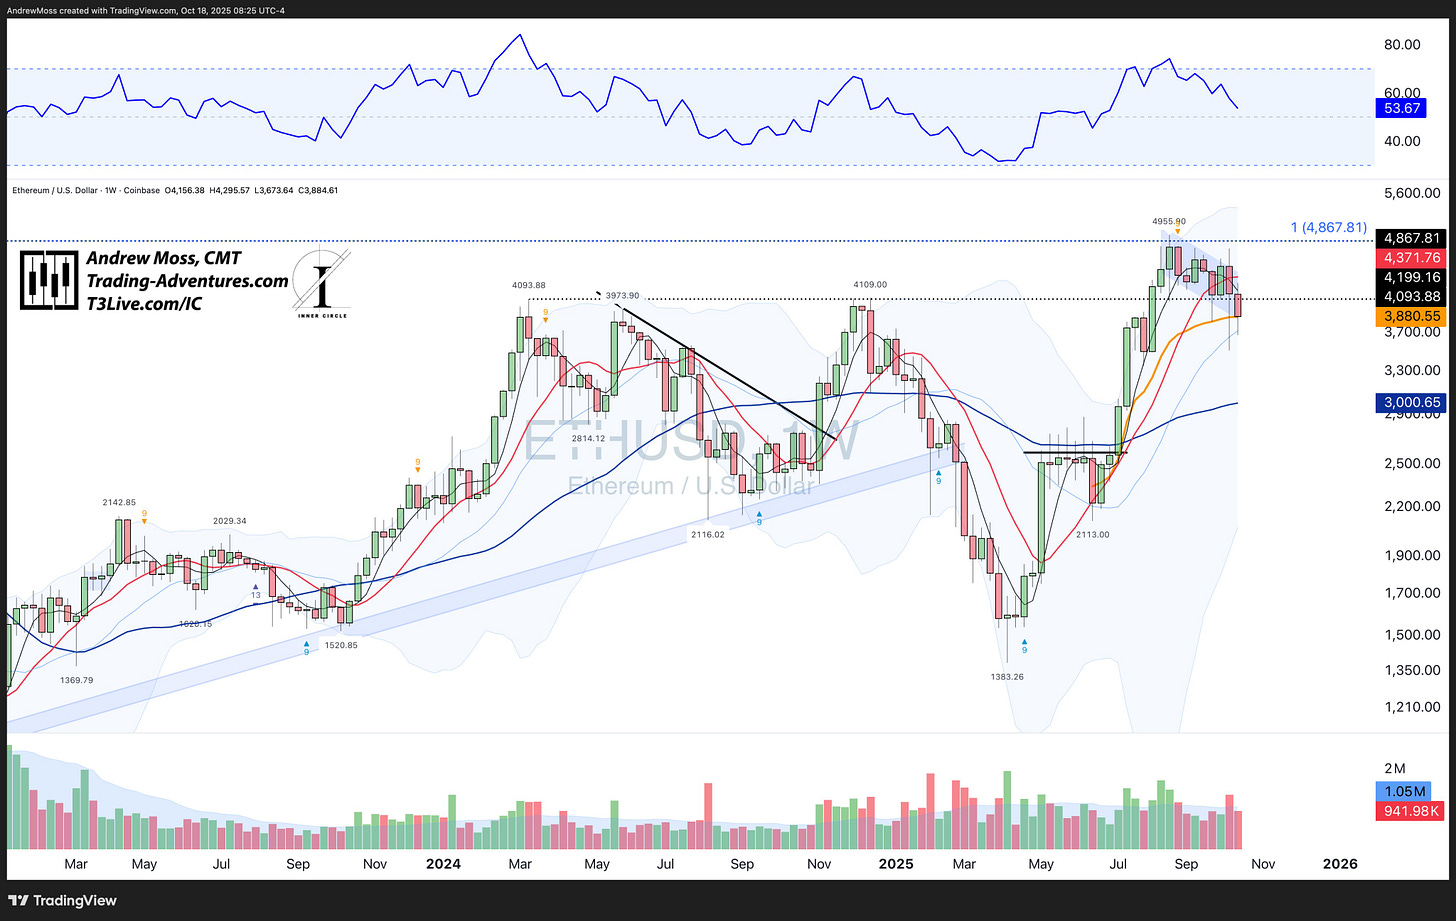
Ethereum (ETH) continues to test its pivot-low anchored VWAP. The bull flag is still technically intact but weakening with time.
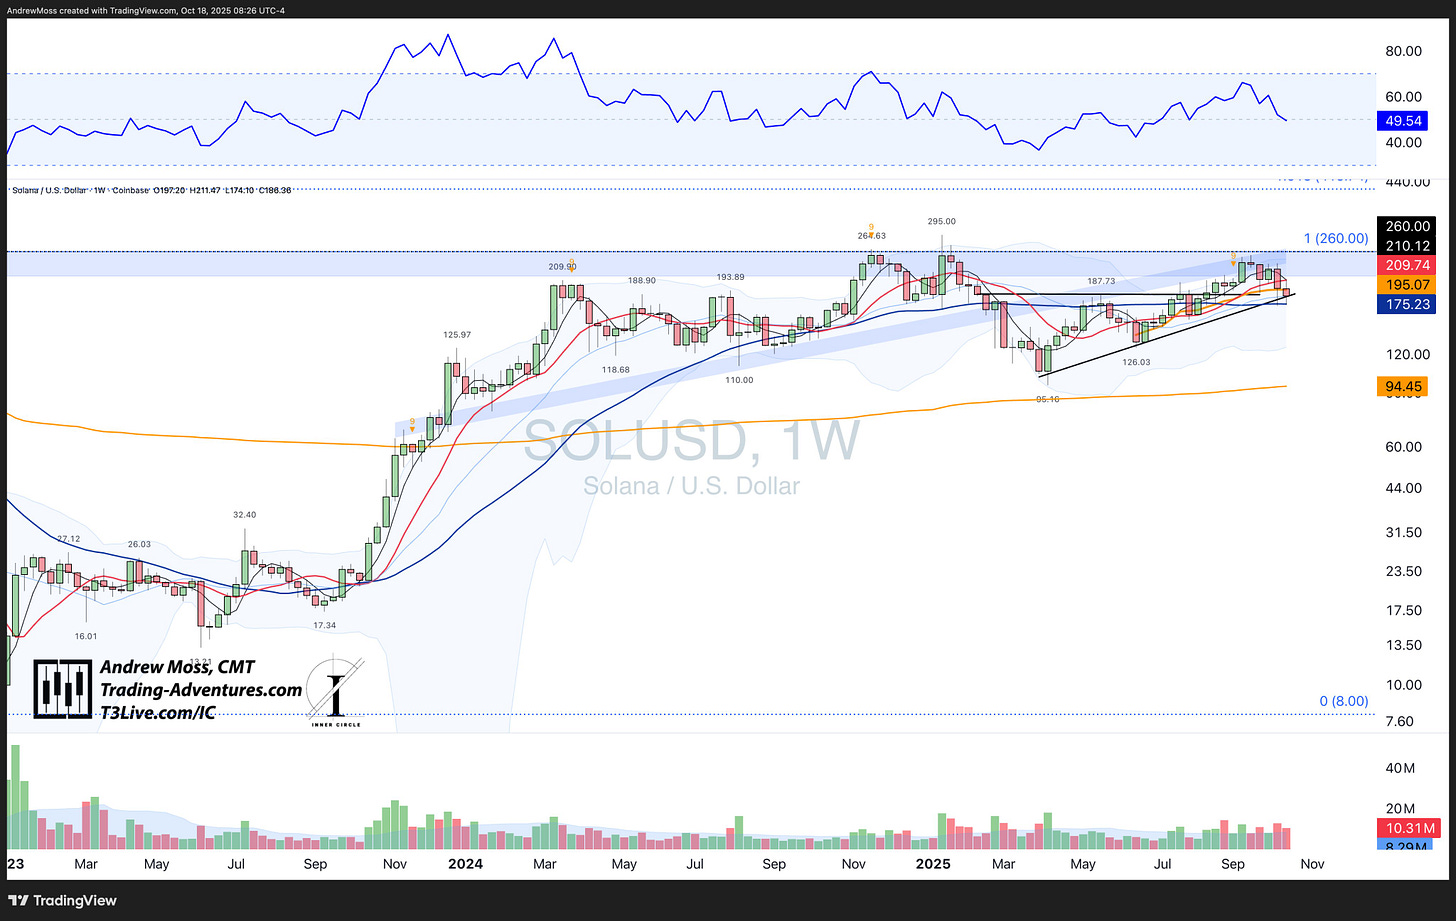
Solana (SOL) is holding trendline support near 187.
🔁 Relative Strength & Participation
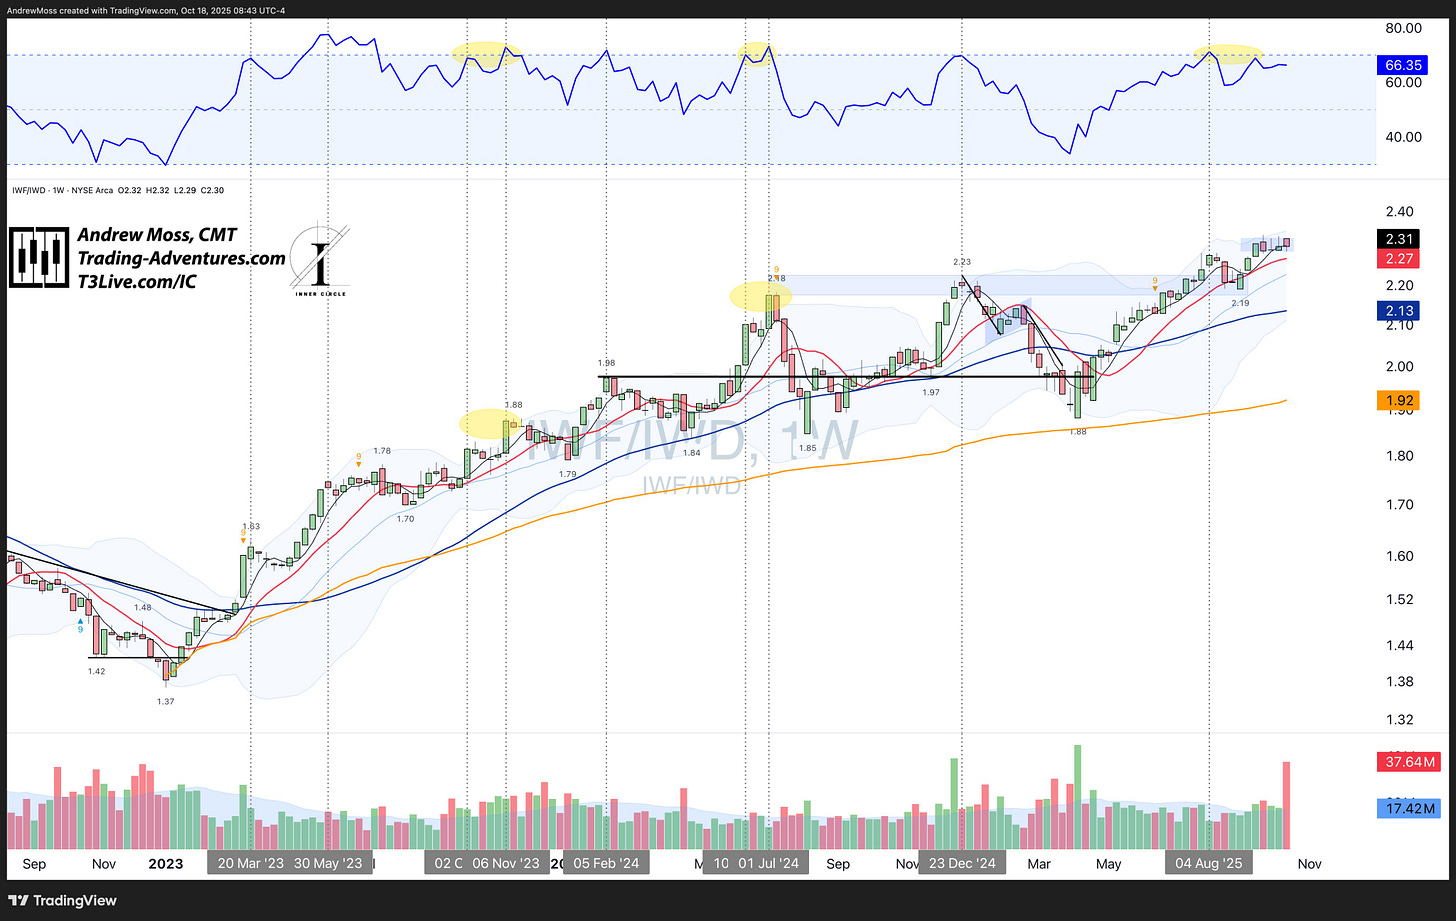
Growth vs. Value (IWF : IWD) continues its high-level consolidation.
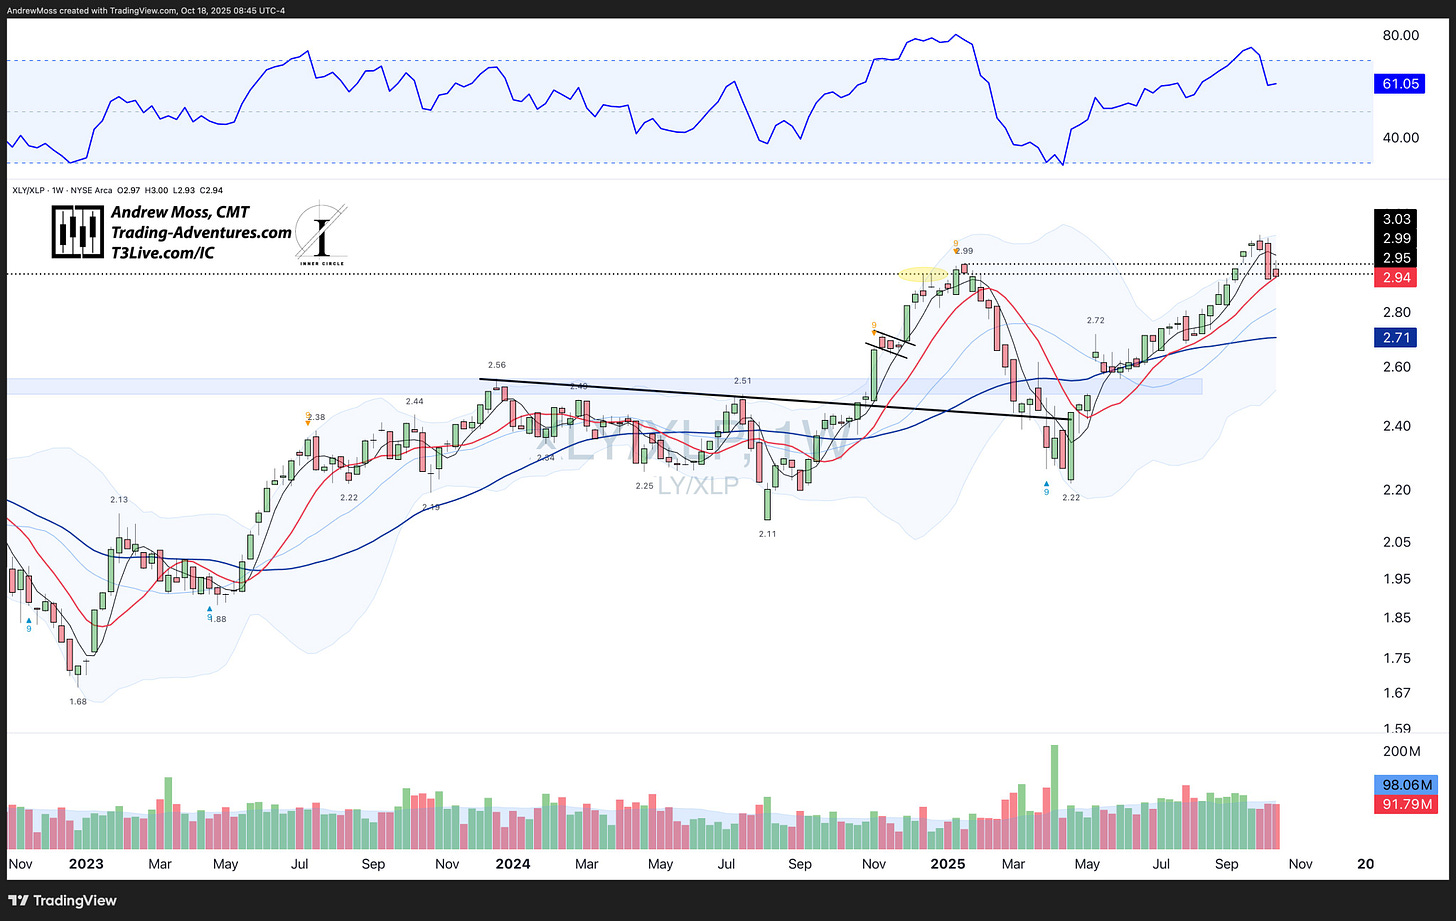
Discretionary vs. Staples (XLY : XLP) printed an inside week near the 10-week MA, still at the lower end of last week’s range.
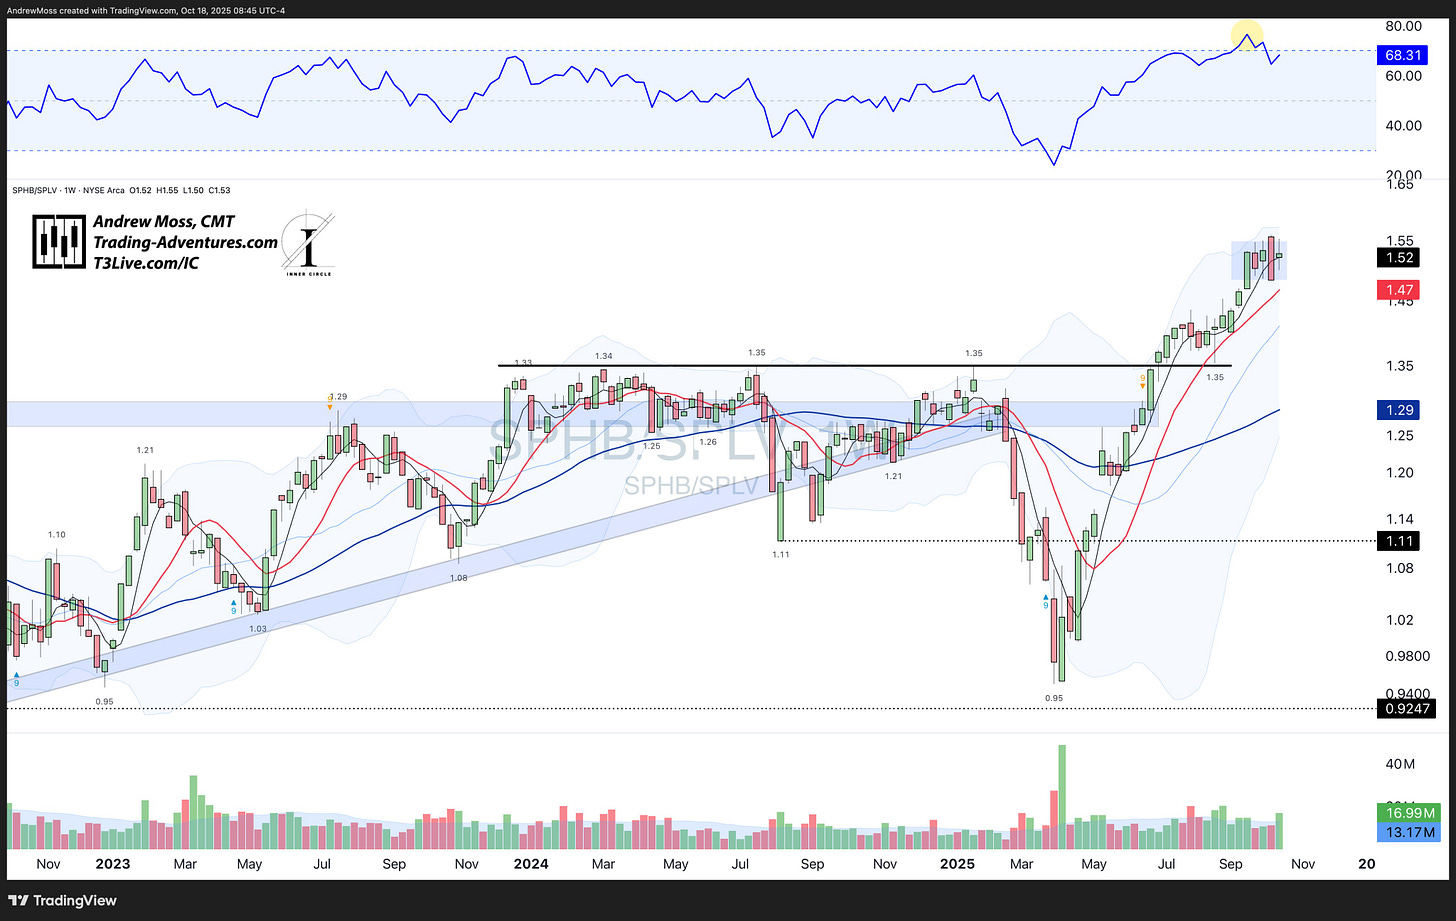
High Beta vs. Low Volatility (SPHB : SPLV) remains choppy but holding up well.
Relative Strength — What Is It? (Really) in the new Chart School section.
⚖️ Breadth
The percentage of SPX stocks above their 50- and 200-day moving averages ticked up slightly this week.
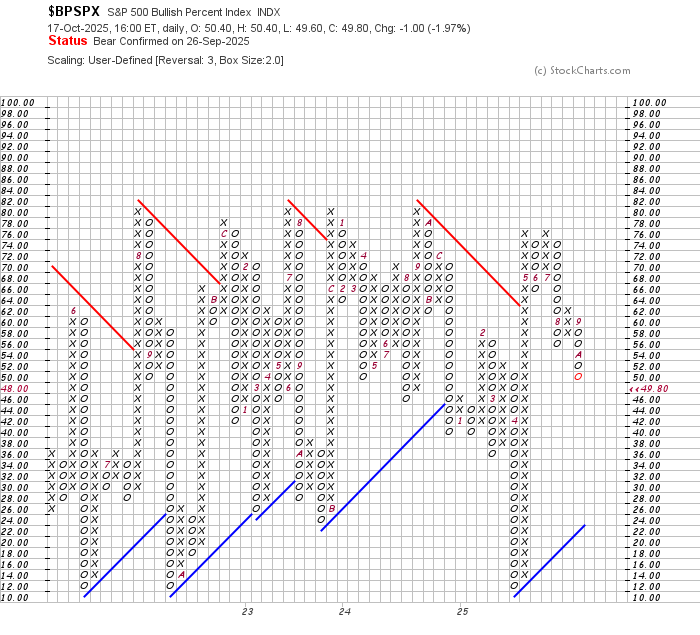
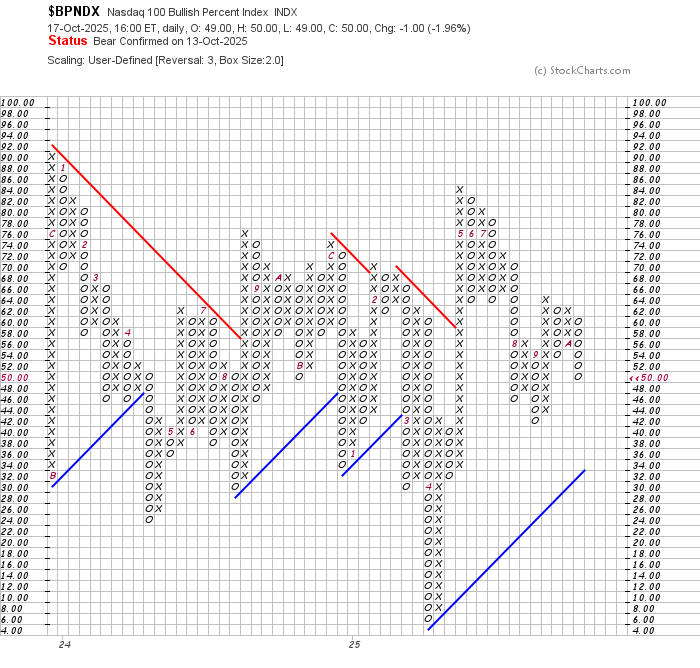
Bullish Percent Indices:
All three major Bullish Percent Indexes—BPSPX, BPNDX, and BPNYA—added to their columns of O’s and remain in bear confirmed status.
Read this for a refresher:
🧭 Now What?
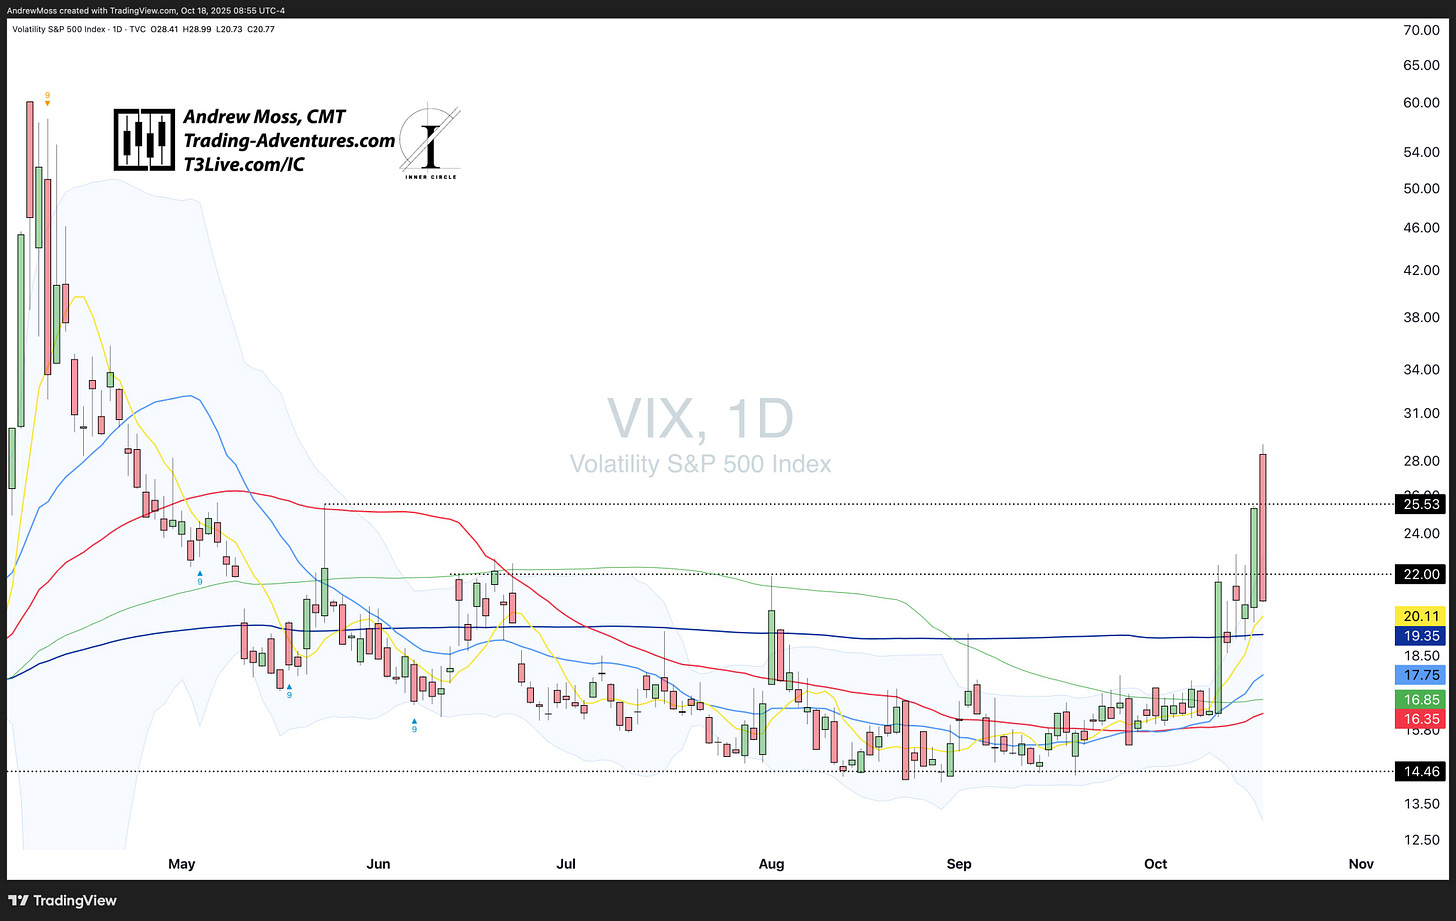
Last week’s sell-off met decent repair this week, even as volatility spiked.
The key: that volatility cooled quickly.
VIX daily
Seasonality
Since 2018, the SPX has tended to dip in mid-October before turning higher into year-end.
The 2025 line (blue) on the seasonal chart sits right on that typical trough—perhaps we front-ran the dip, or perhaps there’s still a little more downside before the turn.
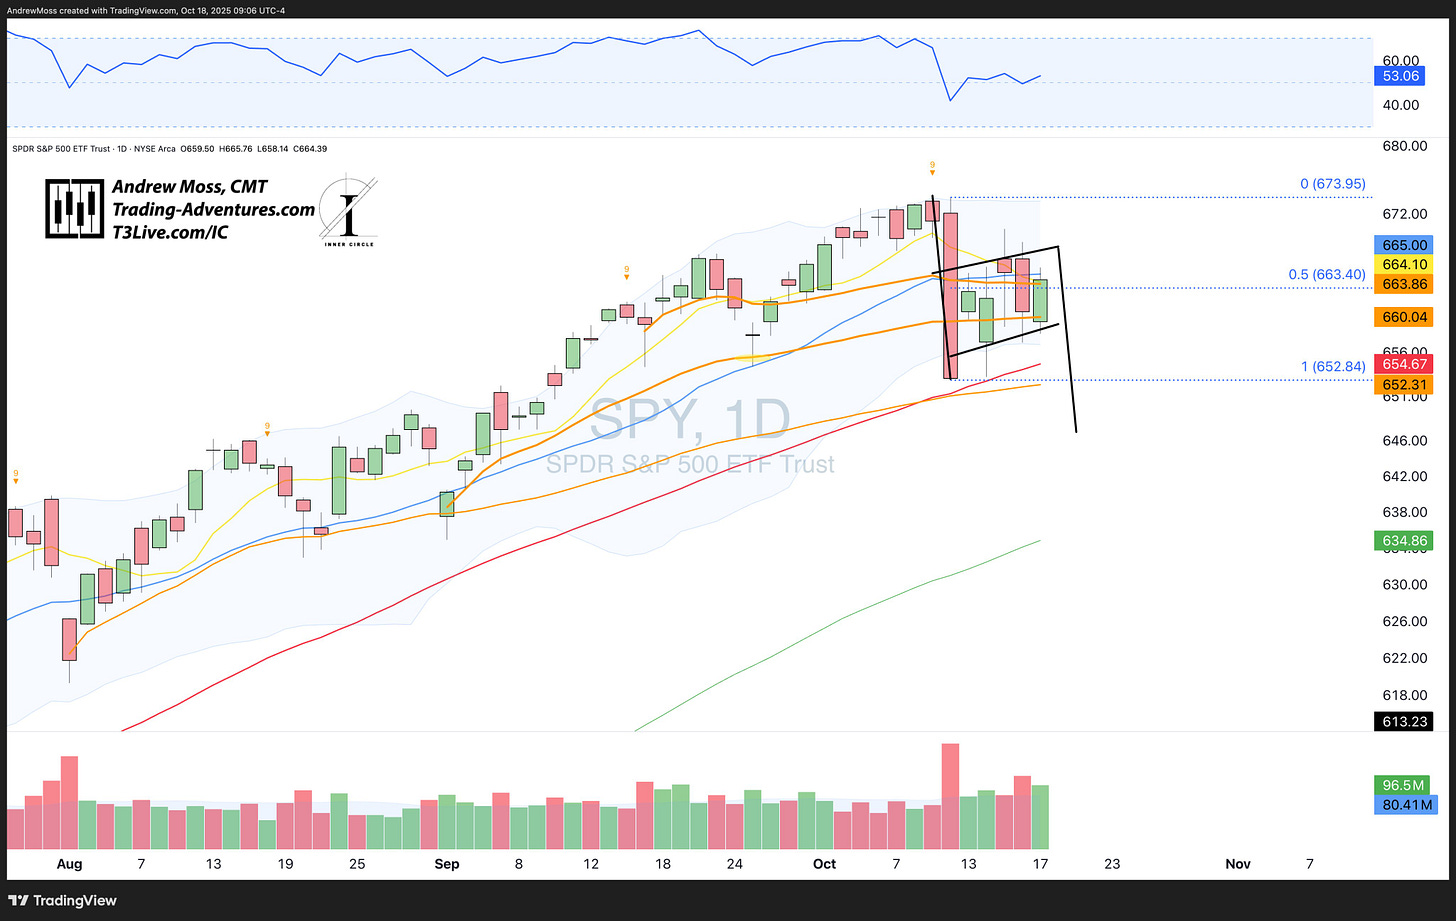
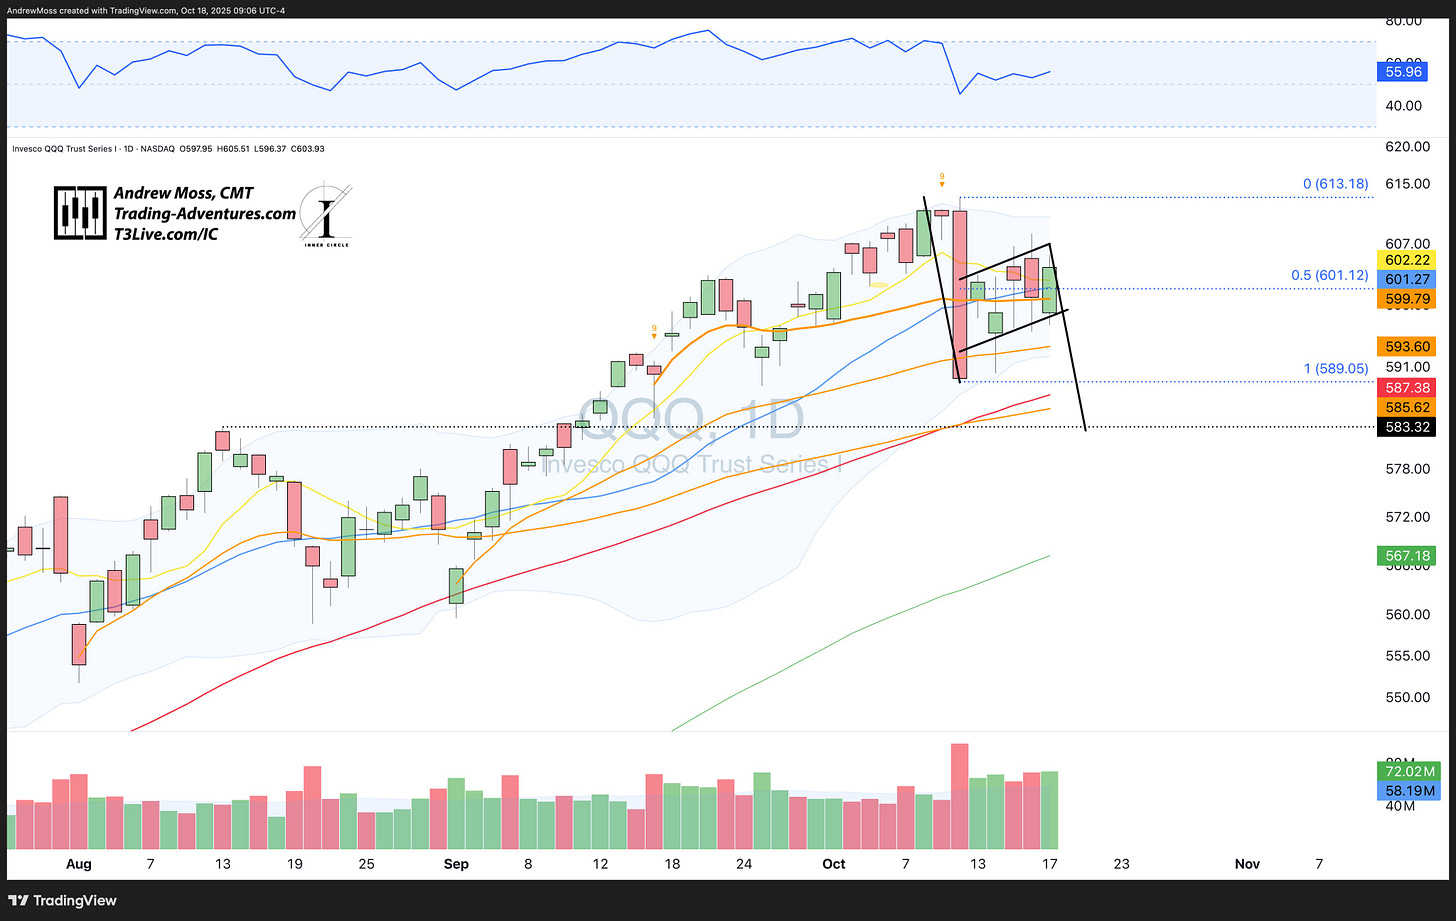
Daily View
On the daily timeframe, SPY dropped about 3 % last Friday, while QQQ fell around 4 %.
Both remain above their 50-day moving averages, but a small bear-flag or rising-wedge pattern could suggest one more leg down before resetting.
A quick flush below the 50-day and the anchored VWAPs from the August lows—roughly a 4–5 % move—wouldn’t be a surprise and would likely set up a healthier rally into year-end.
Big Picture
Whether the market grinds higher immediately or pulls back once more, the overall structure remains bullish.
A test of the QQQ 583.32 pivot from August would be healthy and could create a strong base for the next leg higher.
So What Do We Do?
Exactly what we always do.
Review multiple timeframes — weekly, daily, roadmap (1-hour), and 30-minute.
Track anchored VWAPs, 5-day moving averages, and key pivots.
Stay patient, stay disciplined, and focus on setups that fit your system.
Let headlines come and go.
🗓 The Week Ahead
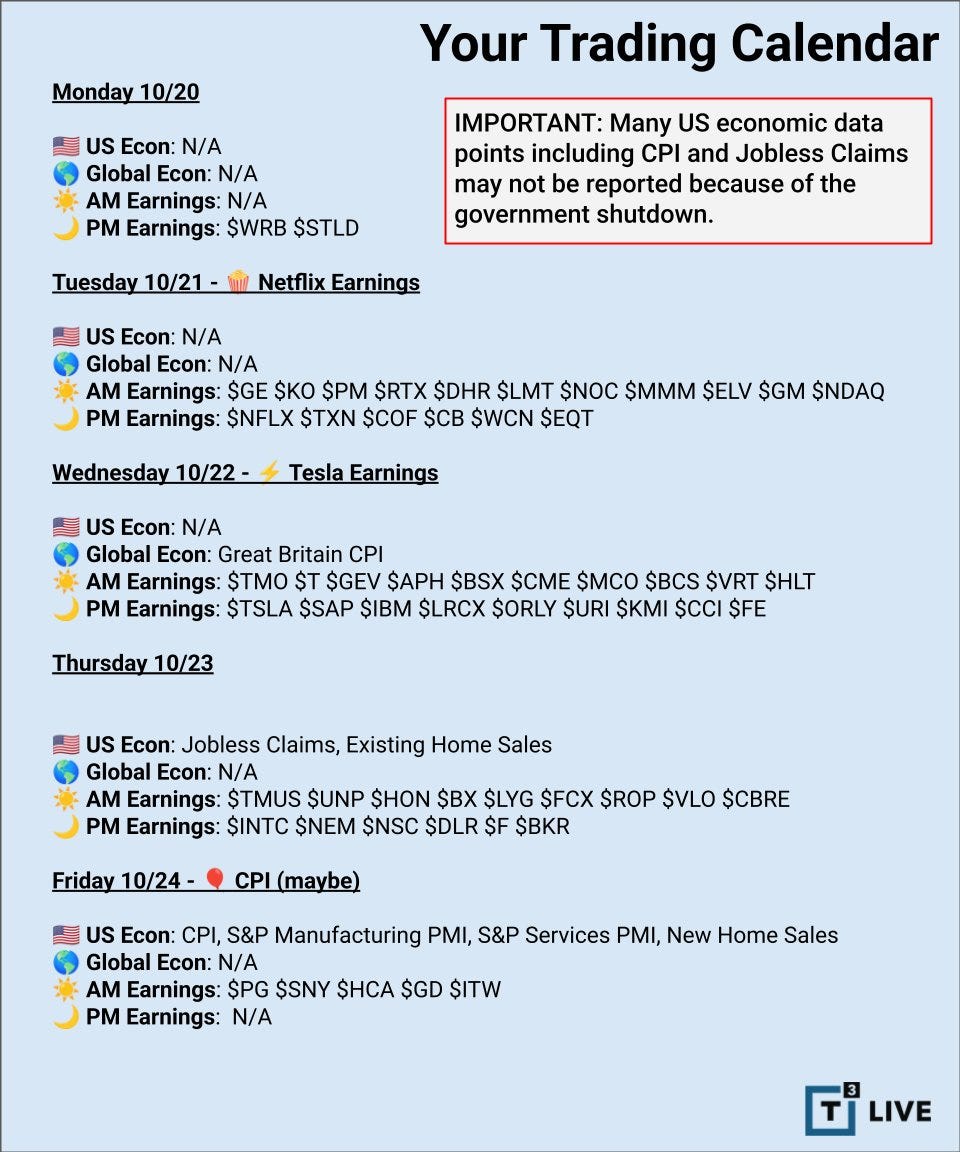
Earnings season is now in full swing with NFLX on Tuesday, TSLA on Wednesday, and PG on Friday.
Add in key economic reports and the potential for headline volatility, and the setup for next week remains active and opportunistic.
🧠 Final Thought
October volatility is normal.
Strong charts remain strong. Weak charts stay weak.
Volatility isn’t risk—it’s information.
Read it. Don’t fear it.
🙌 Thanks for Reading
Thank you all for reading and spending some time with me on a Saturday morning!
For a deeper dive, check out the new Chart School section — lessons on breadth, relative strength, AVWAP, and more.
If you found this week’s charts helpful, please -
📤 Share
💬 Comment
♻️ and Repost
It helps more traders see the work and join the discussion.
Also, consider supporting with a paid subscription to keep them coming.
All posts remain public — no locked content. Just charts, signals, and steady updates to help you trade with confidence.
—Andy
Looking For More?
Elevate Your Trading Adventure Even Further With These Offerings.
The Disclosures
***This is NOT financial advice. This is NOT a recommendation to buy, sell, or trade any security. The content presented here is intended for educational purposes only.


