📈Weekly Charts📉 September 13, 2025
Strength Across the Board
✔️ New highs.
✔️ Broad participation.
✔️ Even bonds are breaking out.
Seasonal concerns remain, but the weight of the evidence is still bullish — for now.
Let’s zoom out and break it down 👇
📊 U.S. Indexes: Resting Near Highs
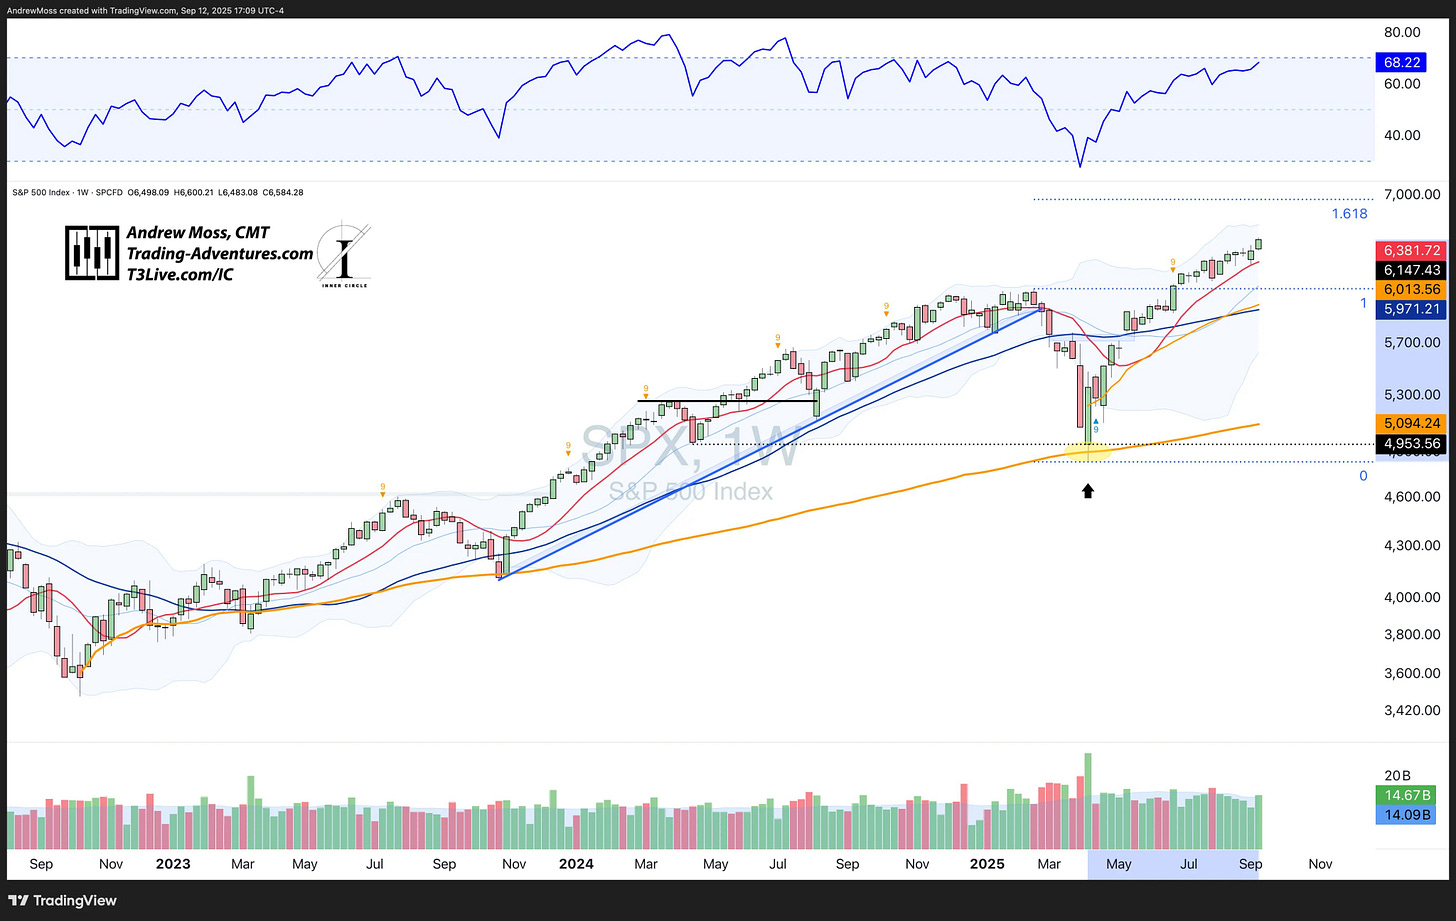
S&P 500 (SPX):
📈 Another new weekly closing high — up ~3.5% from last week’s low
📊 Volume above average
😎 RSI rising but not overbought (68.22)
💪 Momentum and structure remain strong
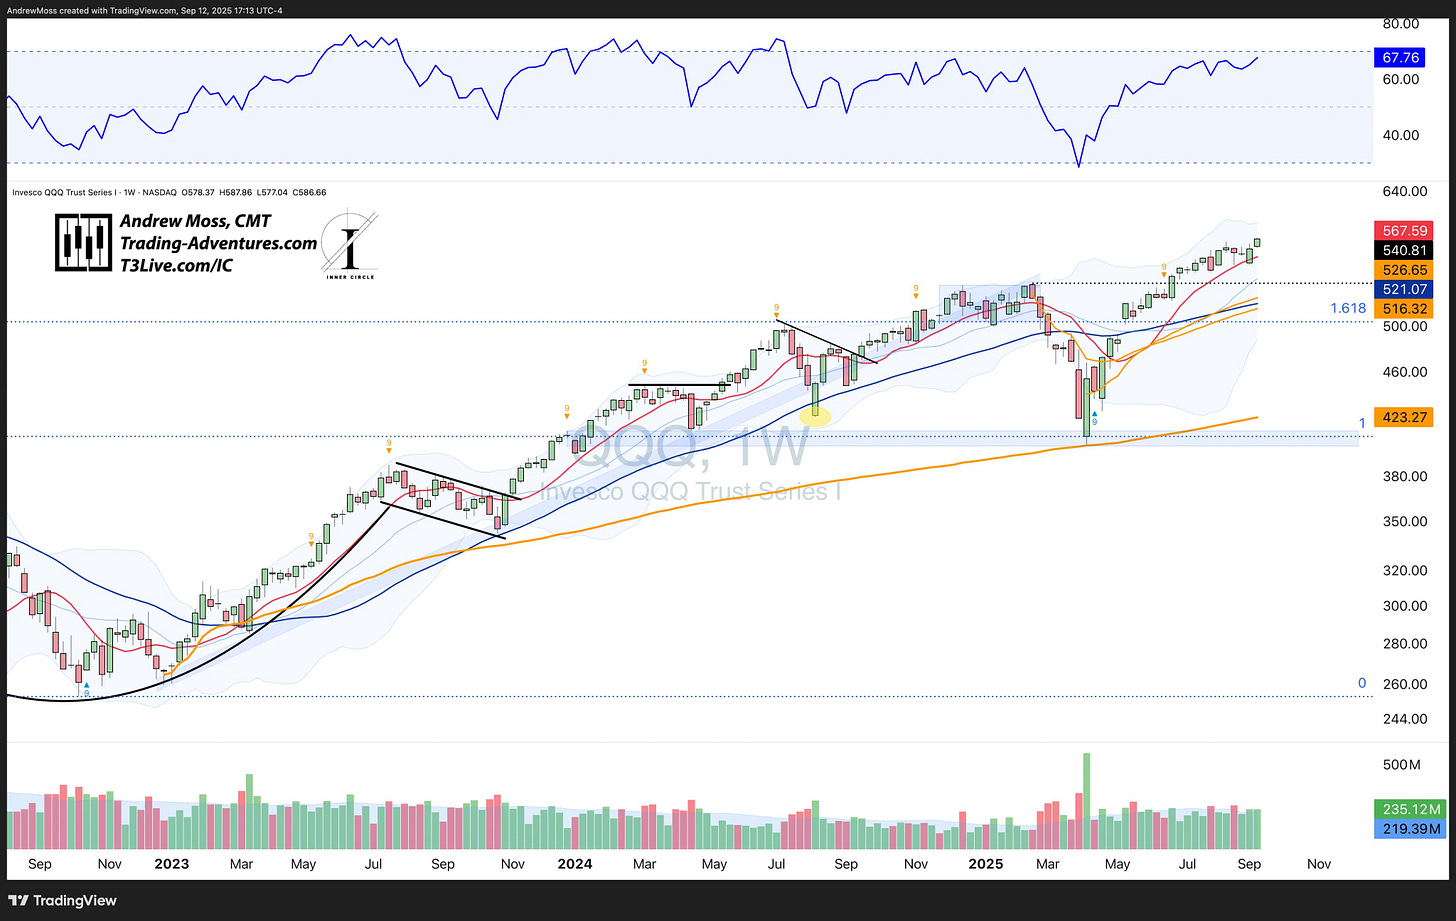
Nasdaq 100 (QQQ):
✅ New all-time closing high
📈 Up ~4.75% from last week’s dip
🔊 Firm volume, climbing RSI
📏 Bollinger Bands tightening — watch for expansion
Big tech leads again.
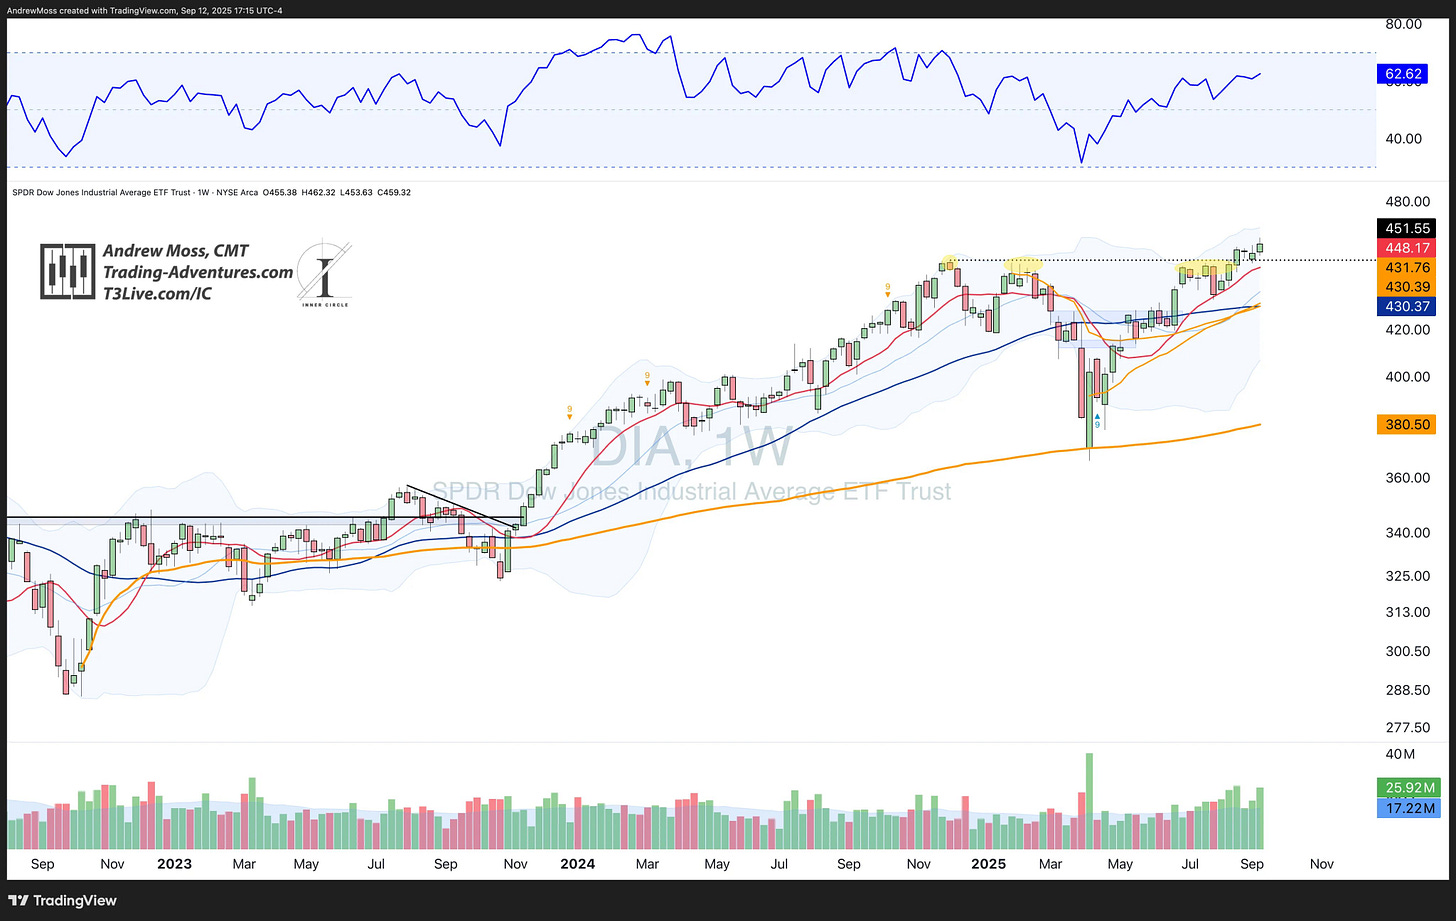
Dow Jones (DIA):
✅ Cleared prior resistance with conviction
📈 Trading well above 10- and 40-week MAs
🧱 Bullish structure forming
💥 Confirmed by strong breadth
The laggard steps up.
🌍 Small Caps & International
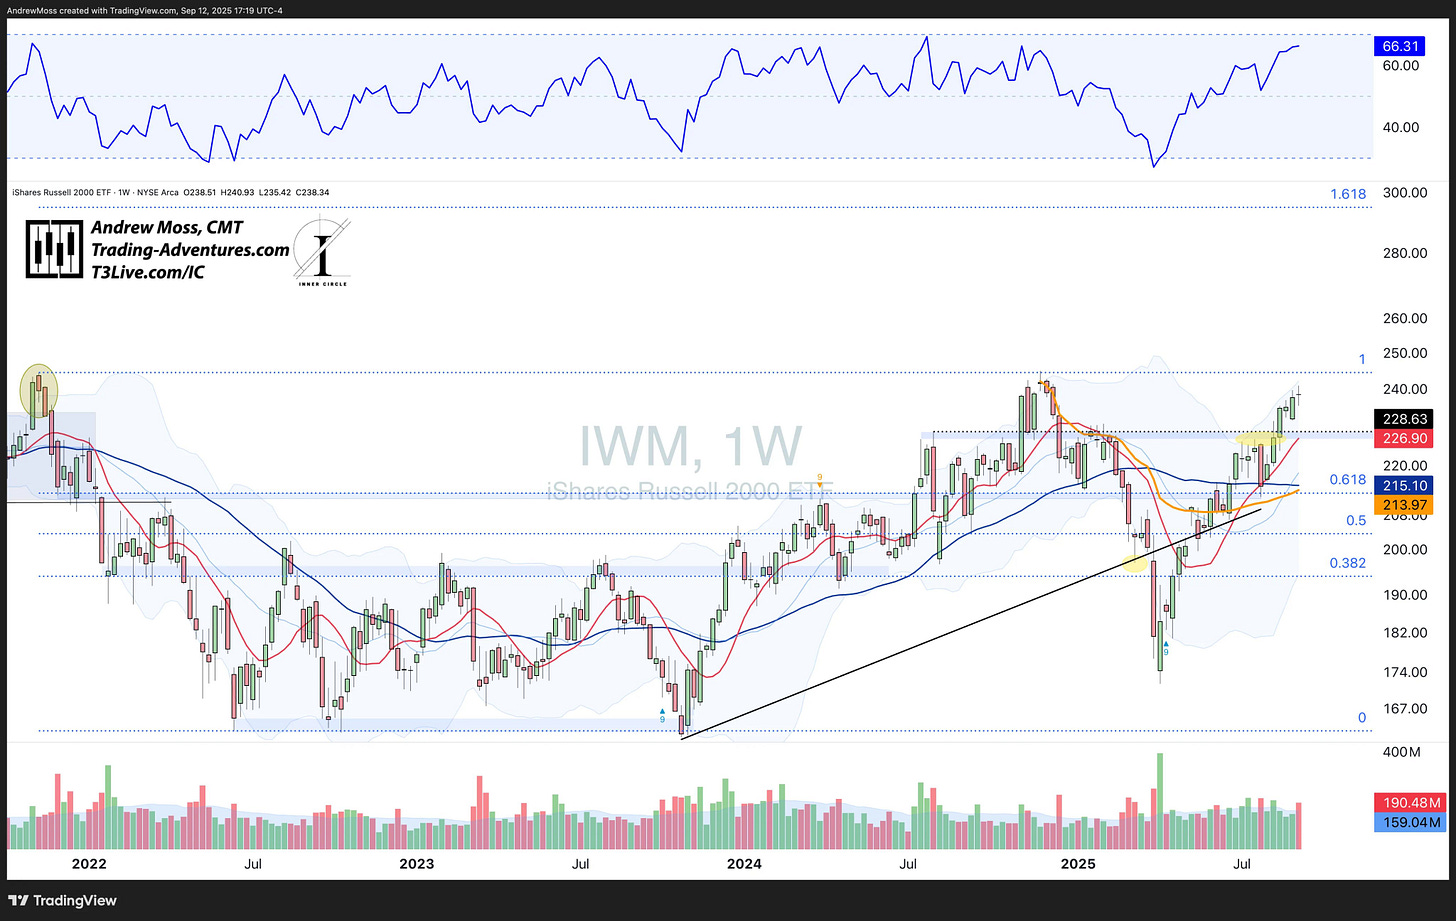
Russell 2000 (IWM):
✅ Ended positive, joining the other indexes
📍 Closed just below the ~$244.98 pivot
⚙️ Still working through resistance
Participating — but at its own pace.
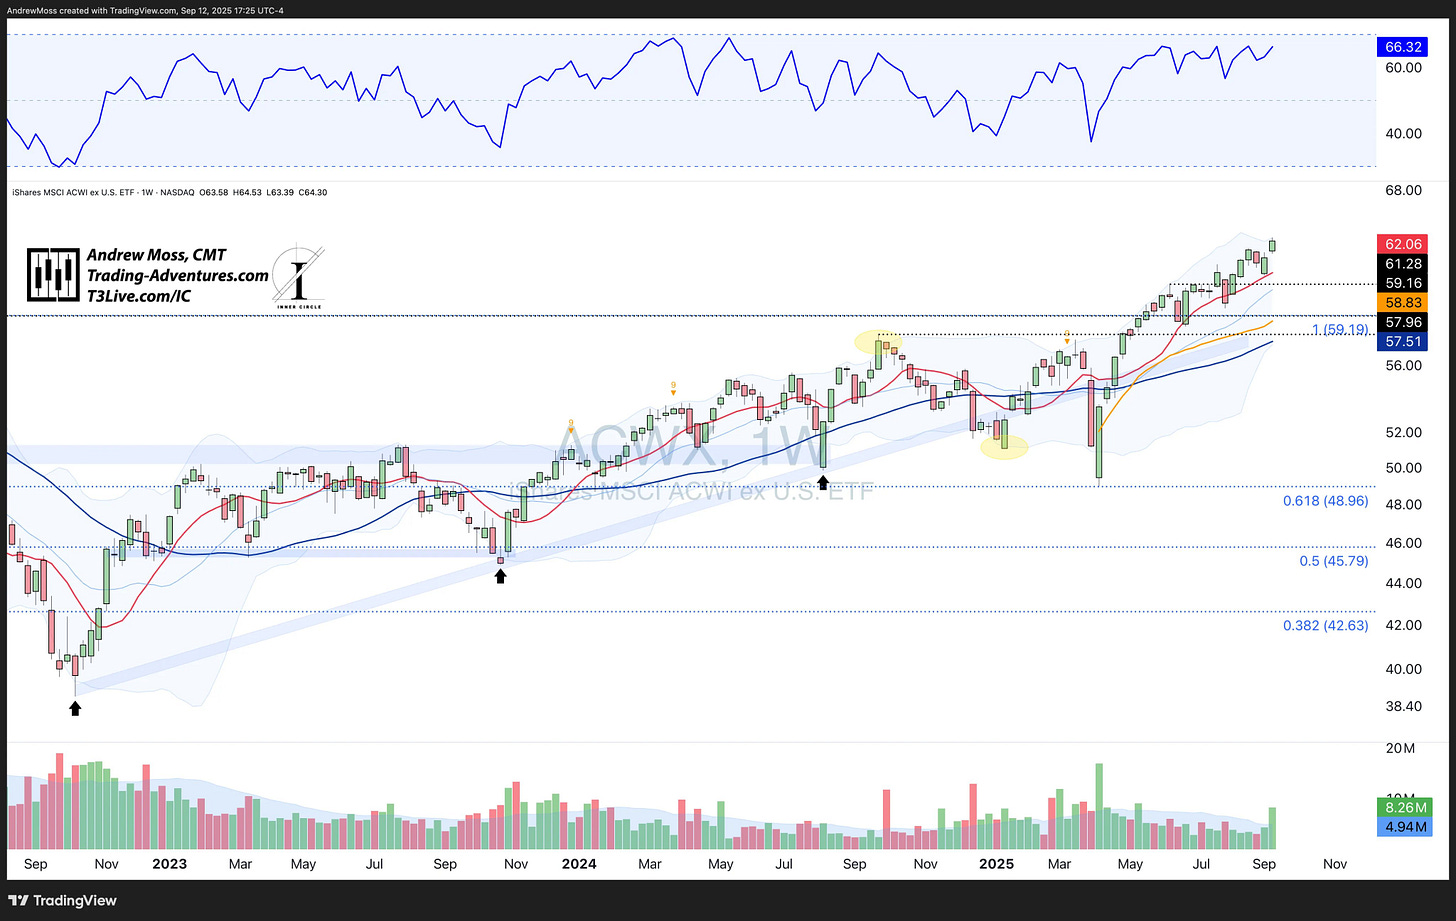
All Country World ex-US (ACWX):
✅ New YTD high
🔊 Volume strongest since March
📈 RSI holding in the mid-60s
“Rest of world” showing steady strength.
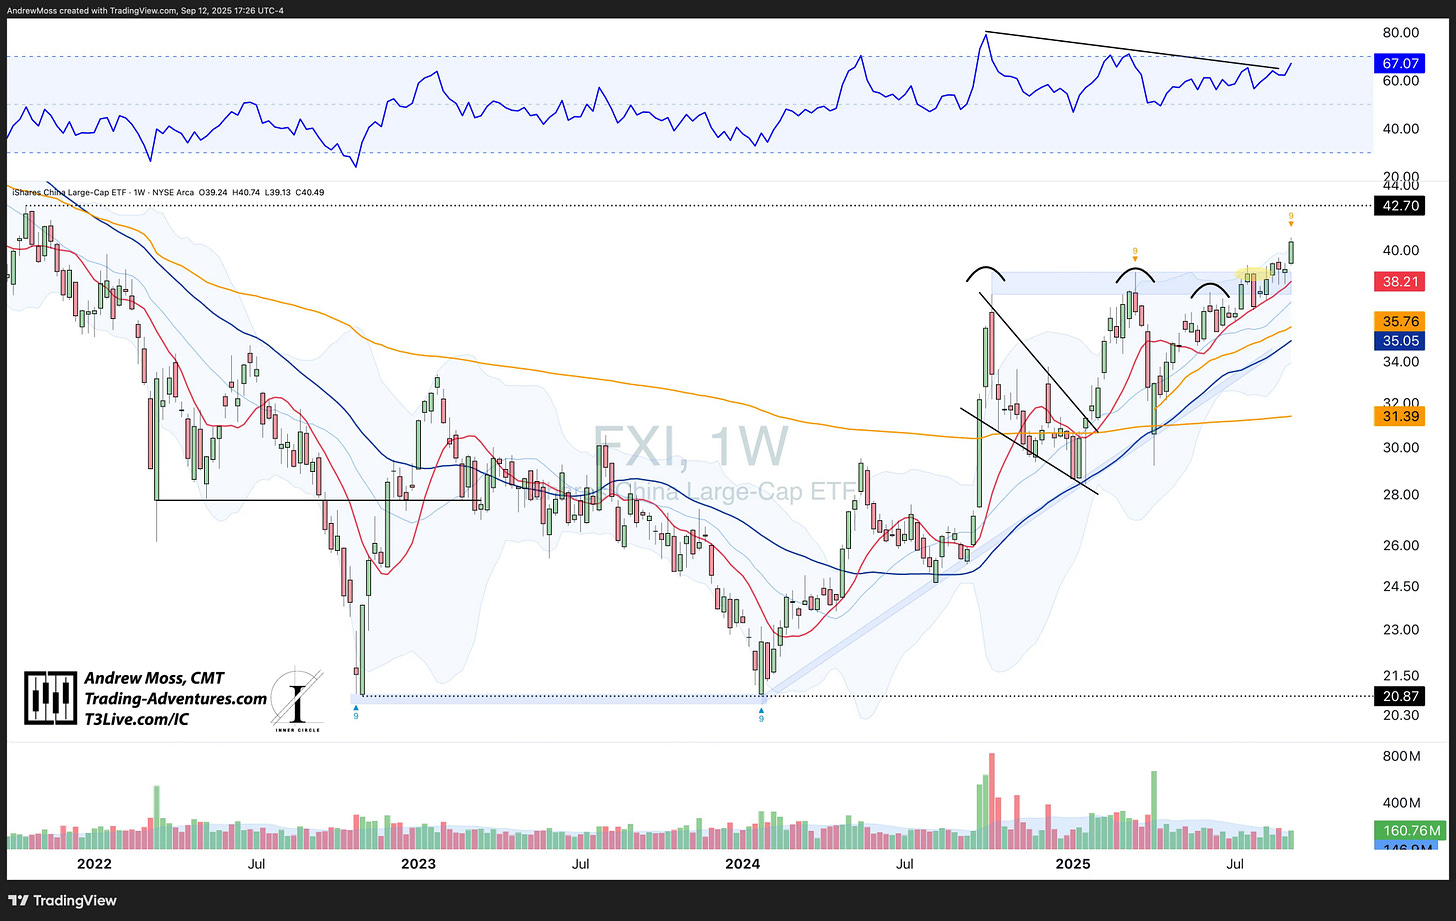
China (FXI):
🔹 Pressed within ~$2 of 2021 pivot high
🔹 RSI breaking new ground
🔹 Volume average
🔹 DeMark 9 setup suggests a possible pause
Constructive, but not through resistance yet.
Bonds & Commodities
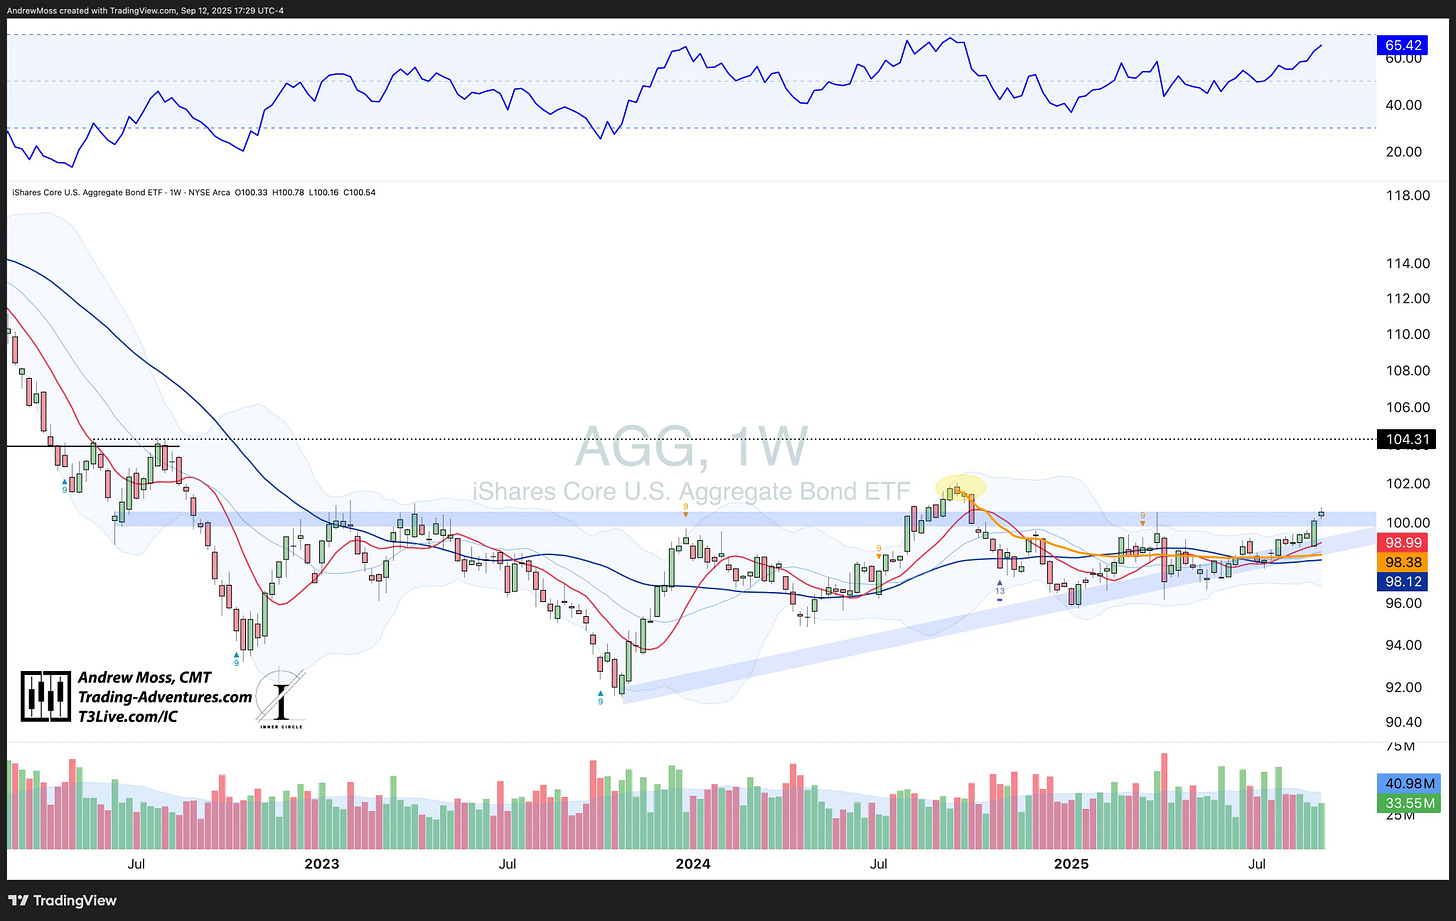
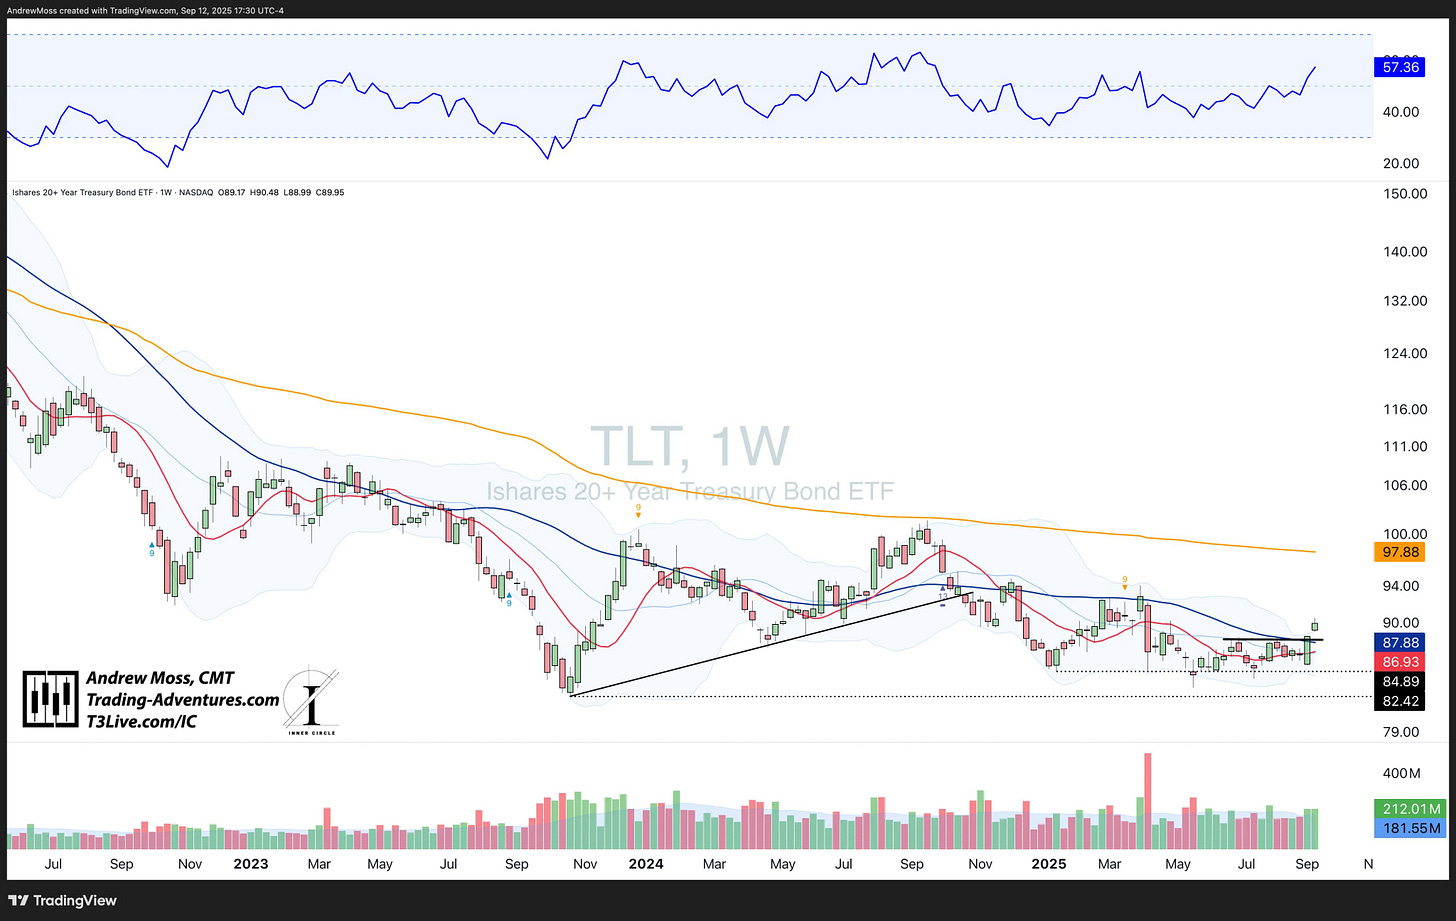
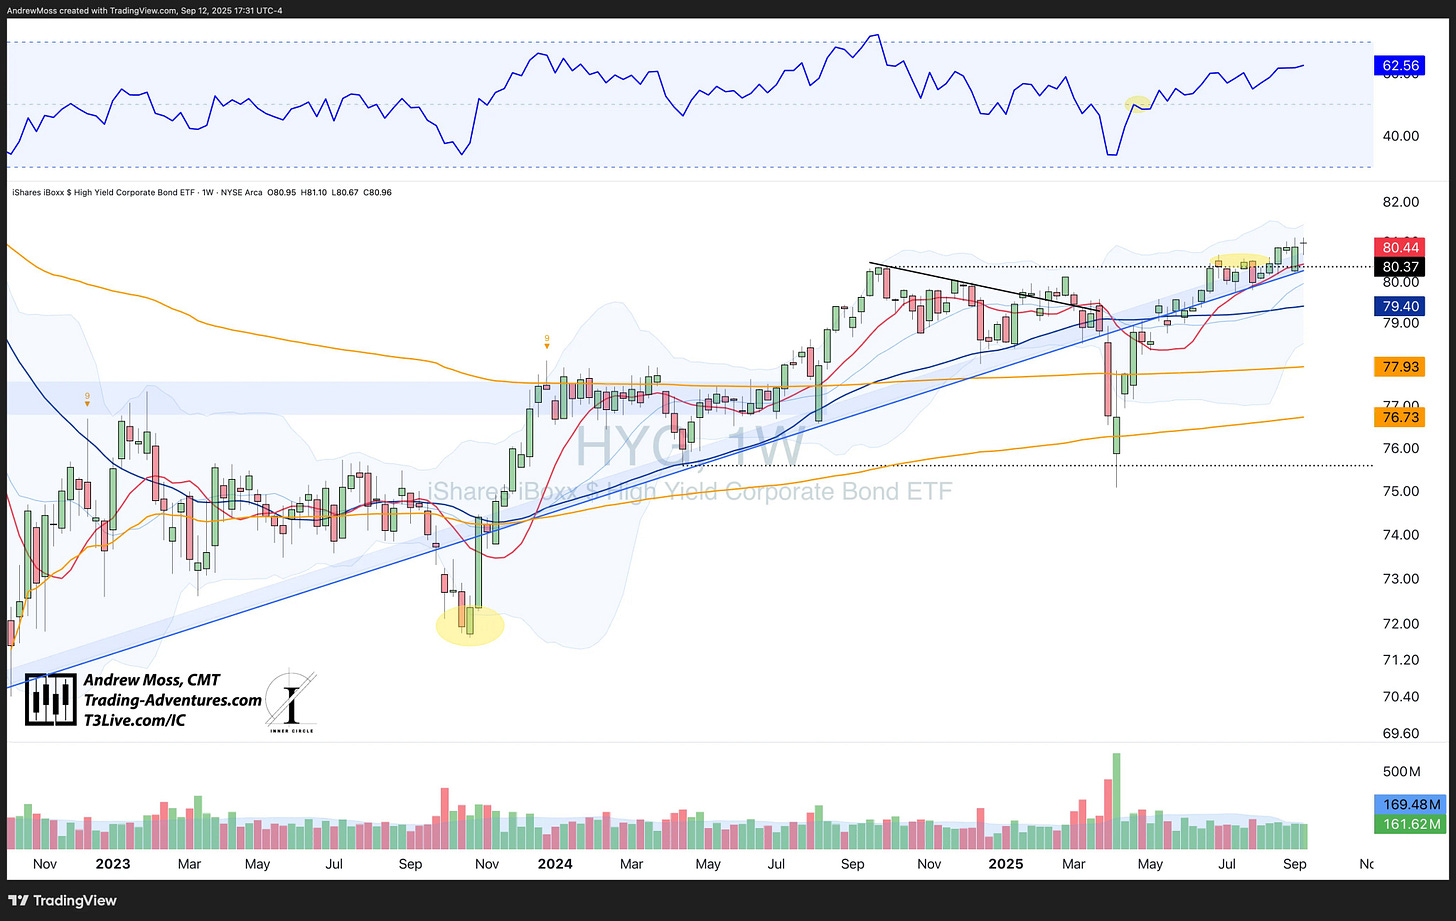
Bonds – AGG / TLT / HYG:
🔸 AGG extended its breakout, pushing above key pivot
🔸 TLT cleared resistance and is holding above major MAs
🔸 HYG hit new multi-month highs in trend
Lower-rate anticipation driving bond strength.
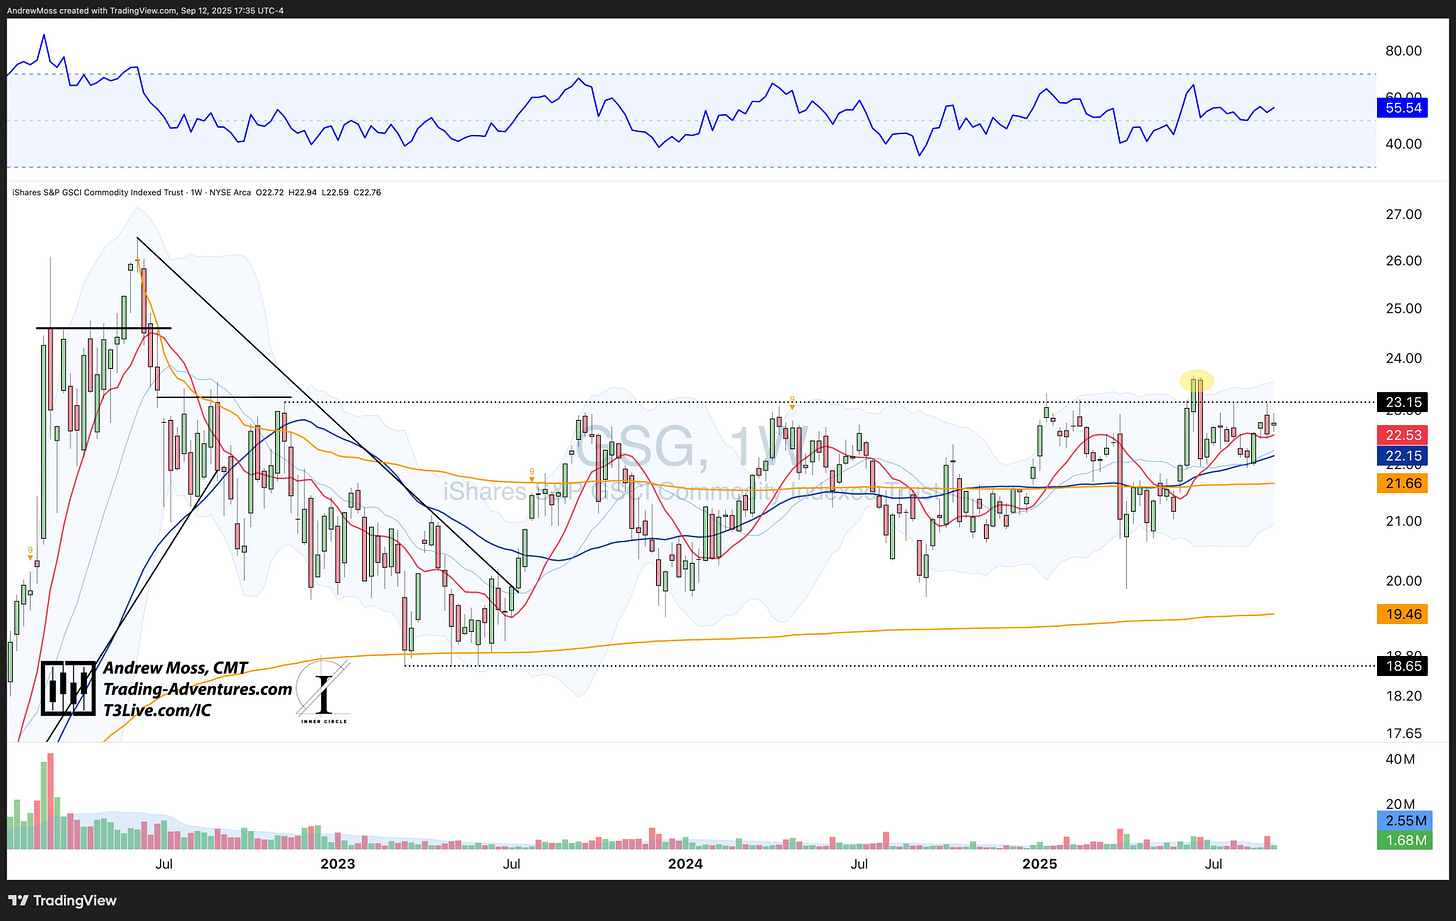
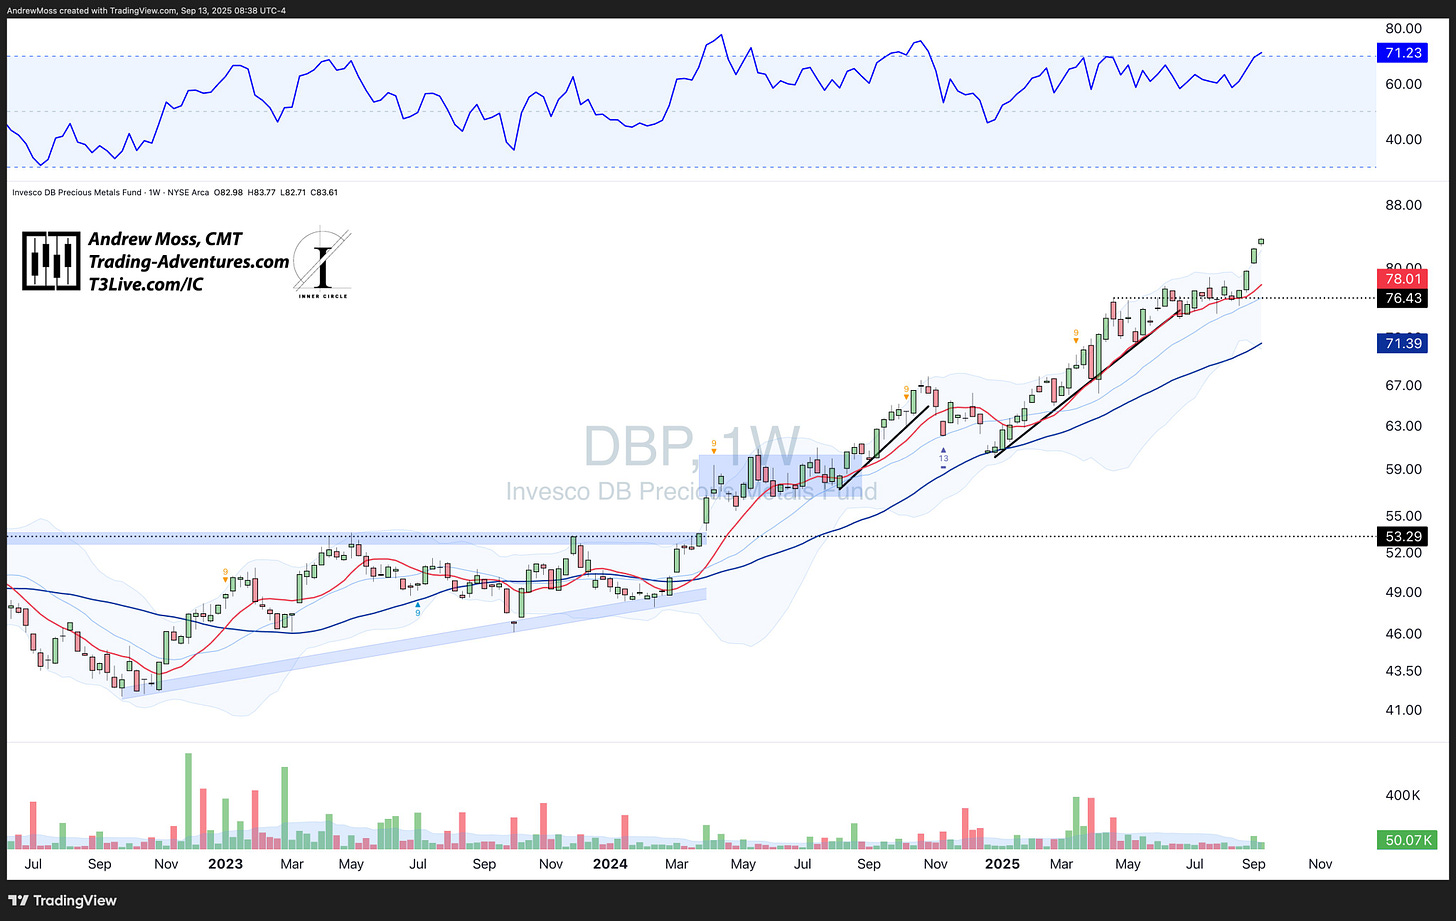
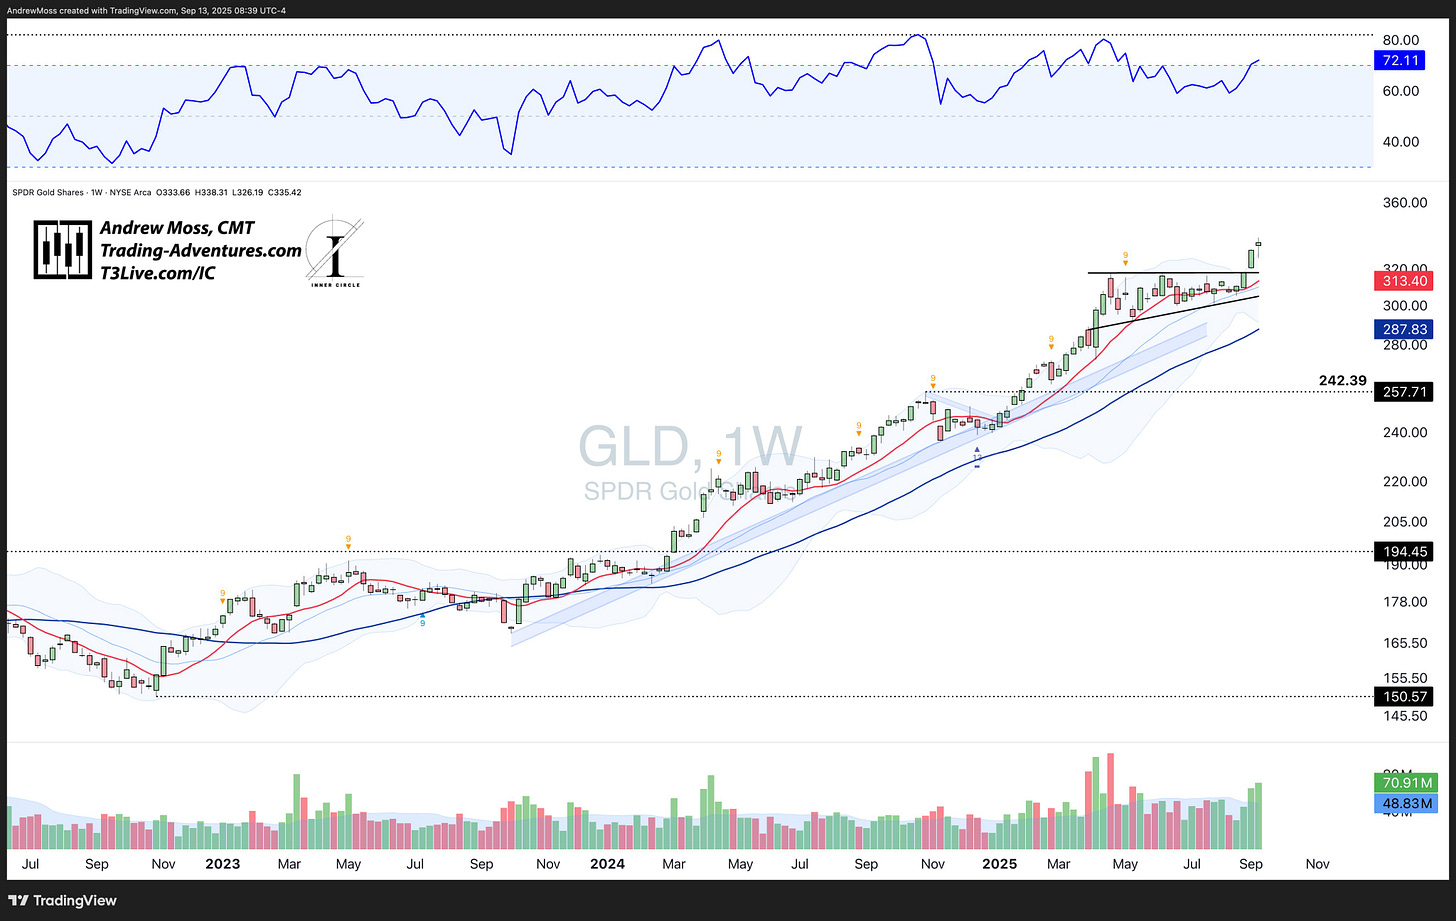
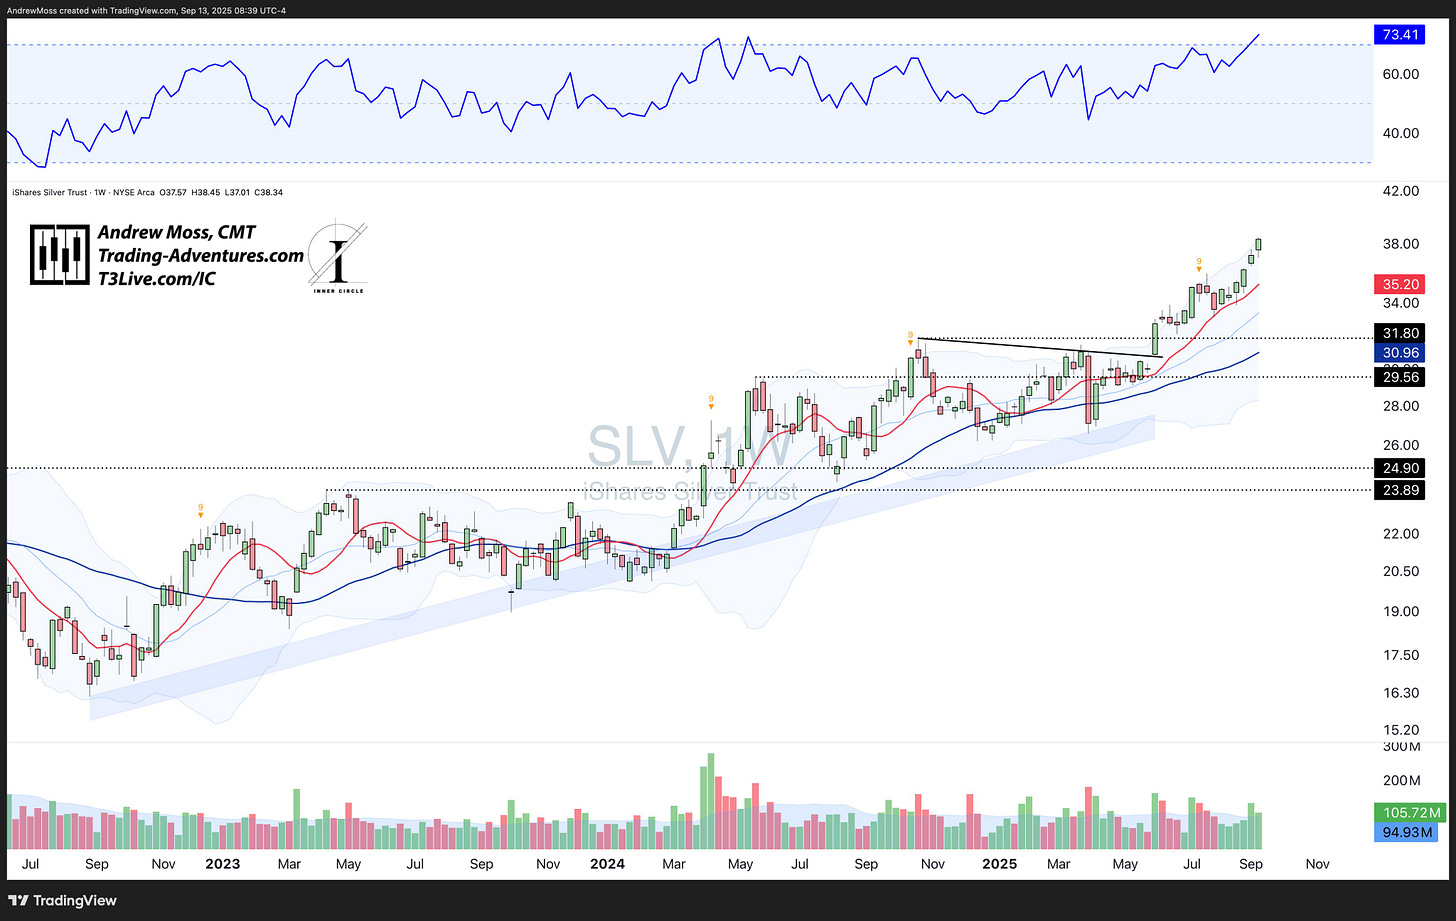
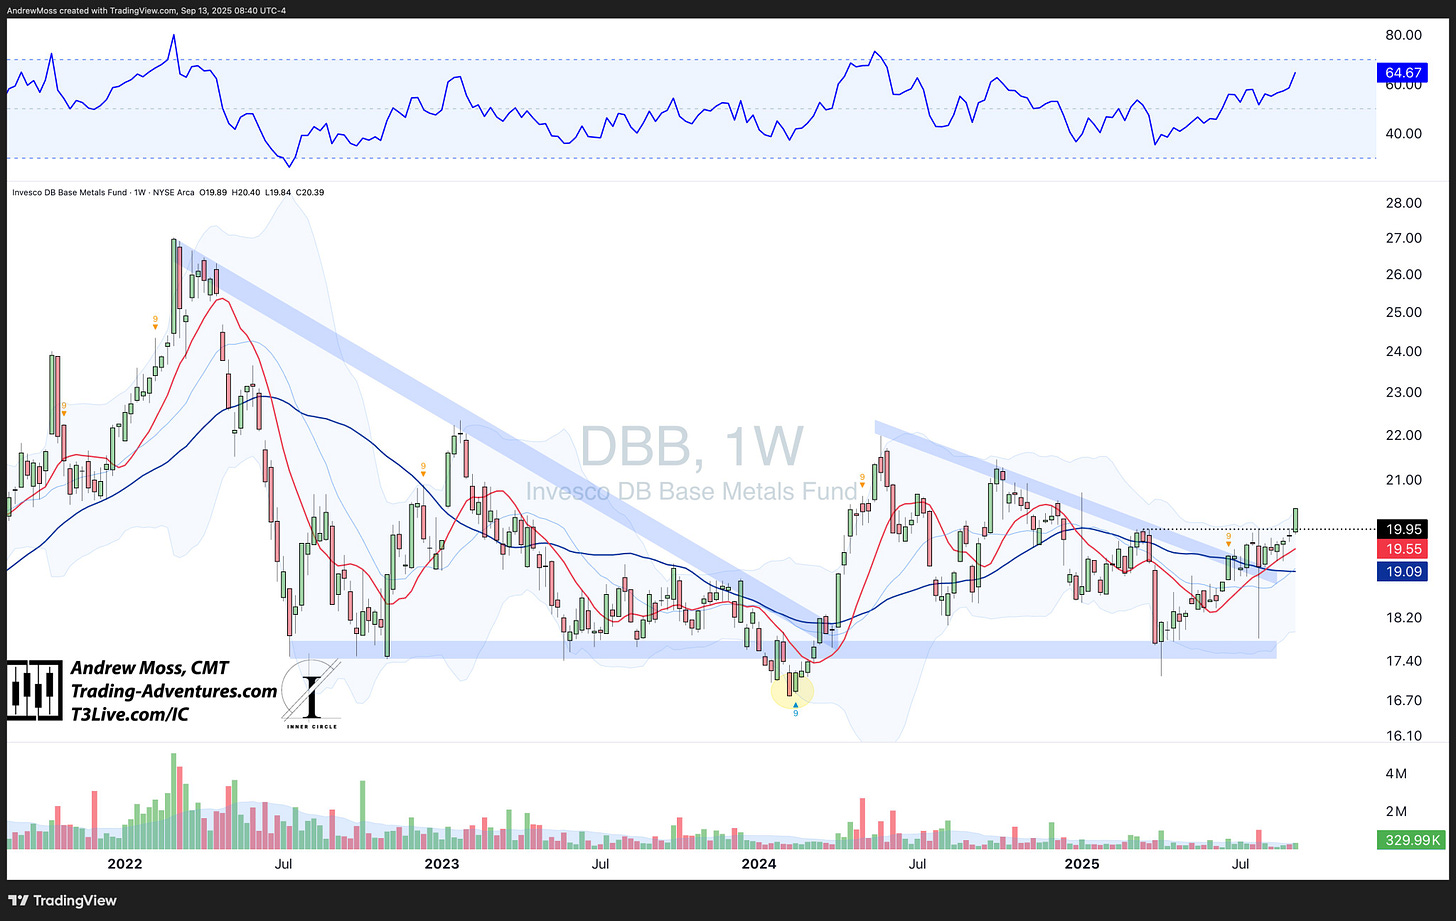
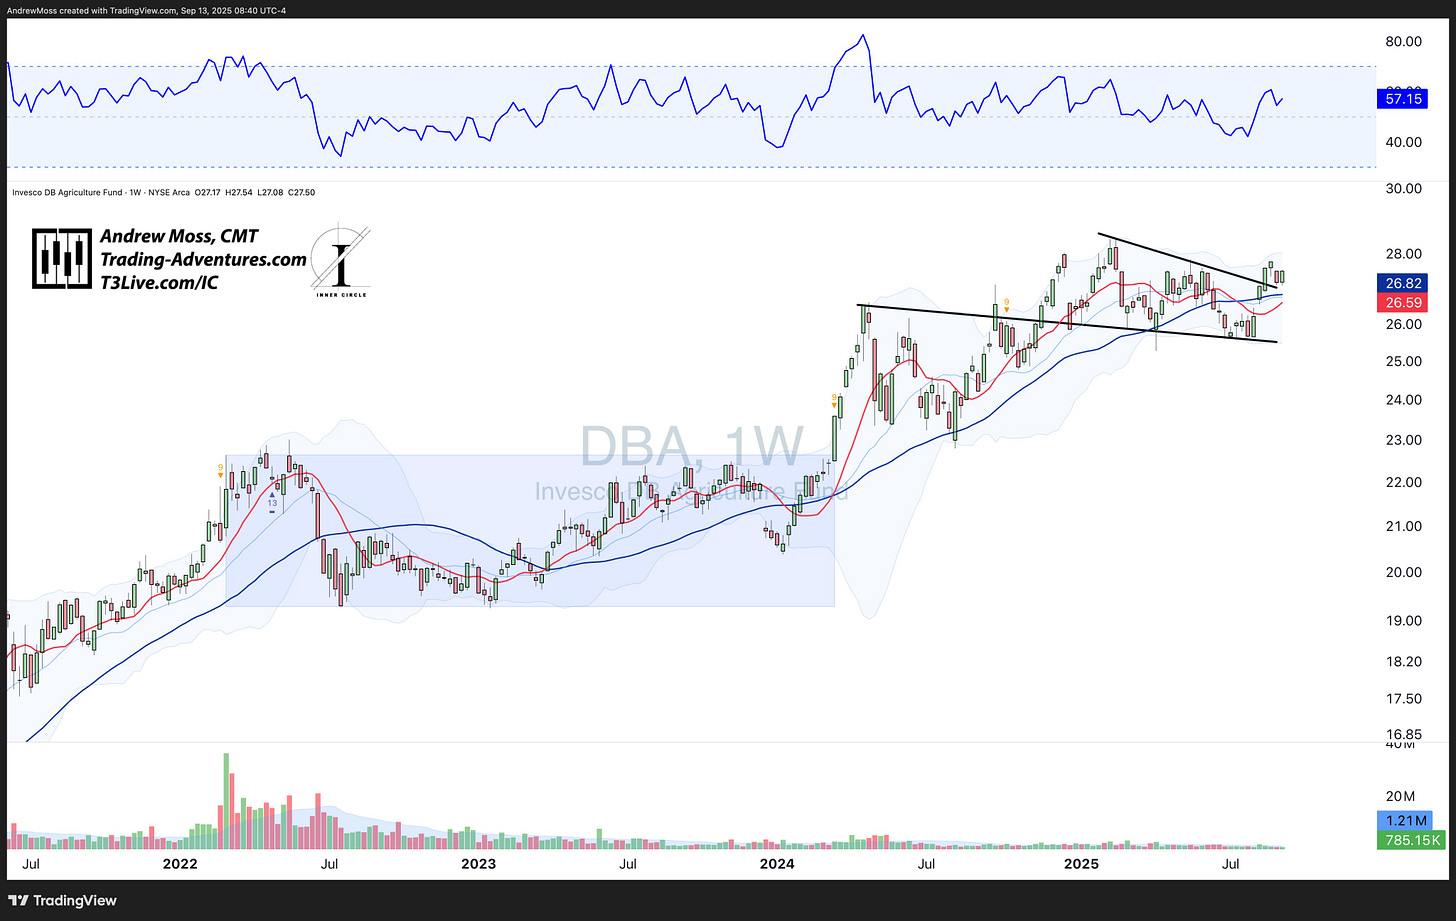
Commodities – GSG, GCC, USCI, DBP, DBA, etc.:
Commodities - as a group - continue to stagnate. At least this grouping. Some others show much more upward progress. GCC and USCI, for instance.
Note to self: compare the constituency across the different commodity indices.
Looking inside the group shows something different.
📊 Charts shared without commentary:
Precious Metals: DBP, GLD, SLV
Base Metals: DBB
Agriculture: DBA
Some segments are showing impressive strength.
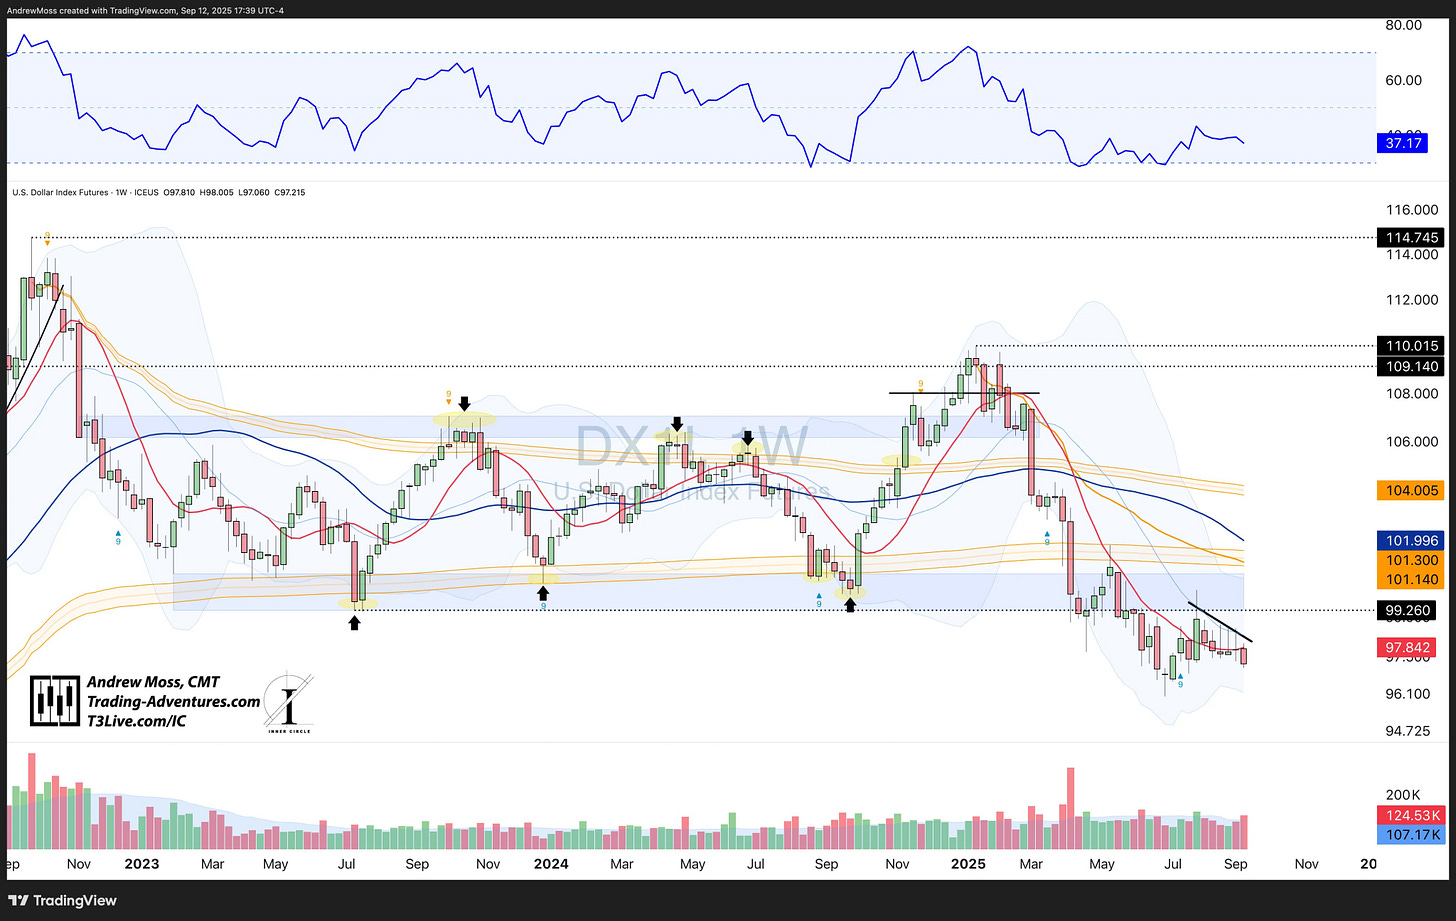
U.S. Dollar: Stuck in the Same Struggle
U.S. Dollar Index (DX1! / DXY):
🔹 Still stuck mid-range
🔹 Long upper shadows = persistent selling pressure
Dollar weakness continues to support risk.
₿ Crypto Check
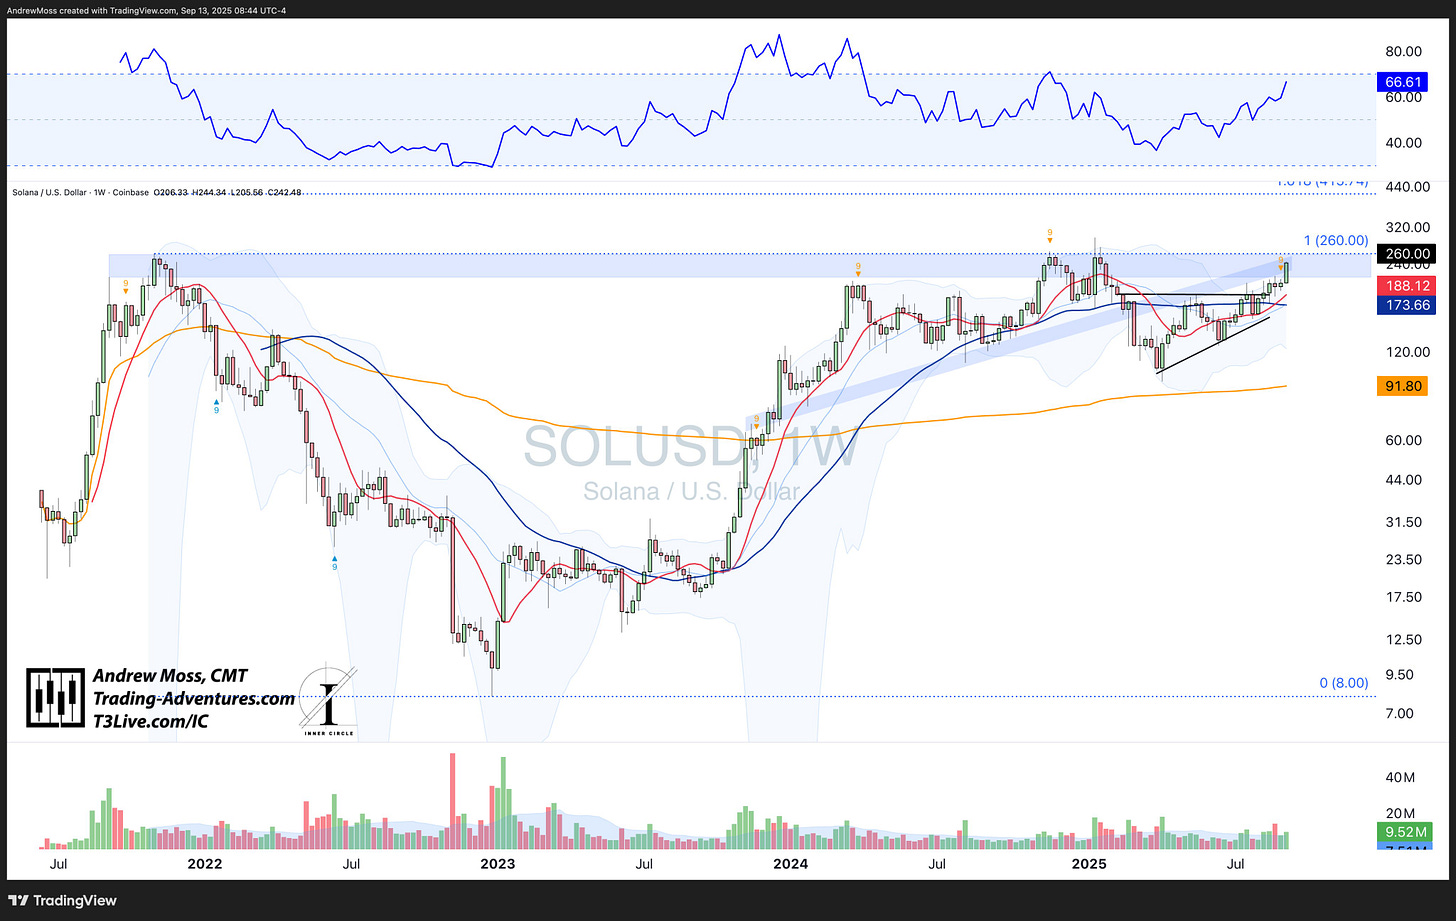
Solana (SOL): deserves the top spot this week.
🔹 Surged into the pivot zone near $260
🔹One of the week’s strongest crypto performers
🔹 Structure remains bullish, with no signs of exhaustion
🔹 Volume picked up, confirming the move
Clear relative strength.
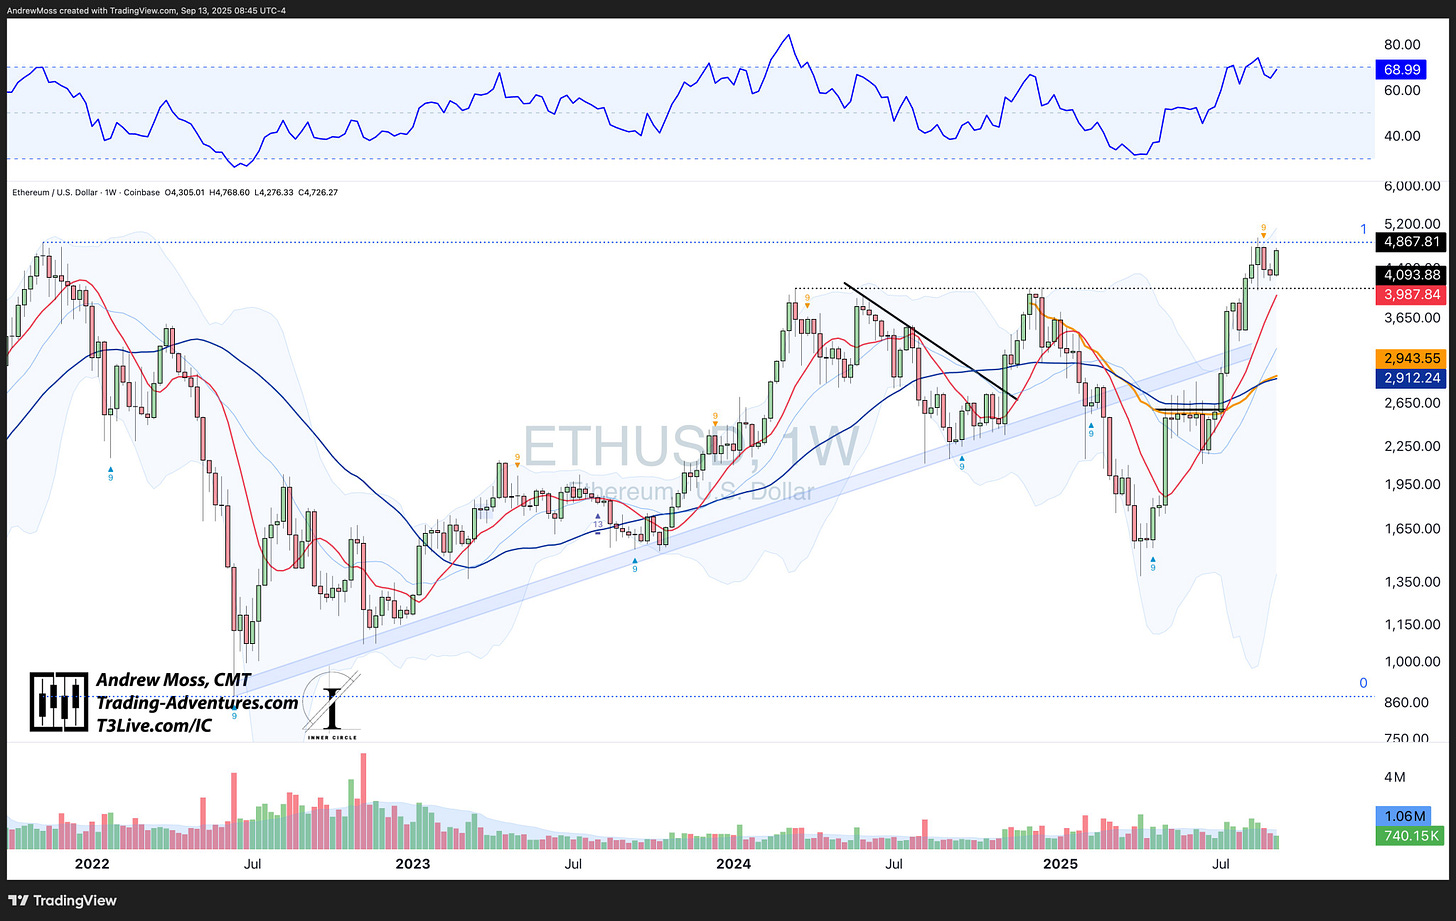
Ethereum (ETH):
Also had a big week, bouncing back nicely from the DeMark 9 sell setup and resulting pullback.
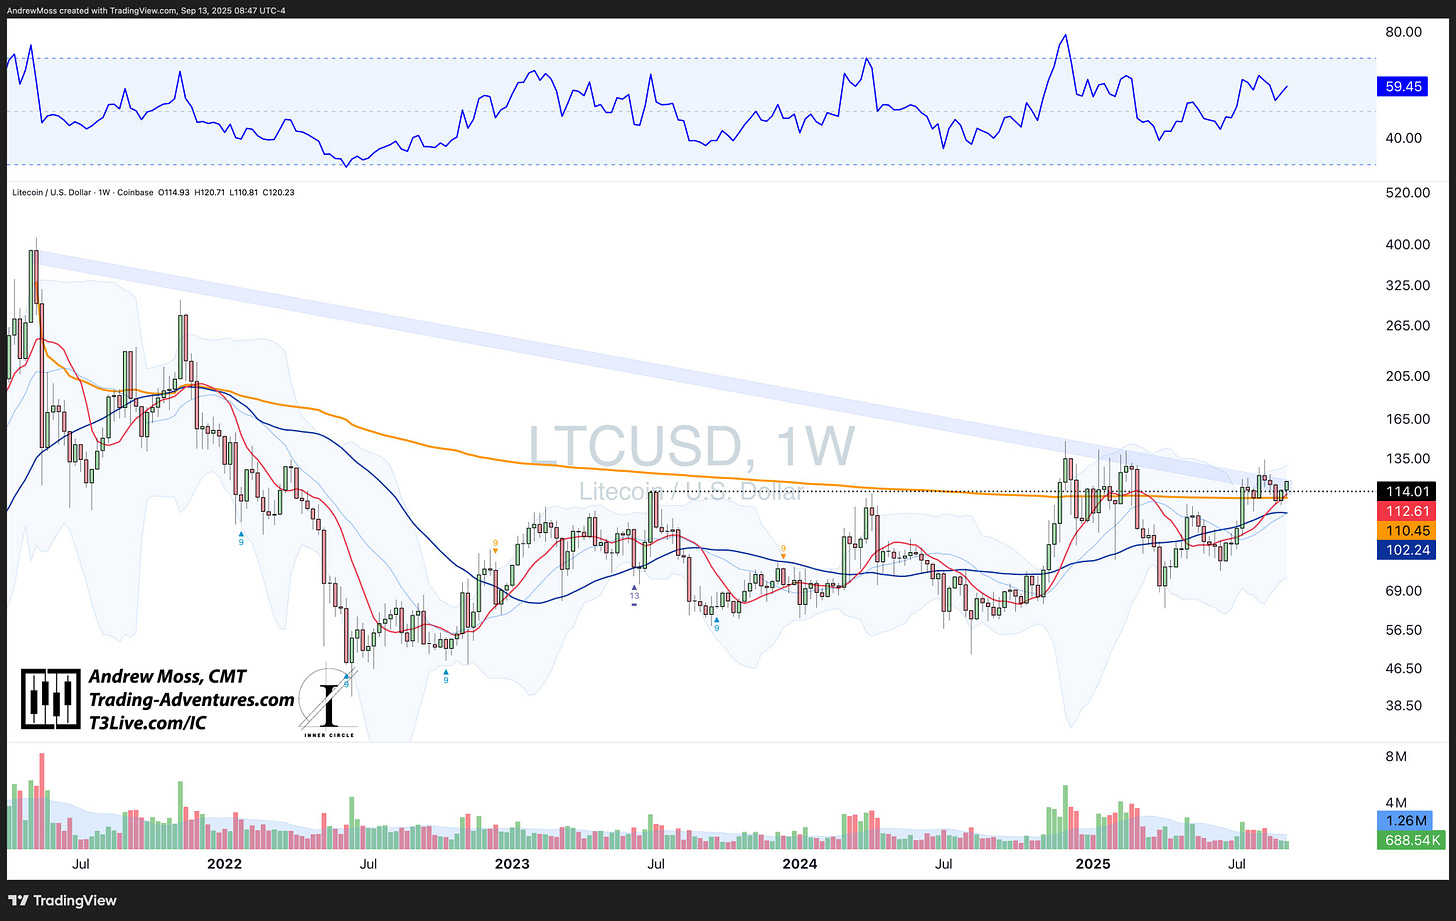
Litecoin (LTC):
🔹 Positive week, holding above key moving averages
🔹 Structure remains intact, but upside follow-through is lacking
🔹 Still stuck below downtrend resistance
🔹 RSI stable — neither stretched nor weak
Holding ground, but still needs a catalyst.
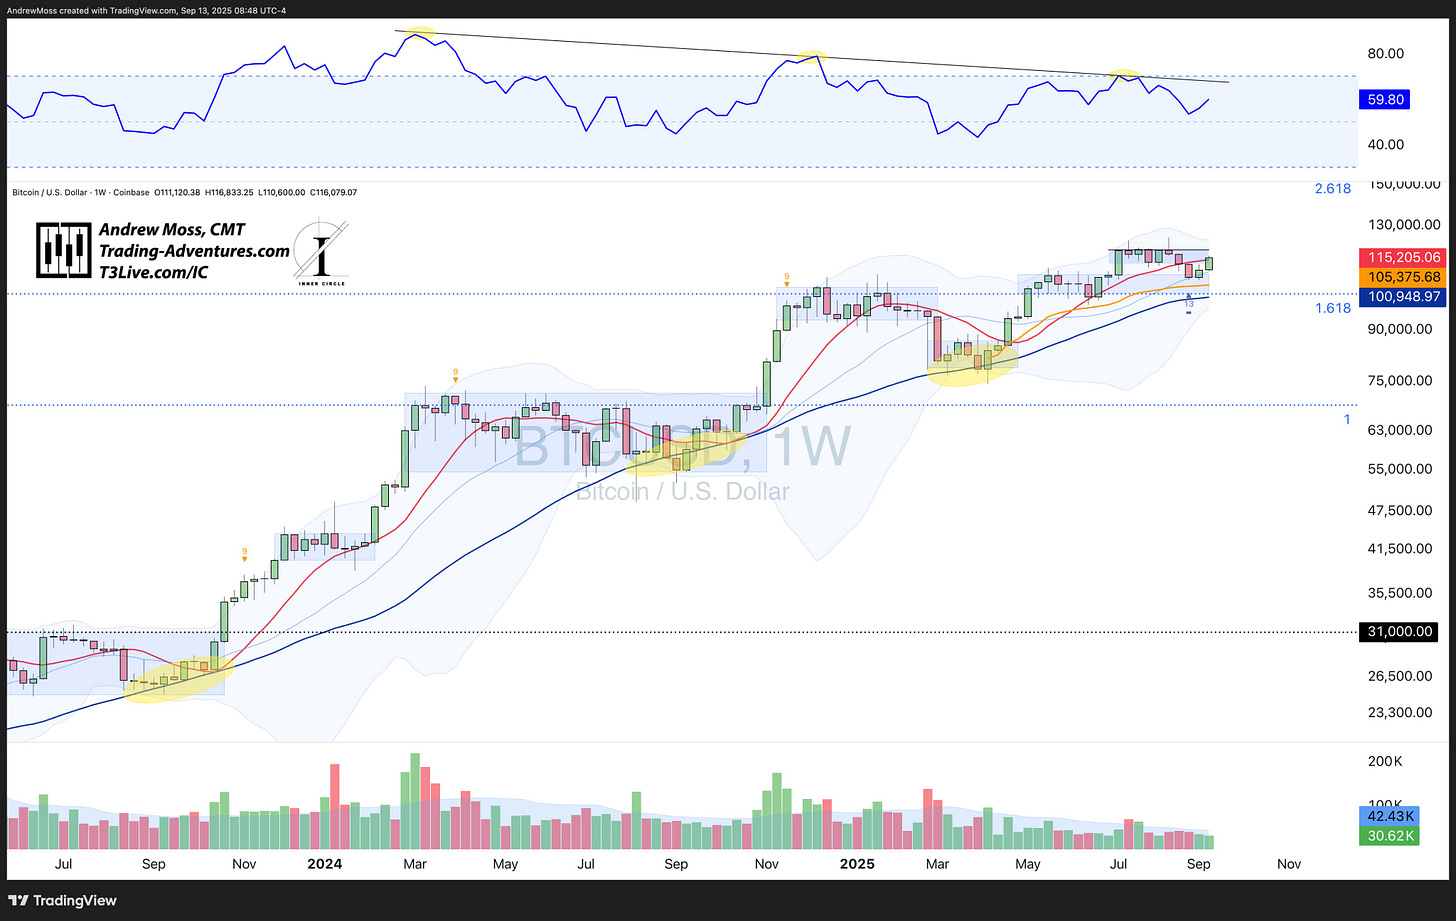
Bitcoin (BTC):
🔹 Rebounded with the broader crypto space, but still lagging peers
🔹 Structure remains choppy — not bearish, just indecisive
🔹 Volume has been light
It's trying to participate — but not leading.
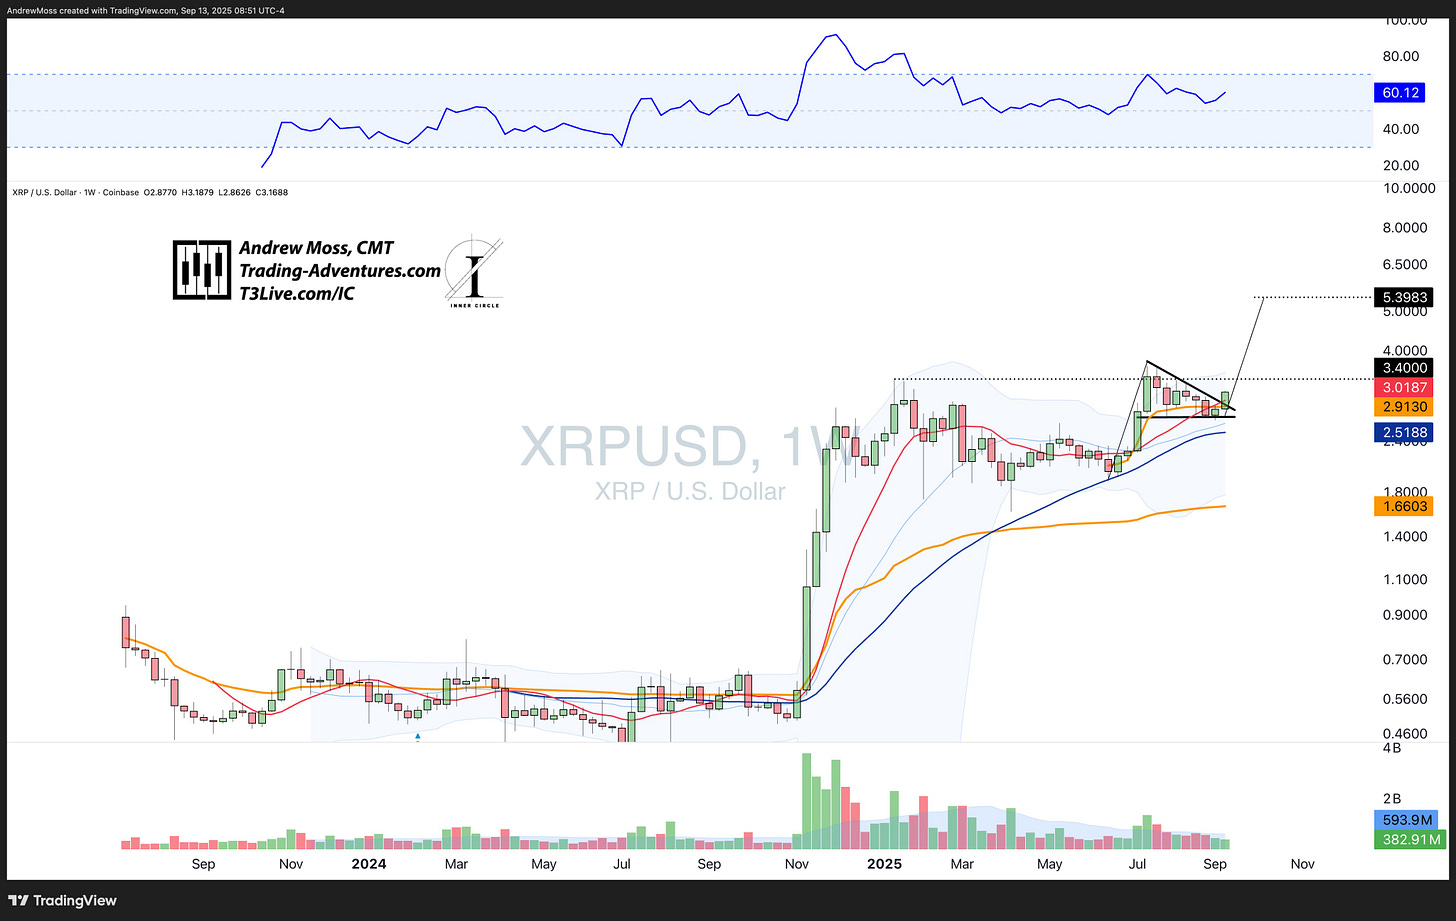
XRP (Ripple):
The pattern has changed, but the potential measured move price objective remains.
Relative Strength & Participation
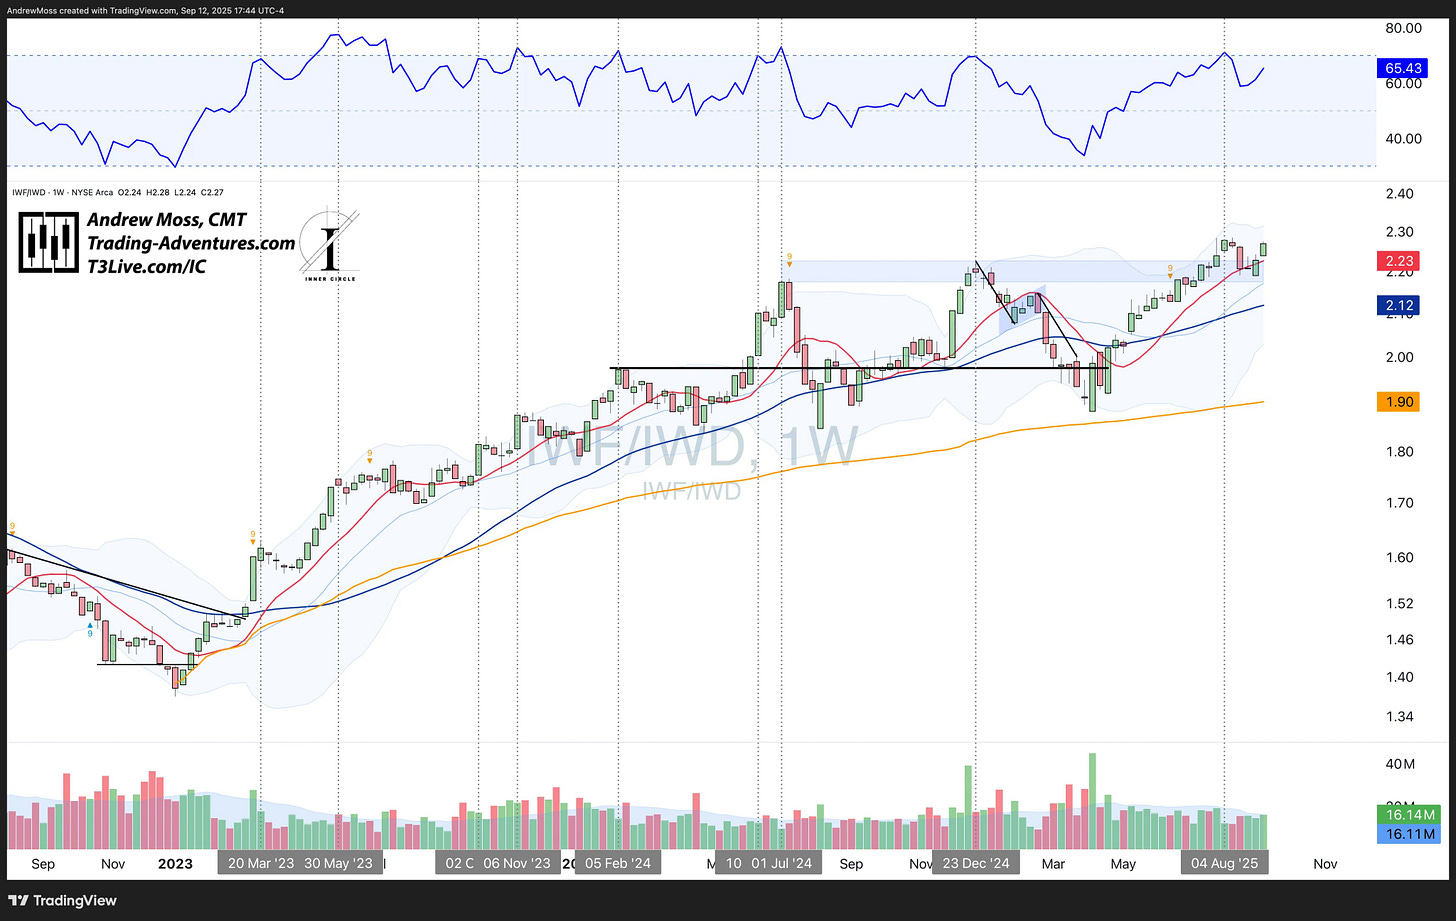
Value vs Growth (IWF vs IWD):
Growth reasserted itself after a brief RSI shift toward value. This week’s move reaffirms risk appetite and favors momentum.
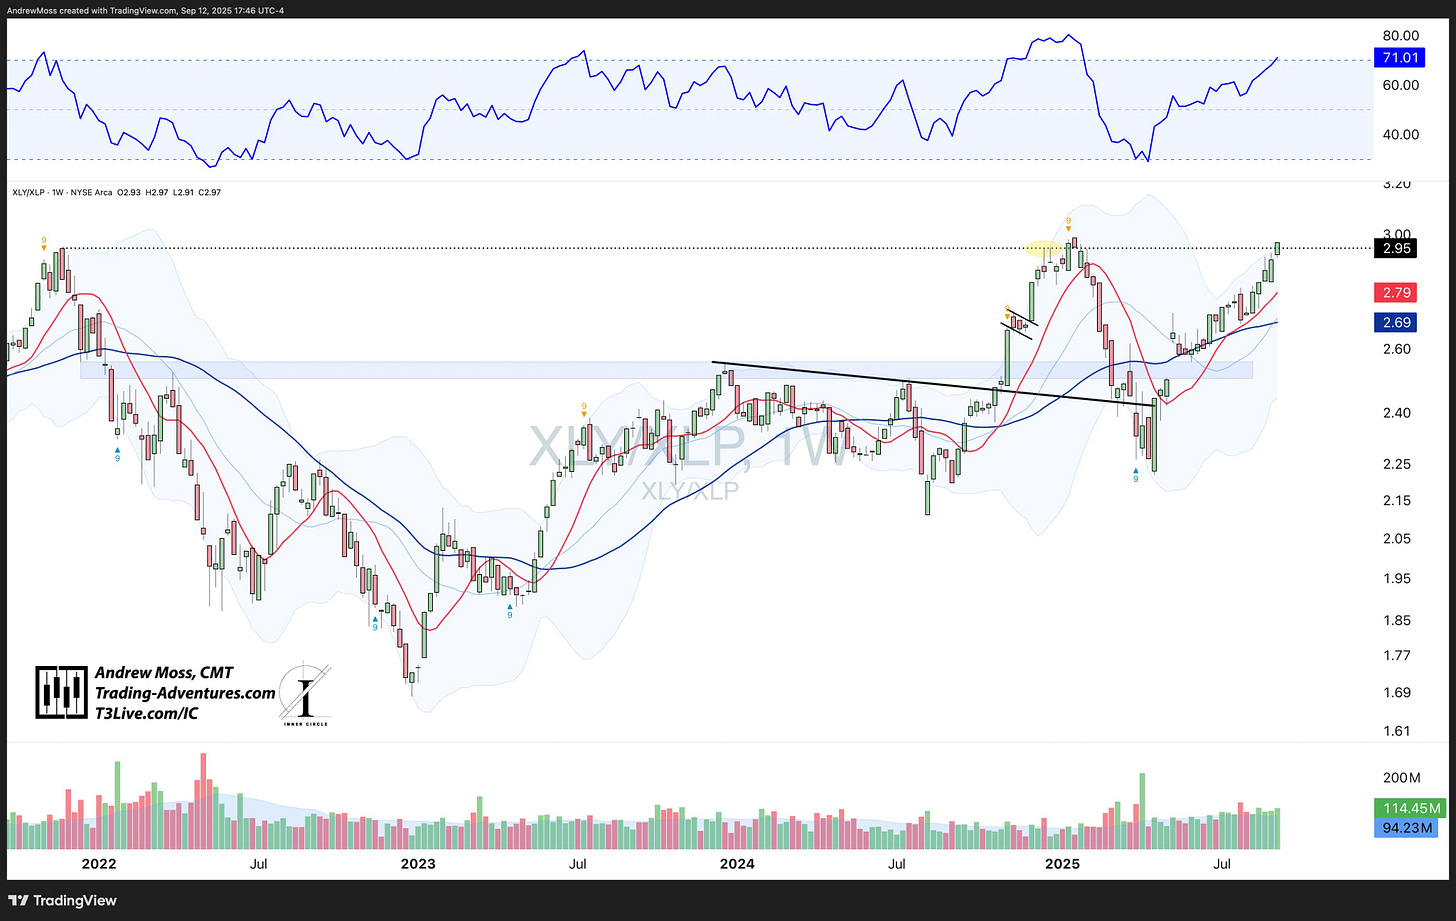
Discretionary vs Staples (XLY vs XLP):
Growth reasserted itself after a brief RSI shift toward value. Now approaching recent highs — another vote for offense.
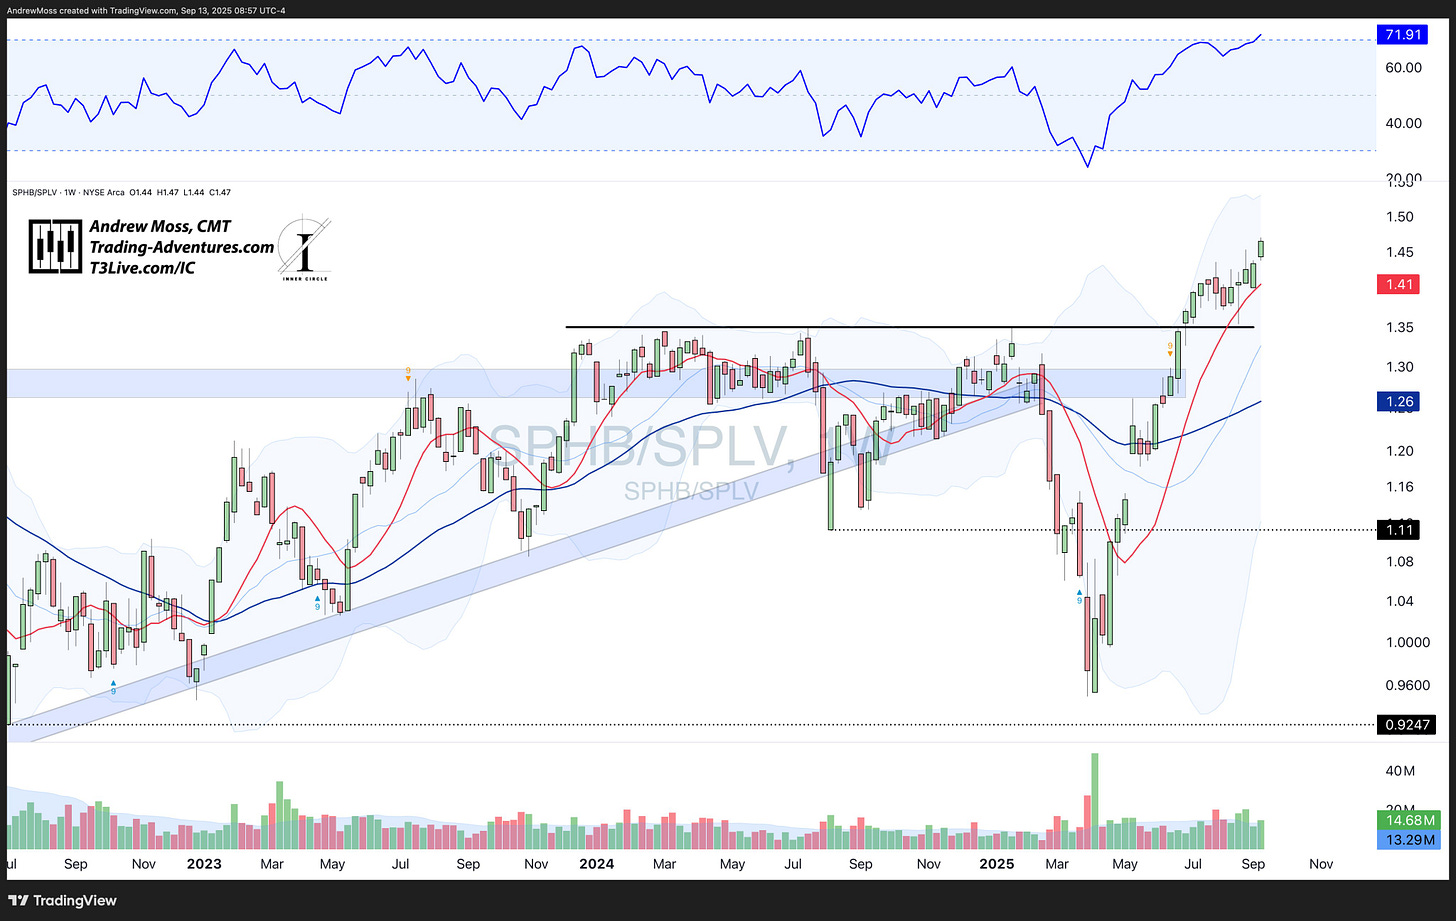
High Beta vs Low Volatility (SPHB vs SPLV):
High Beta surged ahead — risk appetite strengthening.
For more on Relative Strength, see the Chart School lesson:
Breadth: Quiet Strength Under the Surface
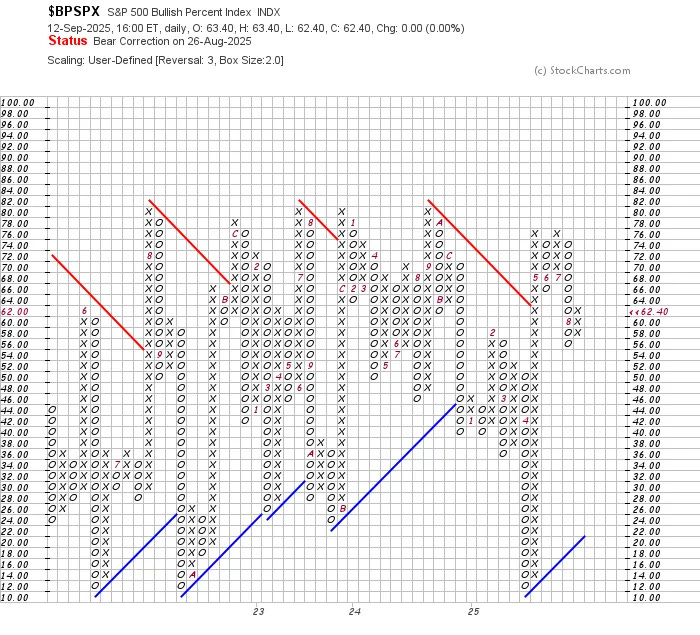
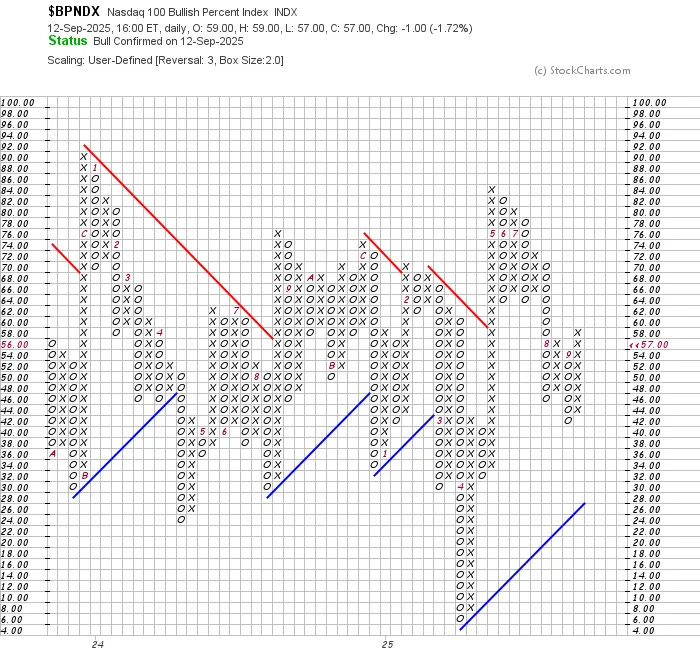
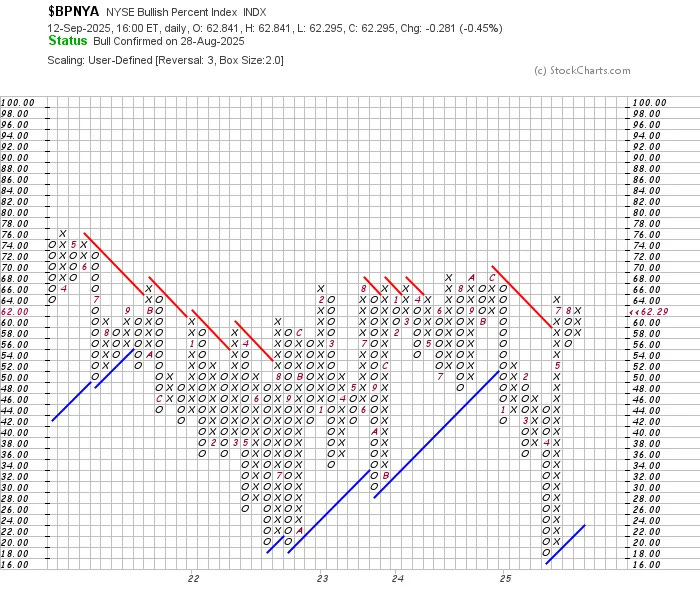
Bullish Percent Indices
$BPSPX - SPX: has done exactly nothing since our last check-in
$BPNDX - NASDAQ: Added a new column of Os, then quickly reversed into a higher column of Xs
$BPNYA - NYSE: Also unchanged — stuck in the same column$BPSPX – S&P 500
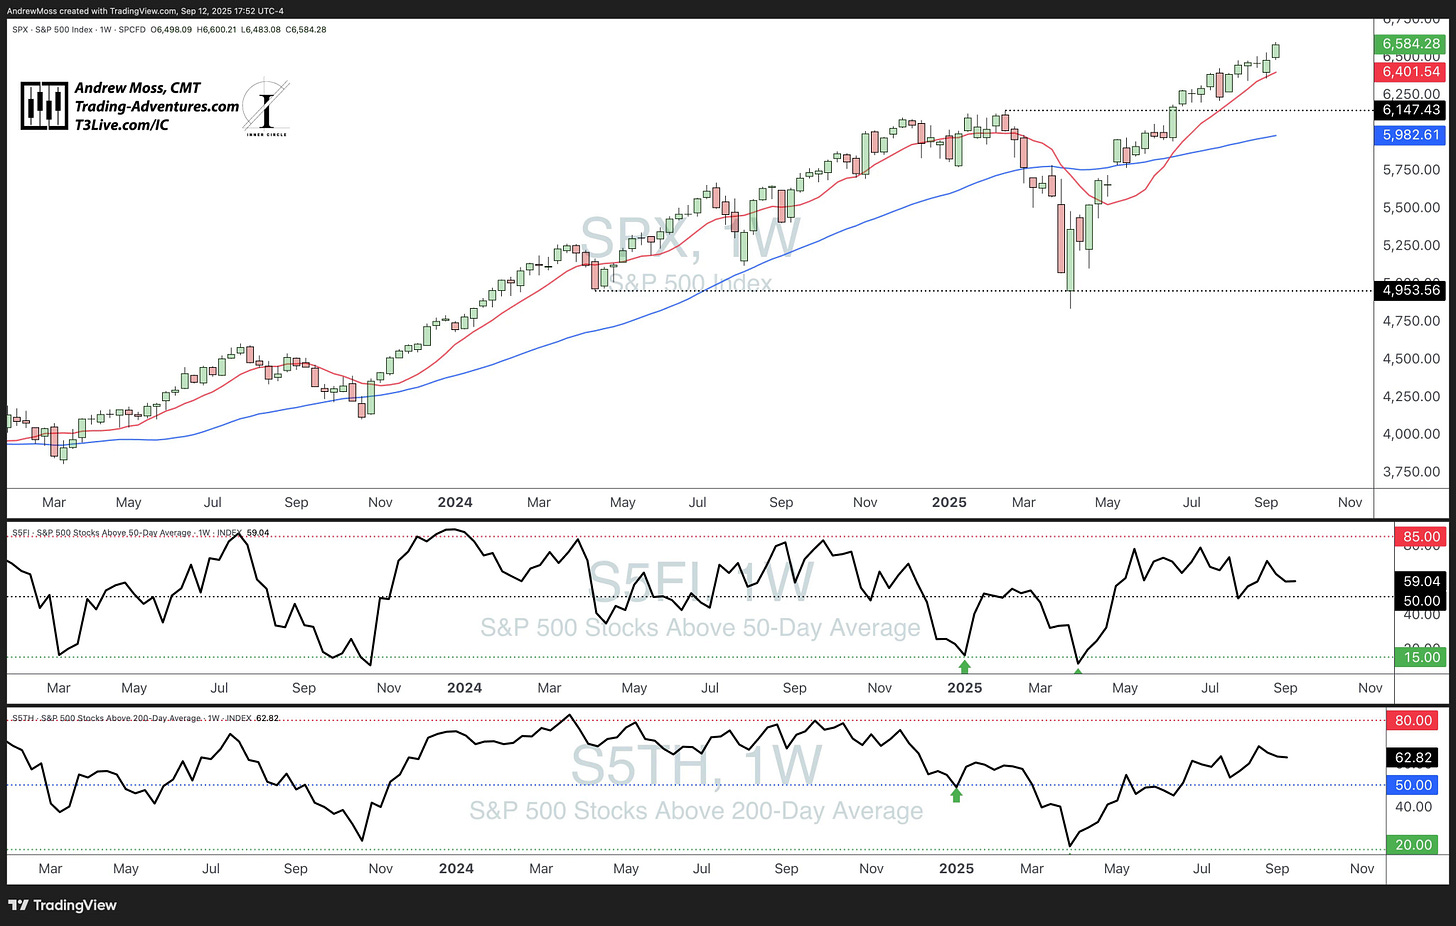
SPX % Above 50/200 MAs
Still riding well above the 50% level
Typical back-and-forth, but no major deterioration
Breadth remains quietly constructive under the surface.
Understanding the Bullish Percent Index
A timeless signal of internal strength, built on point & figure roots.
Now What?
Short-Term:
- Short-Term
Markets are strong. New highs continue to stack up.
Participation is broad and healthy.
FOMC decision looms — rate cut odds are high, but still uncertain.
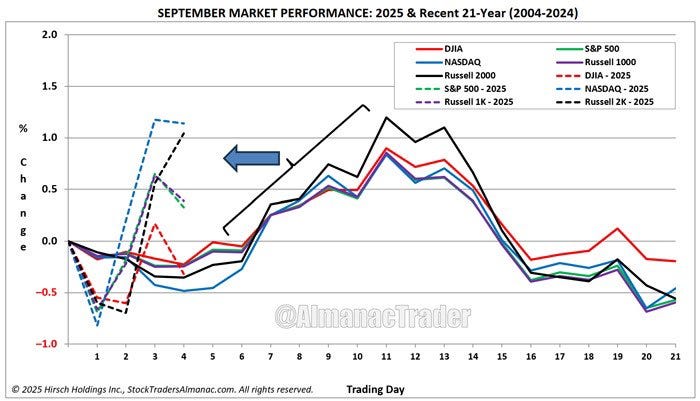
Seasonal headwinds remain a risk, even if they’re being ignored for now.
Jeff Hirsch shared this at the TSAA-SF Conference last week. It's a good consideration.
Could an FOMC rate cut this week be a 'sell the news' event?
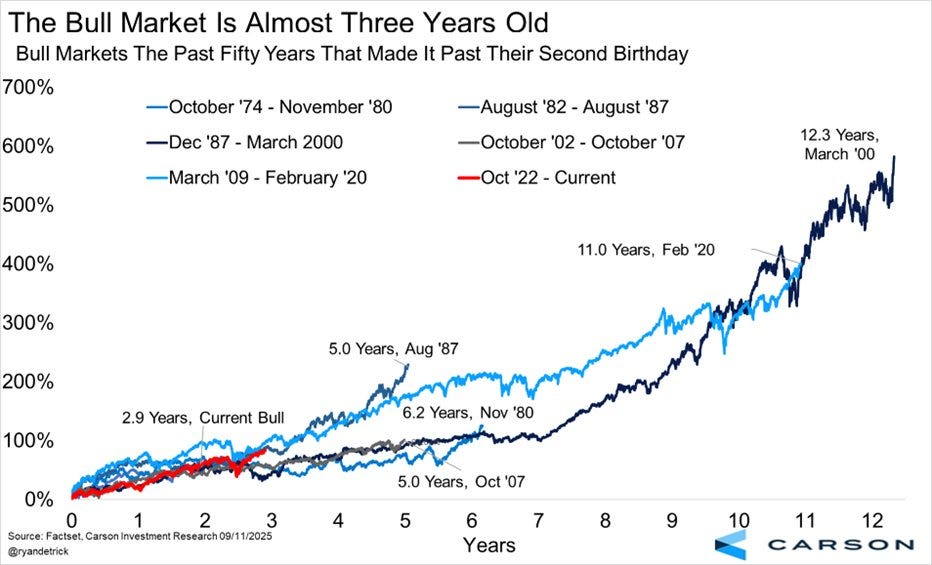
Looking out further -
Trends are intact.
Leadership is clear.
Participation is strong.
Here’s Ryan Detrich with a look at the cycle.
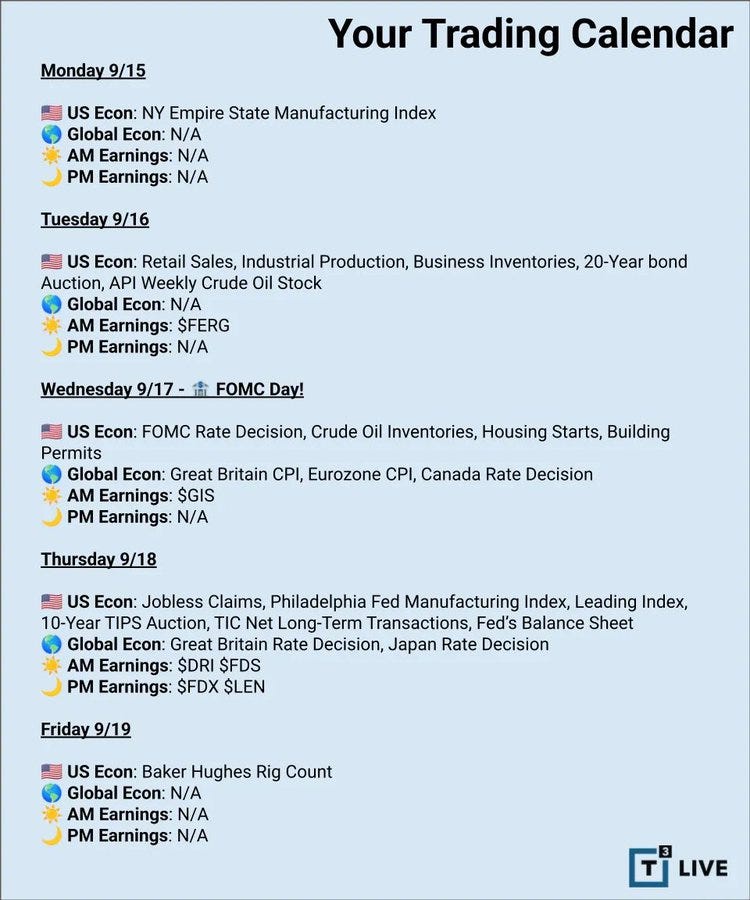
📅 The Week Ahead
🔹 FOMC on Wednesday — key risk event
🔹 Minimal earnings / econ data otherwise
🔹 Quad witching Friday = potential volatility
Stay sharp. Let price lead.
ICYMI
My recap of the TSAA-SF conference is out. It was truly an honor to be there. Many sharp minds shared great insight and deep market discussions.
Read it all here.
🧠 Final Thoughts
That’s it for this week’s look at the 📈Weekly Charts📉. Each week, I share this to help you see what I’m seeing and prepare for what’s ahead.
📈 Market structure
📊 Breadth and participation
🧠 Sentiment, macro shifts, technical confirmation
It’s all part of a process. And preparation is everything.
Thanks for Reading
If you’ve found these weekly breakdowns useful, here’s how you can help keep them coming — consider a paid subscription:
All posts remain public. No locked content. Just charts, signals, and steady updates to help you navigate markets with confidence.
And don’t forget to Like ❤️ Comment 💬 Share 🔁 too.
—Andy
Looking For More?
Elevate Your Trading Adventure Even Further With These Offerings.
The Disclosures
***This is NOT financial advice. This is NOT a recommendation to buy, sell, or trade any security. The content presented here is intended for educational purposes only.





Hi Andrew, I read you article almost every week. Like it. But one little suggestion, can you use simple "dot" format to start with the dot point. As I use "ReadAloud" app to reading your article is cause some annoyance with all the fancy "Dot". Your help would be much appreciated.