The Markets
Earlier this week, when the SP500 was struggling near its 50-day MA and heading lower, the sentiment was dropping in sync with prices, and bears were starting to growl more loudly.
As Helene Meisler loves to remind us,
“Nothing like price to change sentiment.”
There’s no way the bottom can actually be in.
A move below the 200-day would surely bring failure and doom to stocks.
That’s what “they” were saying.
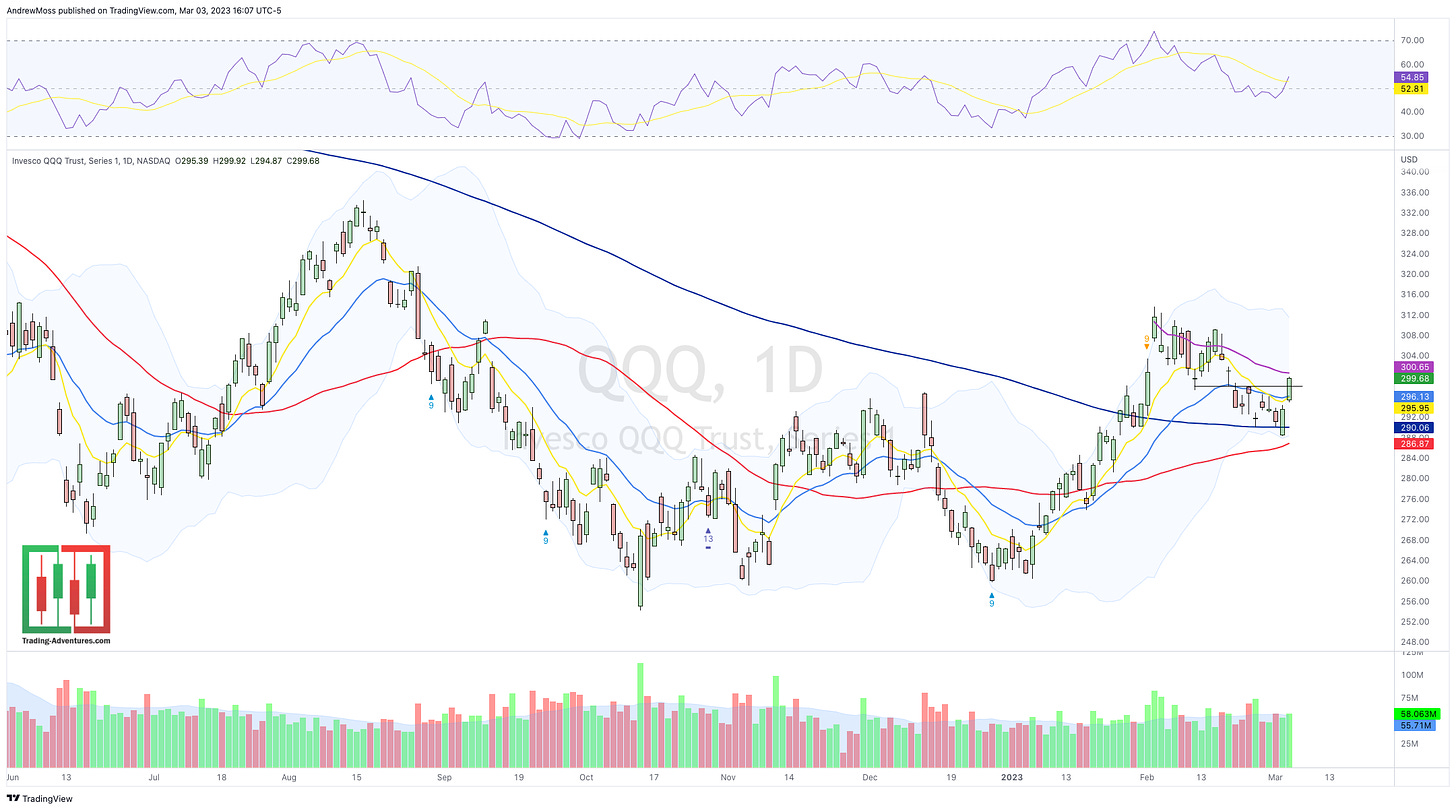
But some were having a different conversation. In the monthly chart review, it was noted that QQQ had traded basically flat for the last seven months.
And you may recall this from an earlier Midweek Market Update - Classic Bull Market Action.
When stocks “should” do something, and they don’t, that’s useful information. When stocks rally on lackluster, or even disappointing news, that’s also useful information.
When stocks don’t break down even though they look like they should, it can be a signal.
David Prince summed it up nicely here as I referred back to the flattish QQQ chart.


Finally, from Wednesday’s chart review.
“SP 500 stocks on average aren’t doing much. That includes not breaking down.”
These kinds of subtle occurrences can be very telling.
That’s not to say that it’s been easy. Having an idea of how markets may behave even a few hours from now has been incredibly difficult in this headline-driven environment.
But when stocks don’t behave or react in the way they should……you know the rest.
The good news?
There have been plenty of reasons for stocks to go down sharply. But, they haven’t.
Support held and buyers stepped in right where they needed to.
The bad news?
It took comments from a Fed official to ignite the rally.
But that’s not really bad news. It can be frustrating to navigate a market that seems to hang on every “next most important headline ever.”
So what. If stocks want to go up, who are we to argue the reasons why. Leave that to economists, the macro folks, and the fundamental analysts.
Our job is to trade the market we’ve got when it gives us opportunities to do so.

The Charts
Note; there are some subtle changes to the chart design. What do you think?
Better or worse?
Easier or harder to read?
SPY - After dipping briefly below the 200-day MA stocks have rallied strongly, moving back above all of the key moving averages. Support held. Buyers have done their job.
Now watch 403-404 as potential resistance, followed by the swing high anchored VWAP above 405, and then the swing high itself around 417.
QQQ is back above the 8, 21, and 200 MAs (never crossed the 50), through 298, and is moving toward the swing high AVWAP at 300+. The swing high around 312 is a spot to watch.
IWM is up and out of the congestion zone and very near its swing high AVWAP. Above that watch 198-200 for potential resistance.
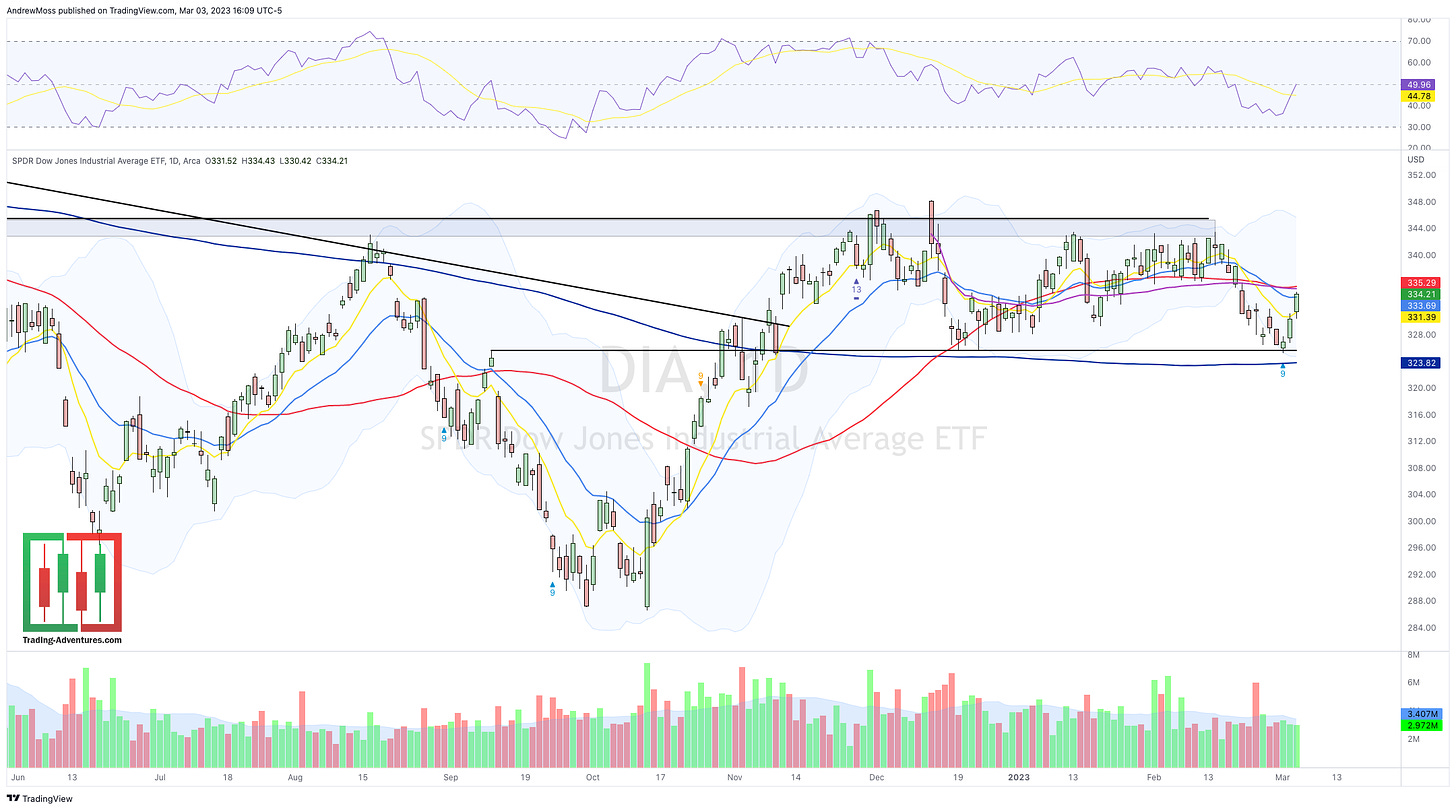
DIA - Dow Industrials got saved right when they needed it most. The index is back above the 8 and 21 EMAs and now must deal with the 50-day MA and the swing high anchored VWAP.
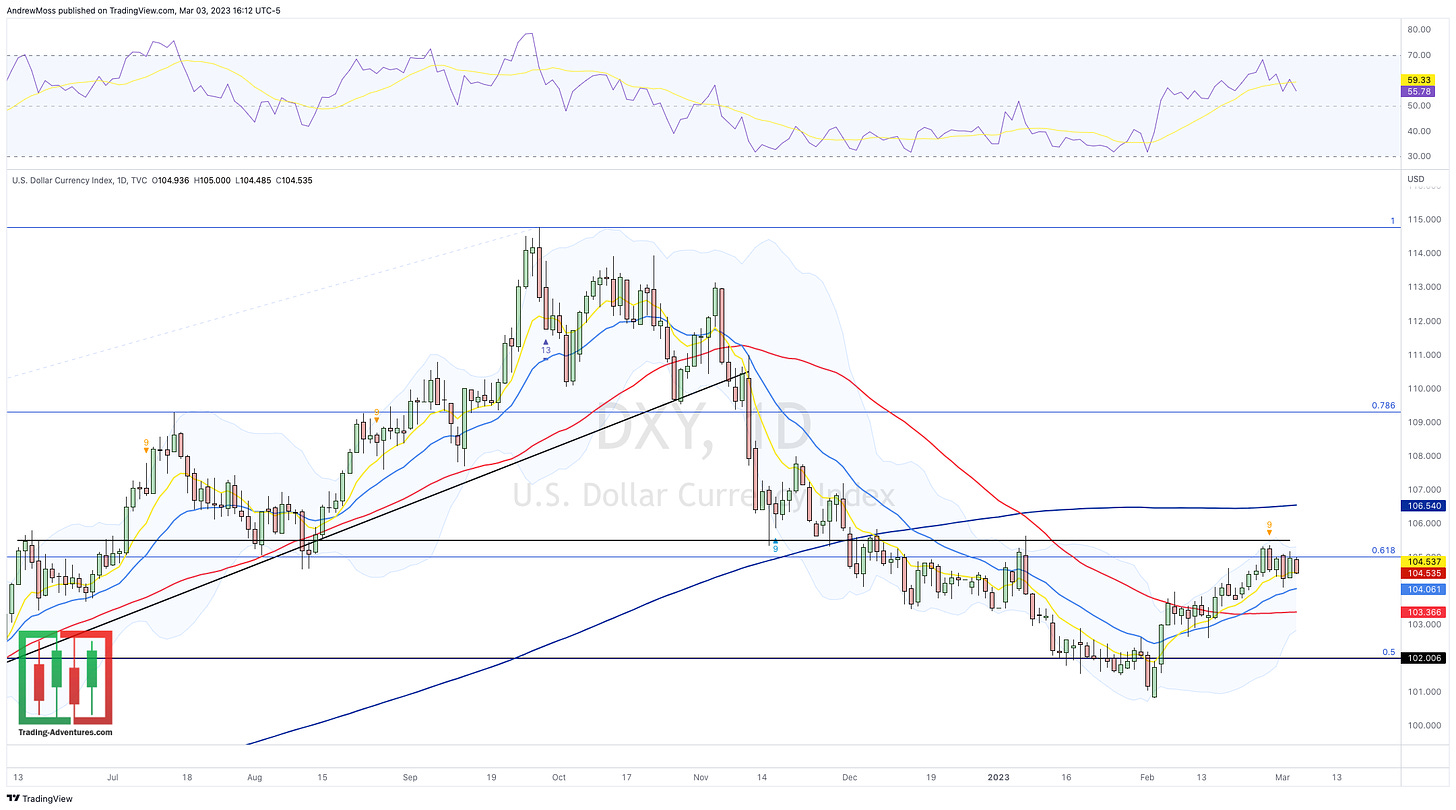
DXY - The Dollar is stubborn as each dip keeps getting driven back higher.
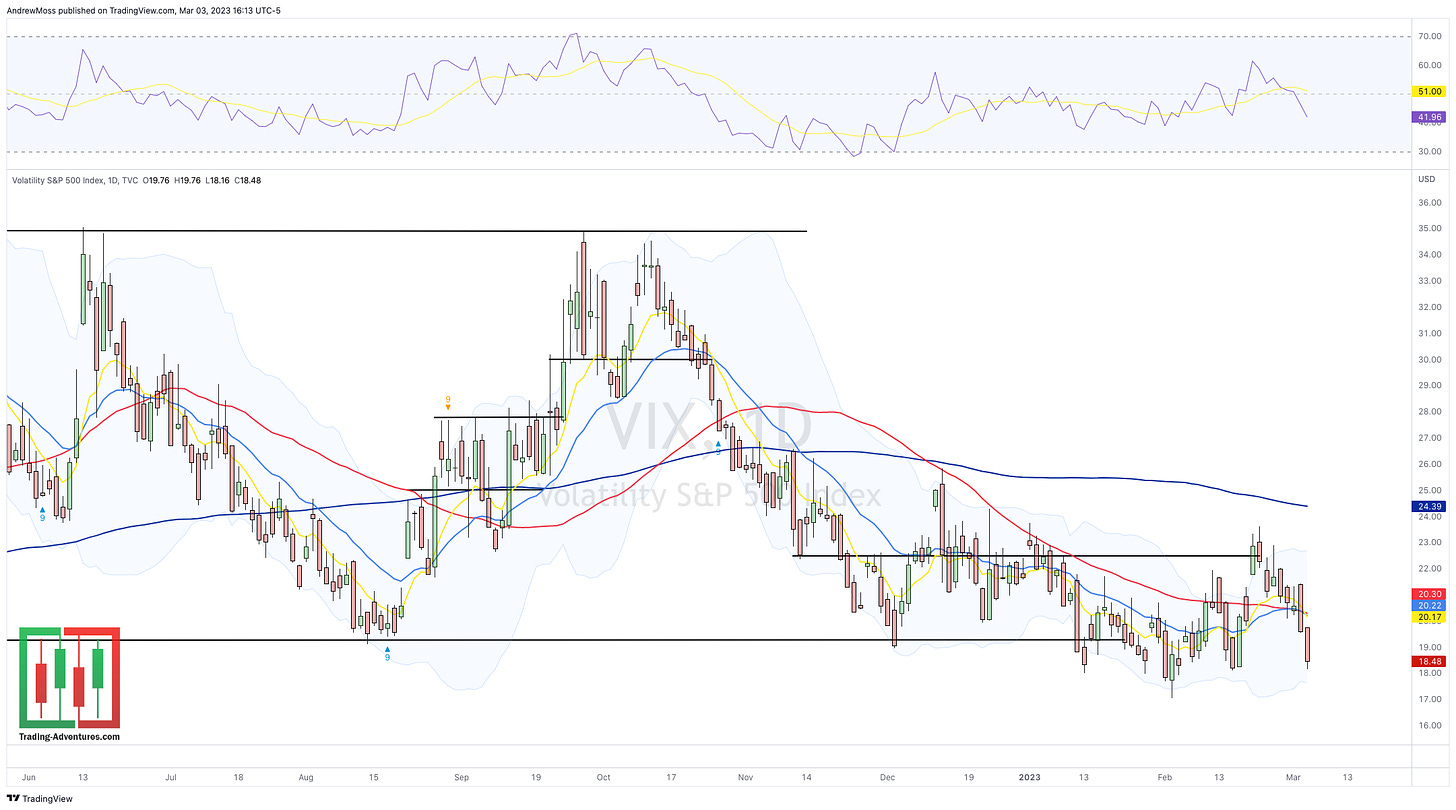
VIX - Volatility continues lower as it dives -20% in just nine trading sessions.
So with February’s lackluster performance history behind us, it appears that the bulls are back in control.
March has traditionally been a very strong month. One of the strongest actually.

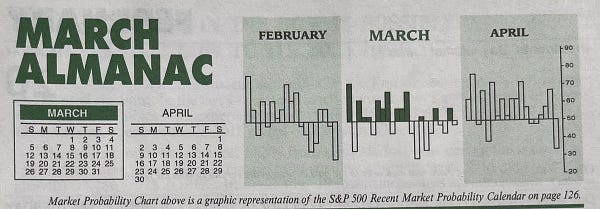
Let’s see if that seasonality can help fuel this rally higher.
As always, join me Saturday morning for Weekend Weekly Charts - a great chance to zoom out and consider the bigger picture.
Find it here @Andy__Moss on Twitter
And tell a friend!
Last, click HERE for a little humor.
***This is NOT financial advice. NOT a recommendation to buy, sell, or trade any security. The content presented here is intended for educational purposes only.
Andrew Moss is an associated member of T3 Trading Group, LLC (“T3TG”) a SEC registered broker/dealer and member of FINRA/SIPC. All trades placed by Mr. Moss are done through T3TG.
Statements in this article represent the opinions of that person only and do not necessarily reflect the opinions of T3TG or any other person associated with T3TG.
It is possible that Mr. Moss may hold an investment position (or may be contemplating holding an investment position) that is inconsistent with the information provided or the opinion being expressed. This may reflect the financial or other circumstances of the individual or it may reflect some other consideration. Readers of this article should take this into account when evaluating the information provided or the opinions being expressed.
All investments are subject to risk of loss, which you should consider in making any investment decisions. Readers of this article should consult with their financial advisors, attorneys, accountants or other qualified investors prior to making any investment decision.
POSITION DISCLOSURE
March 3, 2023 4:00 PM
Long: ABNB, SPY, SPY0308P402, QQQ, QQQ0308P298
Short:
Options symbols are denoted as follows:
Ticker, Date, Call/Put, Strike Price
Example: VXX1218C30 = VXX 12/18 Call with a $30 strike


