3 Indicators To Guide Your Near-Term Market View
Plus A Weekly Market Update - January 18, 2023
The News
The year-to-date anchored volume weighted average price (AVWAP) is driving the bus for SPY and QQQ.
This is an excellent example of this tool at work. Look how many times it has produced a turning already in just week 3 of 2024.
The week-to-date AVWAP has also had an impact, as has the 5-day moving average.
These indicators don’t predict the future. But they do often show us where to focus and look for changes.
The Markets
A week and a half ago, we were looking at igniting bars ready to take prices higher and back toward recent highs. And they did. But now, some market sectors are struggling to push into new territory.
Beneath the surface, it’s a mixed bag.
AMD, NVDA, MSFT, and META are higher and breaking new ground. But are they showing signs of exhaustion?
AAPL moved lower to test its 200-day MA. And TSLA is well below its 200-day MA.
Can they find a bounce?
Let’s look at the charts.
Special Announcement
Some exciting new features are coming to Trading-Adventures.com.
You’ve seen the newest educational article - Chart School.
You’ve seen (and subscribed to?) the YouTube channel.
Now, get ready for another exciting addition coming later this month.
If you’re visiting or reading on the website, make sure you get the news by subscribing now.
And if you’re one of the many new subscribers, thanks for signing on!
Keep an eye out for updates to the ‘Start Here’ and ‘About Me’ pages - coming soon.
The Charts
SPY has spent the week zig-zagging back and forth across the short-term moving averages. Two dips below the 21-day MA in quick succession combined with the 8-day MA moving briefly below the 21 shows weakening momentum. But no serious damage has been done, and this could simply be another instance of time correction before another move higher. We’ll need a move above $480 to confirm that sequence.
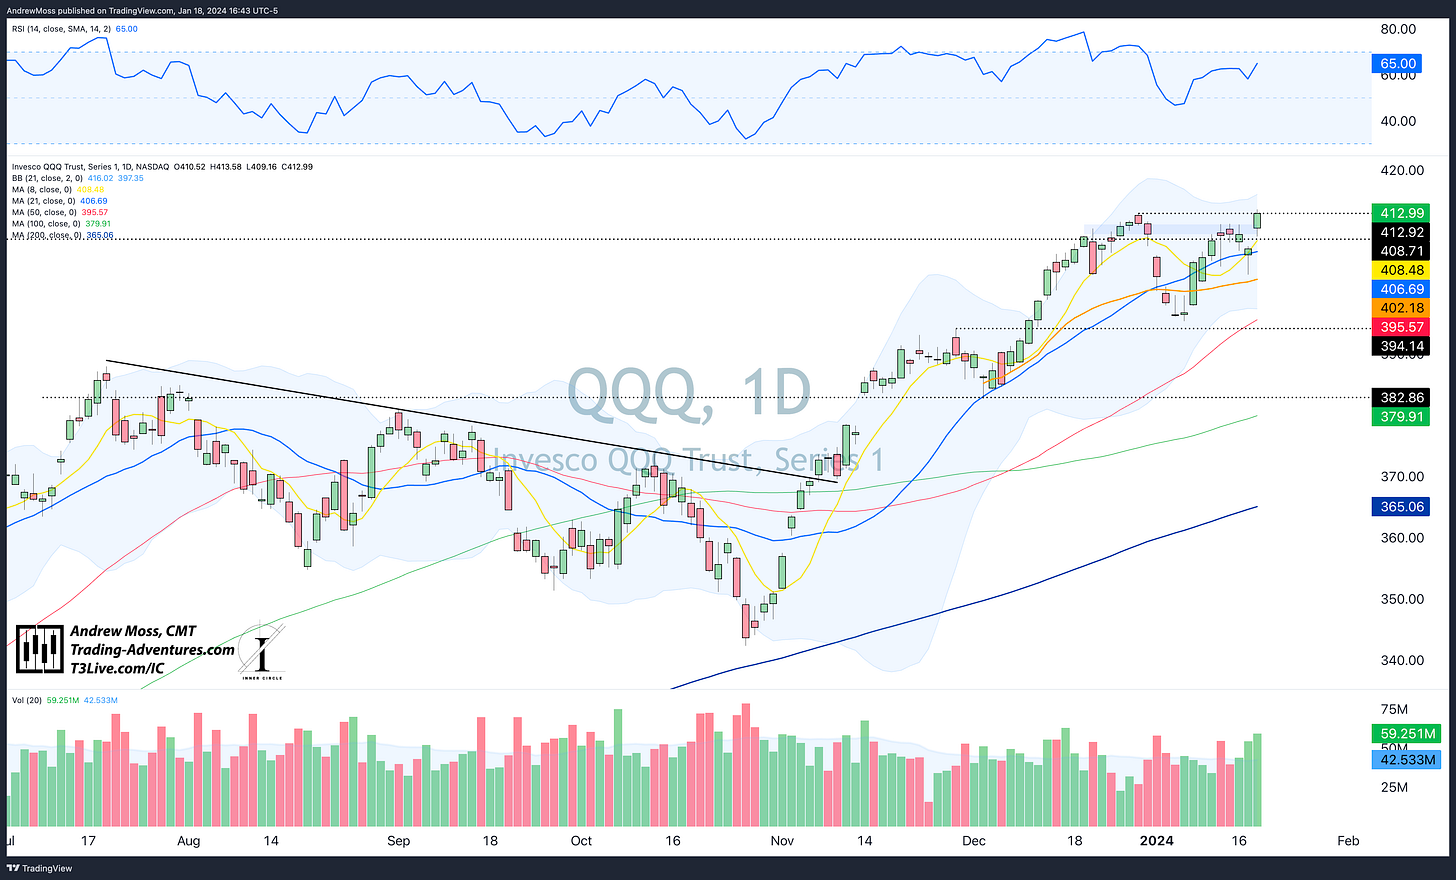
QQQ is carrying the torch for now and goes out another closing high today. It has been a bit erratic over the last couple of weeks, but the strength remains.
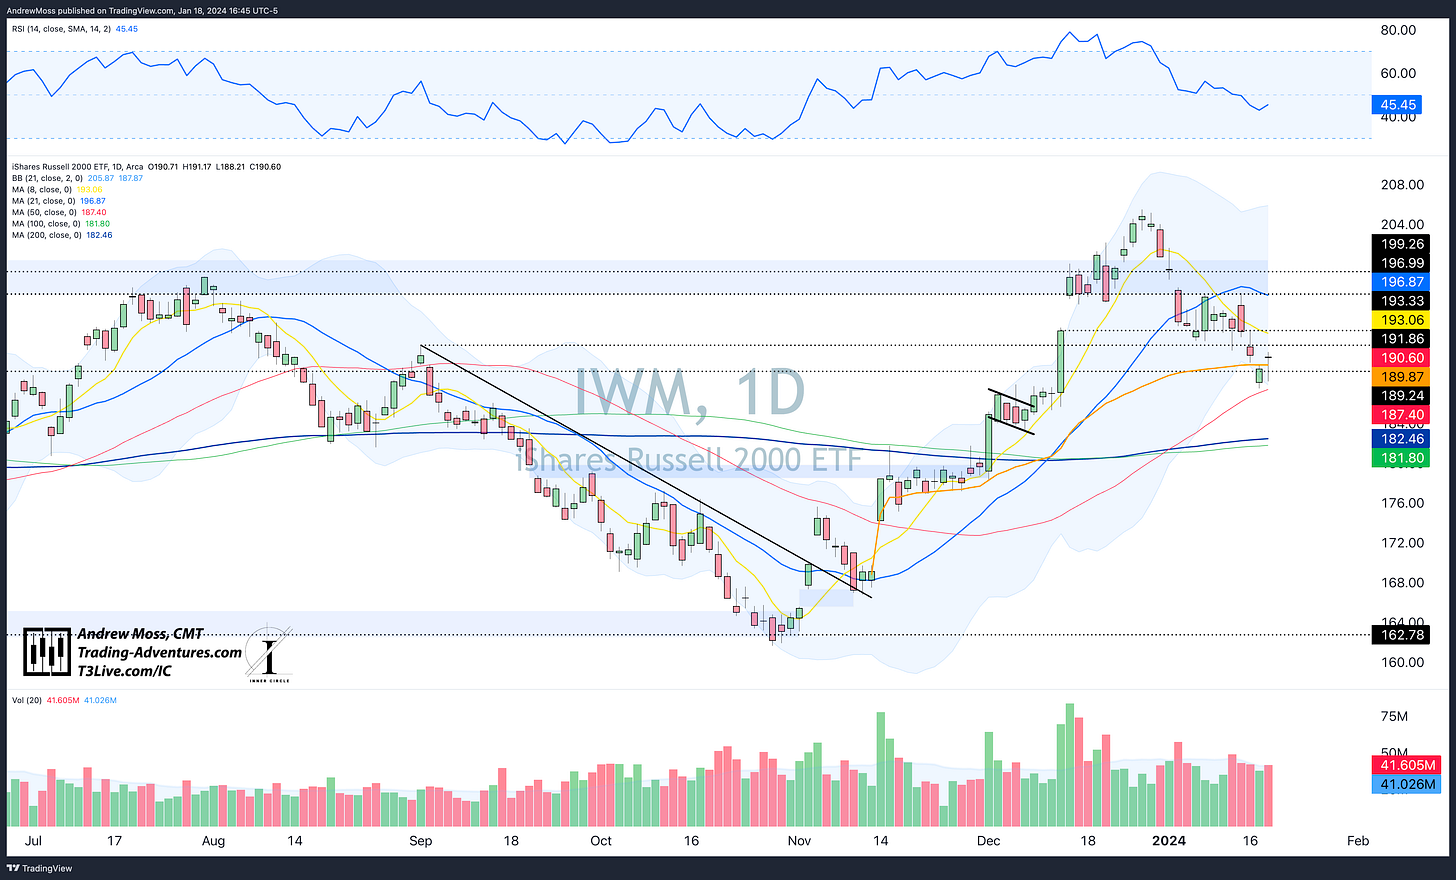
IWM is trying to resume the fight with a bounce near the 50-day MA and today’s close back over the Nov. gap AVWAP.
DIA overcame several days of selling to close very near (but under) the 8 and 21-day MAs. Trading between $370 and $378 for nearly a month could be enough consolidation to send this one strongly higher on a breakout. Watch for a move beyond each of those levels for indications of what may be next.
TLT sends a cautious message as it lost the 50-day MA today. The zone near $92 could be in the cards now. Bonds lower and rates higher is not what stock bulls want to see.
DX1! Dollar futures had two weeks of consolidation followed by a breakout—more trouble for stocks.
BTCUSD looks like a failed breakout, followed by a bear flag, and now it’s lost the months-long trendline. Maybe the $40,000 round number can add some support.
The Closing Bell
Plenty of strength but also some chop.
Large caps, technology, and some semiconductor stocks are making new highs.
Small caps, Government bond yields, and the Dollar are struggling. Will they be early indicators of potential trouble?
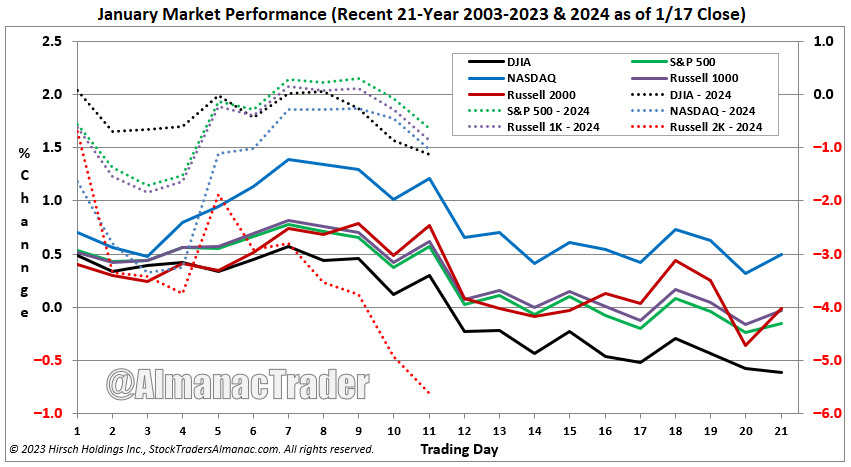
The battle continues.
Which is in line with seasonal tendencies for January.
There’s that word again.
Courtesy of Jeffrey Hirsch. Click the image to read his comments.
Elevate Your Trading
Education, training, and support for your Trading Adventure.
Options Trades - Weekly trade ideas are delivered to your email or text messages in language you can easily understand.
Check out EpicTrades from David Prince and T3 Live. Epic Trades from David Prince
Community - Are you an experienced trader seeking a community of professionals sharing ideas and tactics? Visit The Inner Circle, T3 Live’s most exclusive trading room - designed for elite, experienced traders.
Prop Trading - Or perhaps you are tested and ready to explore a career as a professional proprietary trader? 3 Trading Group has the technology and resources you need.
Click here to start the conversation:
The Disclosures
***This is NOT financial advice. This is NOT a recommendation to buy, sell, or trade any security. The content presented here is intended for educational purposes only.
Andrew Moss is an associated member of T3 Trading Group, LLC (“T3TG”), an SEC-registered broker/dealer and member of FINRA/SIPC. All trades placed by Mr. Moss are done through T3TG.
Statements in this article represent that person’s opinions only and do not necessarily reflect those of T3TG or any other person associated with T3TG.
Mr. Moss may hold an investment position (or may be contemplating holding an investment position) that is inconsistent with the information provided or the opinion being expressed. This may reflect the financial or other circumstances of the individual, or it may reflect some other consideration. Readers of this article should consider this when evaluating the information provided or the opinions being expressed.
All investments are subject to the risk of loss, which you should consider in making any investment decisions. Readers of this article should consult with their financial advisors, attorneys, accountants, or other qualified investors before making any investment decision.
POSITION DISCLOSURE
January 18, 2024, 4:00 PM
Long: MARA, MARA0216C22, TNA0119C37
Short:
Options symbols are denoted as follows:
Ticker, Date, Call/Put, Strike Price
Example: VXX1218C30 = VXX 12/18 Call with a $30 strike


Nice work of showing VWAP in action 🙂