Coal In Your Stocking?
Market Update January 4, 2024
Special Announcement!
More new features are coming to Trading-Adventures.com!
You’ve seen the newest educational article - Chart School.
You’ve seen (and subscribed to?) the YouTube channel.
Now, get ready for another exciting addition coming later this month.
If you’re visiting or reading on the website, make sure you get the news by subscribing now.
And if you’re one of the many new subscribers, thanks for signing on!
Keep an eye out for updates to the ‘Start Here’ and ‘About Me’ pages - coming soon.
The Markets
As promised, the much anticipated (?) results of the famed Santa Claus Rally period -
SPX -0.92%
Santa did not deliver. Or, we got lumps of coal in our stockings. Either way, this heightens our awareness of potential weakness throughout the rest of the month and year.
While the performance of those seven days has some statistical significance, these last three have all our attention.
Three down days in a row to kick off 2024 isn’t the most festive New Year celebration. But it isn’t all that surprising, given the historic nine-week string of positive performance we’ve just seen.
We watched the stair step action repeat several times, becoming extended, then time correcting, then moving higher into extension again. No selling. Always more buying.
Now some profits are being booked. Many stocks and indexes are testing the resilience of the trend by moving into their medium-term moving averages (the 21 and 50-day MAs).
It can be concerning. Human nature has us project short-term setbacks well into the future, magnifying losses and stoking bear market fears. We’re better off to take it one day at a time while sticking to our trading plans.
Selloffs are a normal and healthy part of the market sequence.
Higher highs > higher lows > higher highs > higher lows > higher highs.
That is how uptrends work.
And it’s exactly what we want to see as each subsequent low gives a new potential risk management level, allowing us to raise stops along the way.
Trim and trail.
When prices move higher again, we watch for the sequence to continue. Do we get another higher high?
If yes, the uptrend is still in place.
If not, the situation has changed, and we change our tactics.
The Charts
SPY moved below the 21-day MA, the pivot level, and the 38.2% Fibonacci retracement of the recent move up from $453. Below that level, there is potential support at
the 50% retracement
VWAP anchored from the Nov. 13 gap
the $459 pivot
QQQ continued lower for the second session beneath the 21-day MA. The $394 pivot is important now, with $385-$386 even more so.
That area has the 50-day MA, the October low anchored VWAP, and a fib retracement. That could be a magnet for prices if the selling continues.
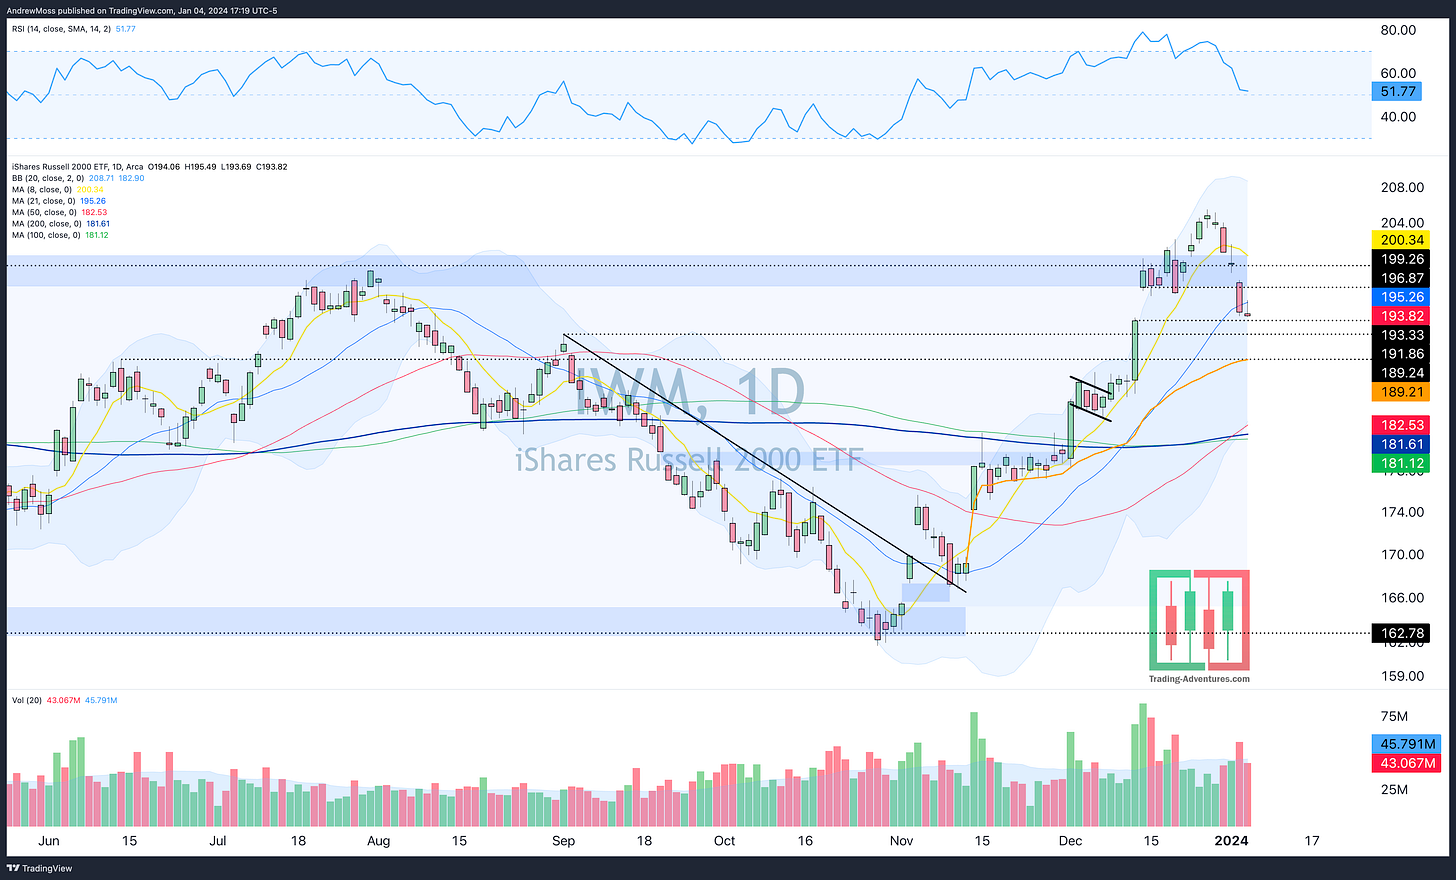
IWM was slightly better than the large-cap indexes, though still below the 21-day MA and nearly closing the gap. It also just missed holding the inside day.
DIA The Dow Jones 30 was stronger most of the day, helped by healthcare this time. It closed out below the 8-day MA but well above the breakout level and the 21-day MA, both near $370.
TLT had a tight range today and is sandwiched between the 21 and 200-day MAs.
DXY US Dollar Futures did print an inside day and remained below pivot support/resistance and the 21-day MA. A move lower and back toward $101 will be needed for stocks to gain ground.
The Closing Bell
Reference points and potential support levels are being tested. We’ll find out soon if enough profits have been taken to satisfy the sellers. Or do we move lower still?
The Dollar continues to be a key factor, along with rates and employment.
Non-farm payroll numbers in the morning will likely be a deciding factor for the next move.
We’ll take another look on Saturday morning. See you then.
The Disclosures
***This is NOT financial advice. This is NOT a recommendation to buy, sell, or trade any security. The content presented here is intended for educational purposes only.
Andrew Moss is an associated member of T3 Trading Group, LLC (“T3TG”), an SEC-registered broker/dealer and member of FINRA/SIPC. All trades placed by Mr. Moss are done through T3TG.
Statements in this article represent that person’s opinions only and do not necessarily reflect those of T3TG or any other person associated with T3TG.
Mr. Moss may hold an investment position (or may be contemplating holding an investment position) that is inconsistent with the information provided or the opinion being expressed. This may reflect the financial or other circumstances of the individual, or it may reflect some other consideration. Readers of this article should consider this when evaluating the information provided or the opinions being expressed.
All investments are subject to the risk of loss, which you should consider in making any investment decisions. Readers of this article should consult with their financial advisors, attorneys, accountants, or other qualified investors before making any investment decision.
POSITION DISCLOSURE
January 4, 2024, 4:00 PM
Long: AMZN0119C145, AMZN0119C155, CELH, IWM, METC, TNA0105C40, TNA0119C37, XBI0119C90
Short:
Options symbols are denoted as follows:
Ticker, Date, Call/Put, Strike Price
Example: VXX1218C30 = VXX 12/18 Call with a $30 strike


