📈Weekly Charts📉 11/22/2025
Welcome to this edition of the 📈Weekly Charts📉, where we take a step back to analyze and identify the bigger forces at work.
With markets pulling back again this week and selling pressure hitting many areas at once, this is the right moment to step back and reset the bigger picture. We’ll move through the major indices, global markets, crypto, commodities, relative strength, breadth, and point-and-figure signals — and then we’ll wrap with a multi-timeframe view of “Now What?” and some final thoughts.
Reminder: click on the first chart to open a bigger view. Then use your arrows keys to scroll through all the images.😉
📊 U.S. Indexes
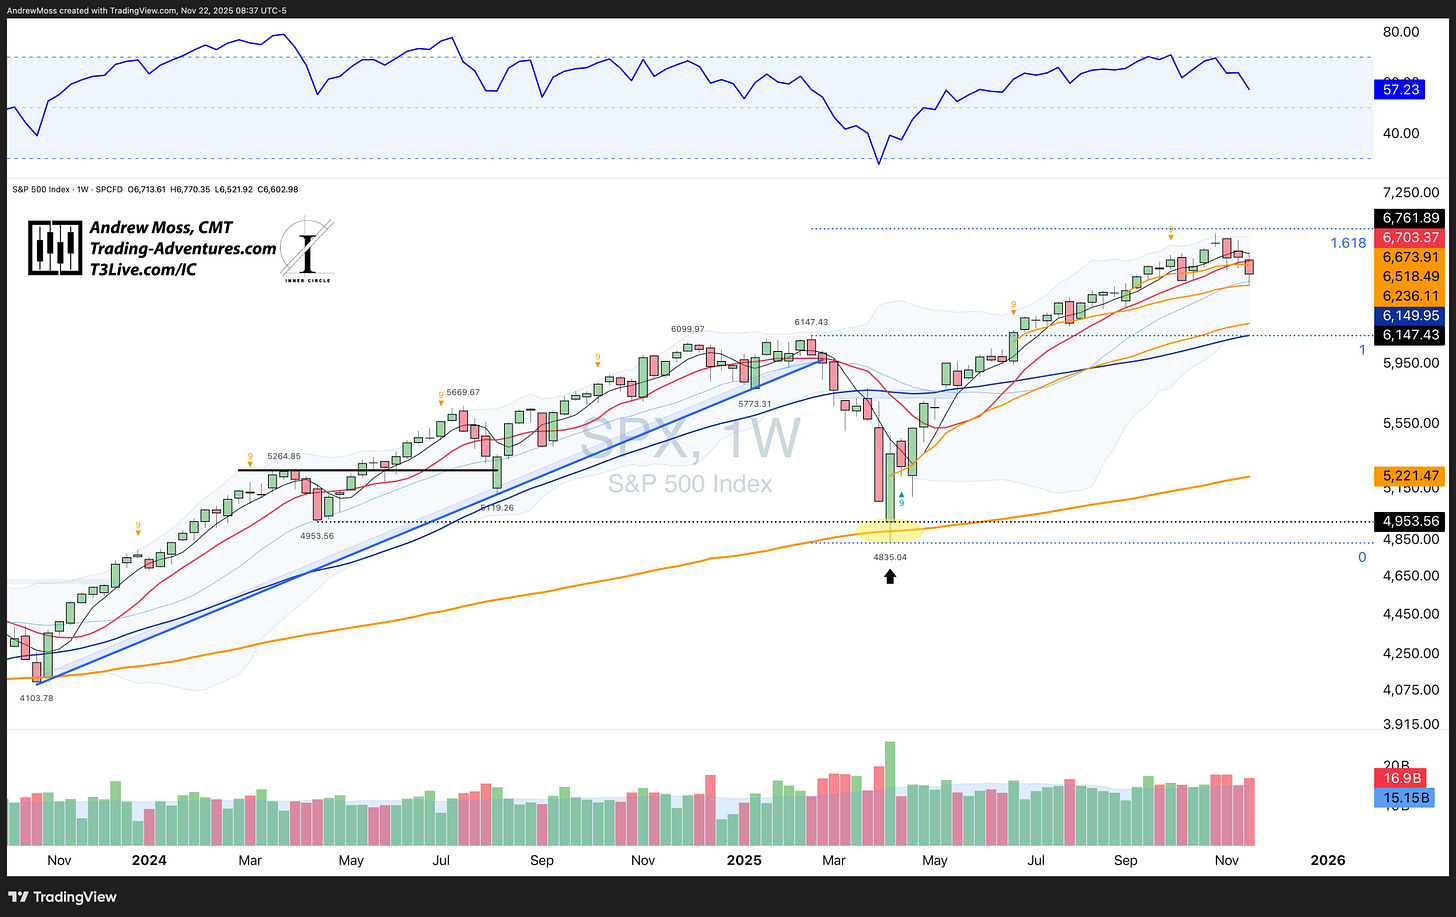
S&P 500 — SPX
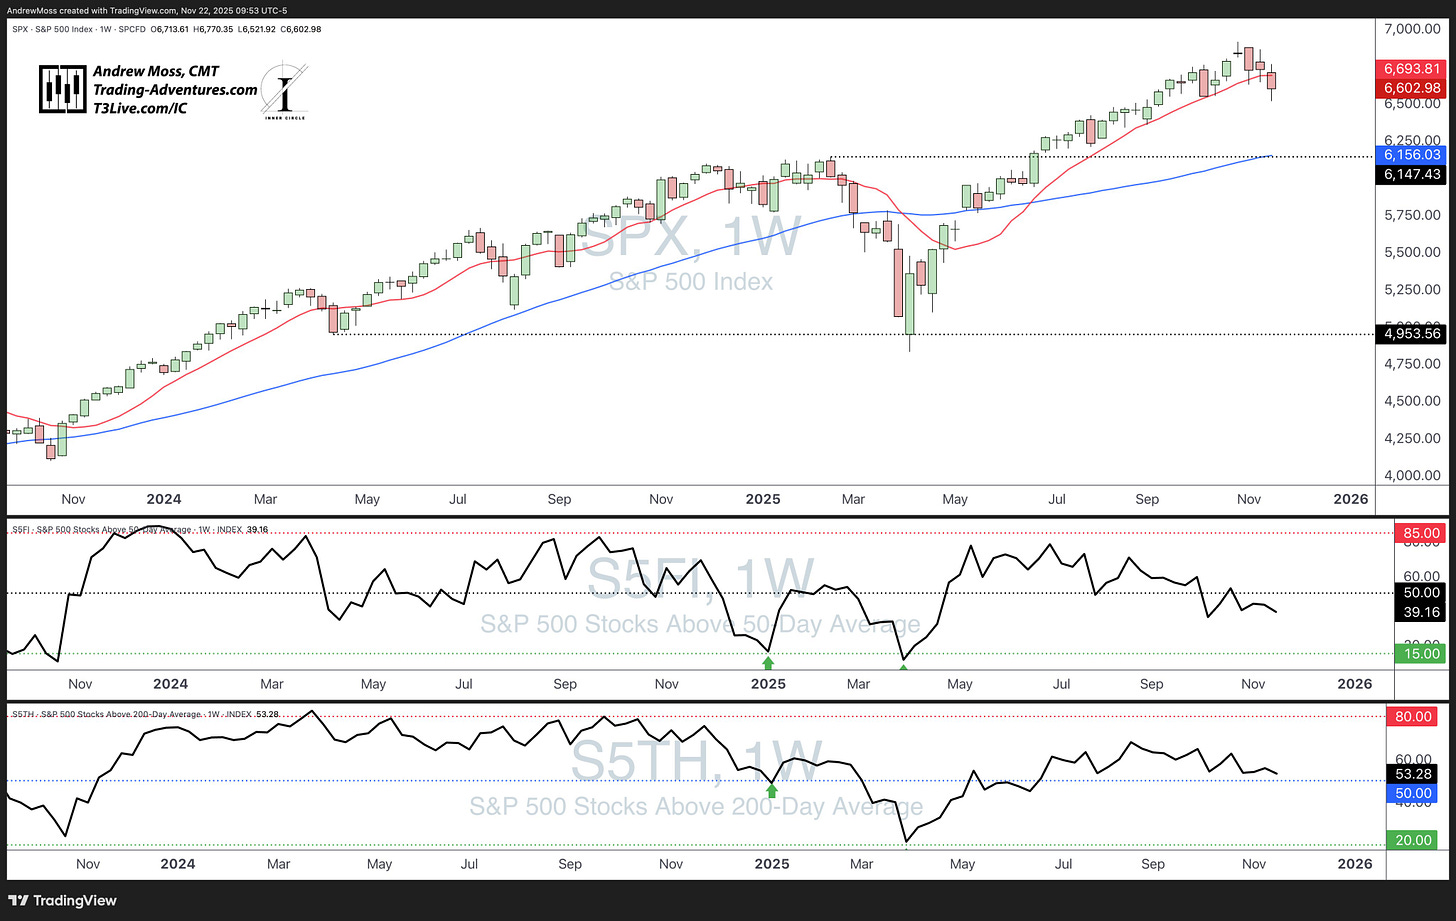
SPX has moved decisively lower since tagging new highs near the Fib extension late last month. Some areas have seen real damage, but the index itself has only retraced 5.76% peak-to-trough. This week price met the Bollinger Band center and the AVWAP from the June breakout.
RSI remains above 50 and volume has stayed elevated for a month — a structure that still defines an active trend, not a broken one.
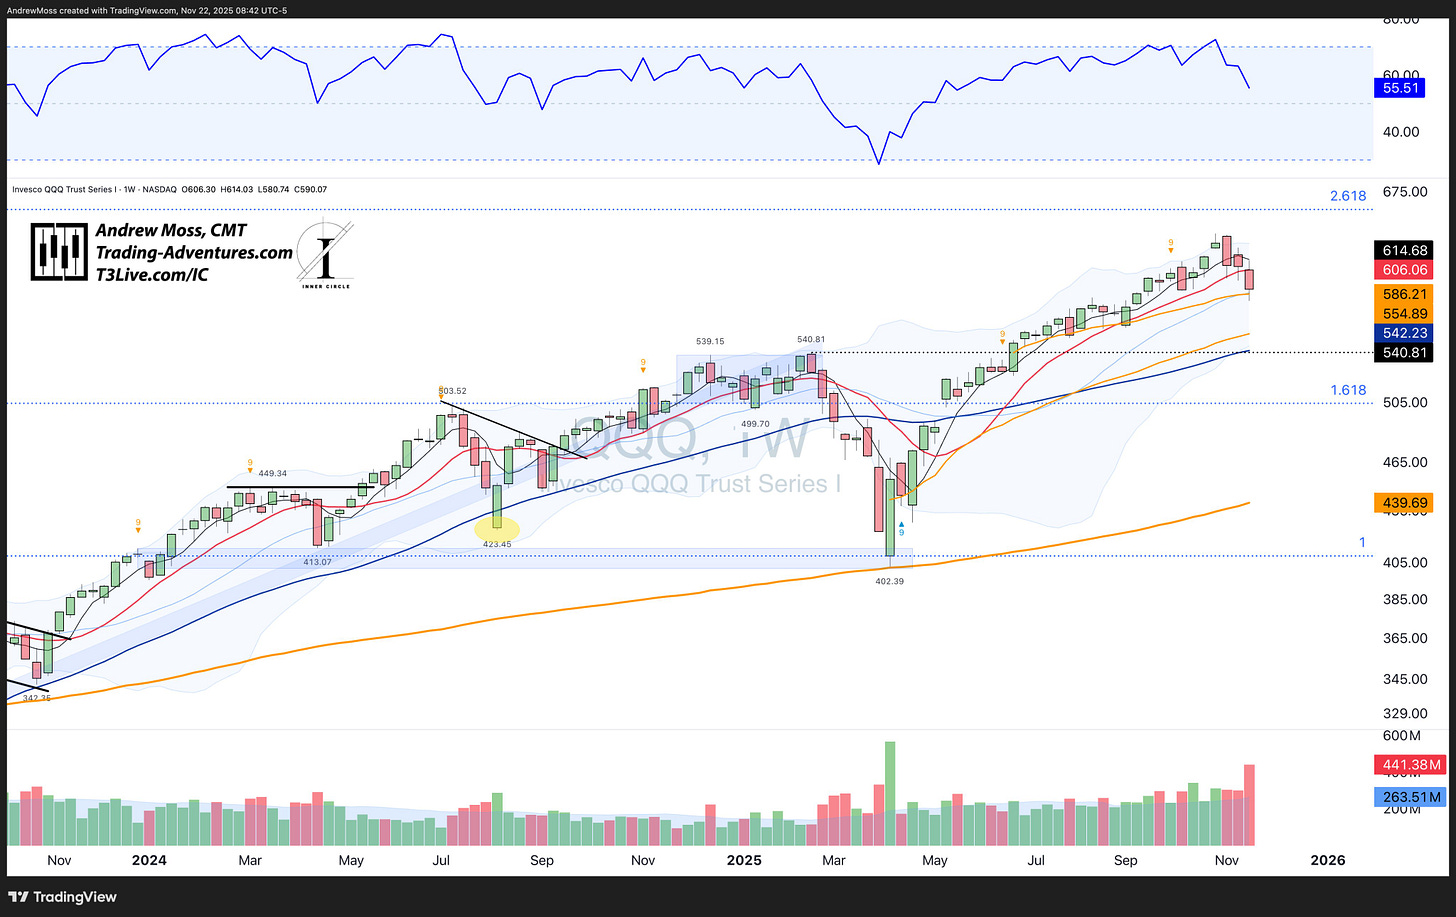
Nasdaq 100 — QQQ
QQQ followed the same path, with heavier volume this week. Price tagged the Bollinger Band center and the June breakout AVWAP. RSI continues to hold above 50 after briefly getting overbought in October. Trend structure intact.
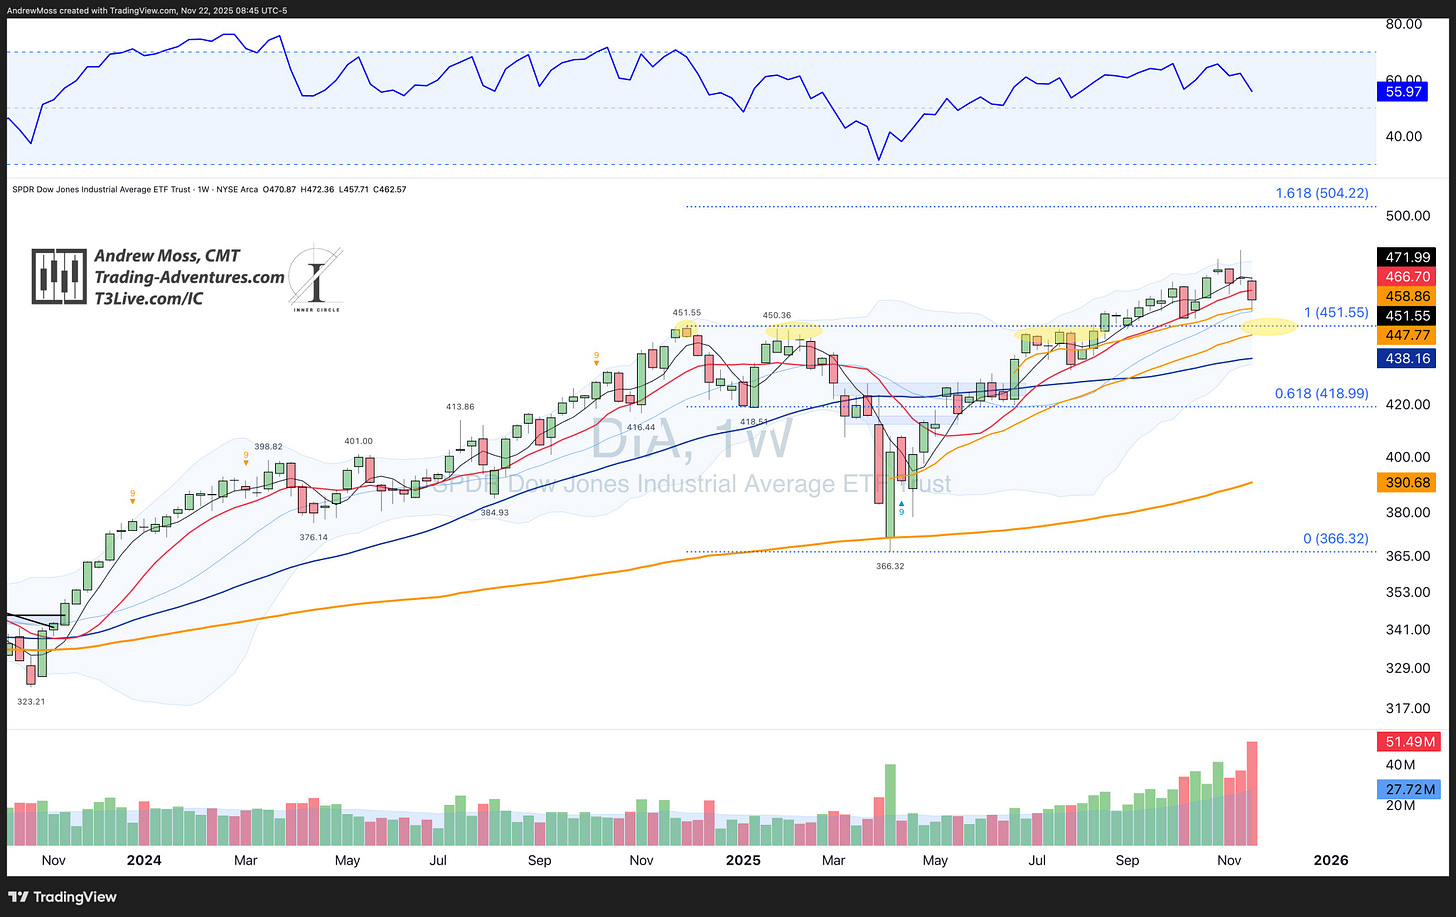
Dow Jones — DIA
DIA makes it 3/3 across the large-cap indices. Same AVWAP test, same volume expansion, same RSI in the mid-50s. The $451 area has been a critical pivot multiple times and remains the level that defines the near-term path.
🌍 Small Caps & International
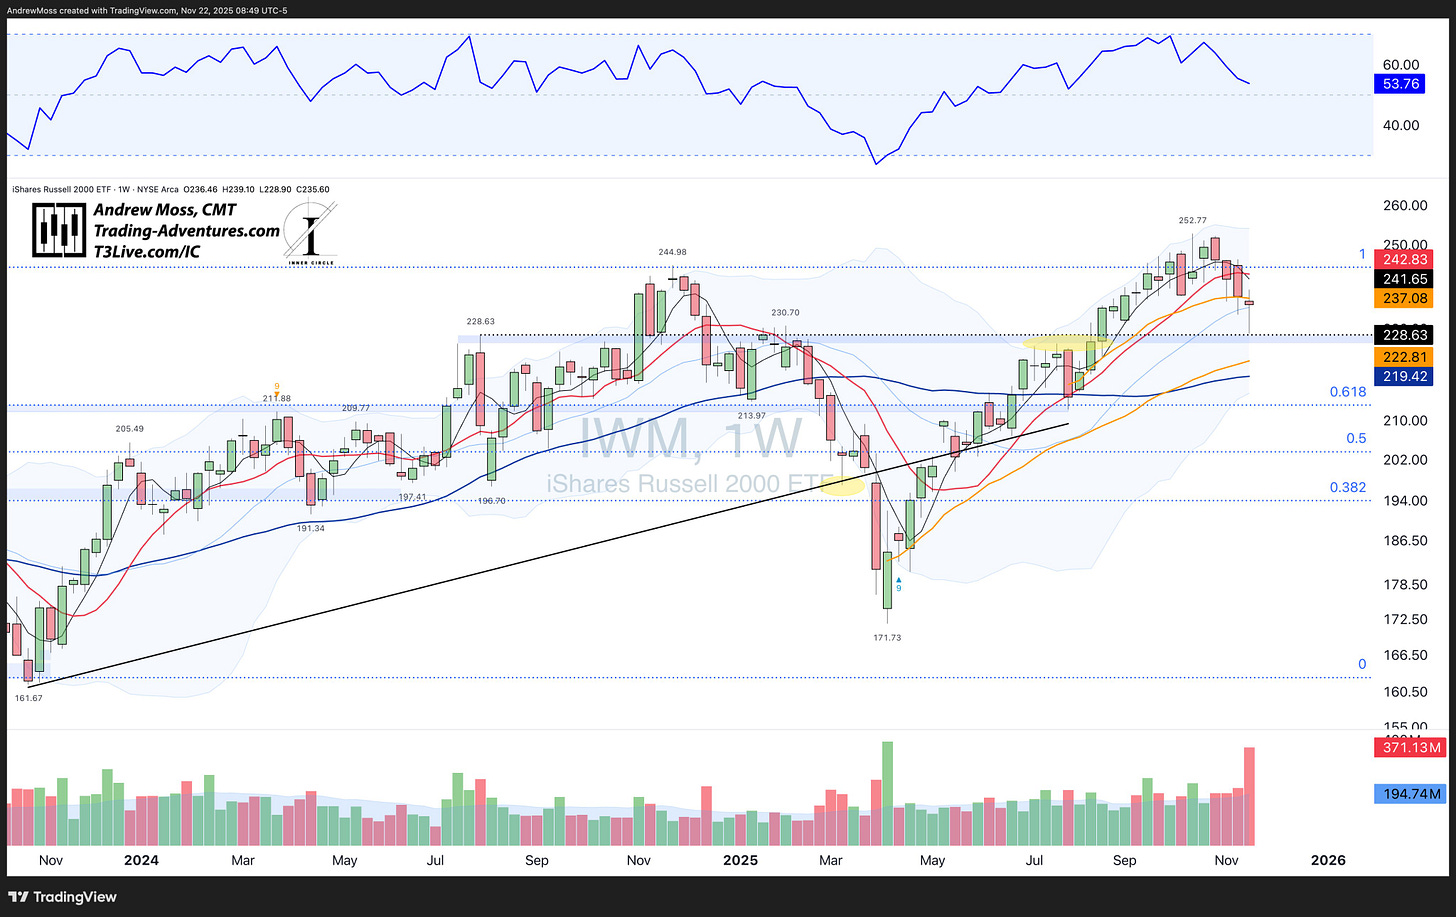
Russell 2000 — IWM
IWM has taken a deeper hit, but the Bollinger Band centerline is still holding. The $228 zone — a key pivot all year — was tested again this week and continues to act as support. RSI sits at 53.76 and volume was massive, signaling real engagement at this level.
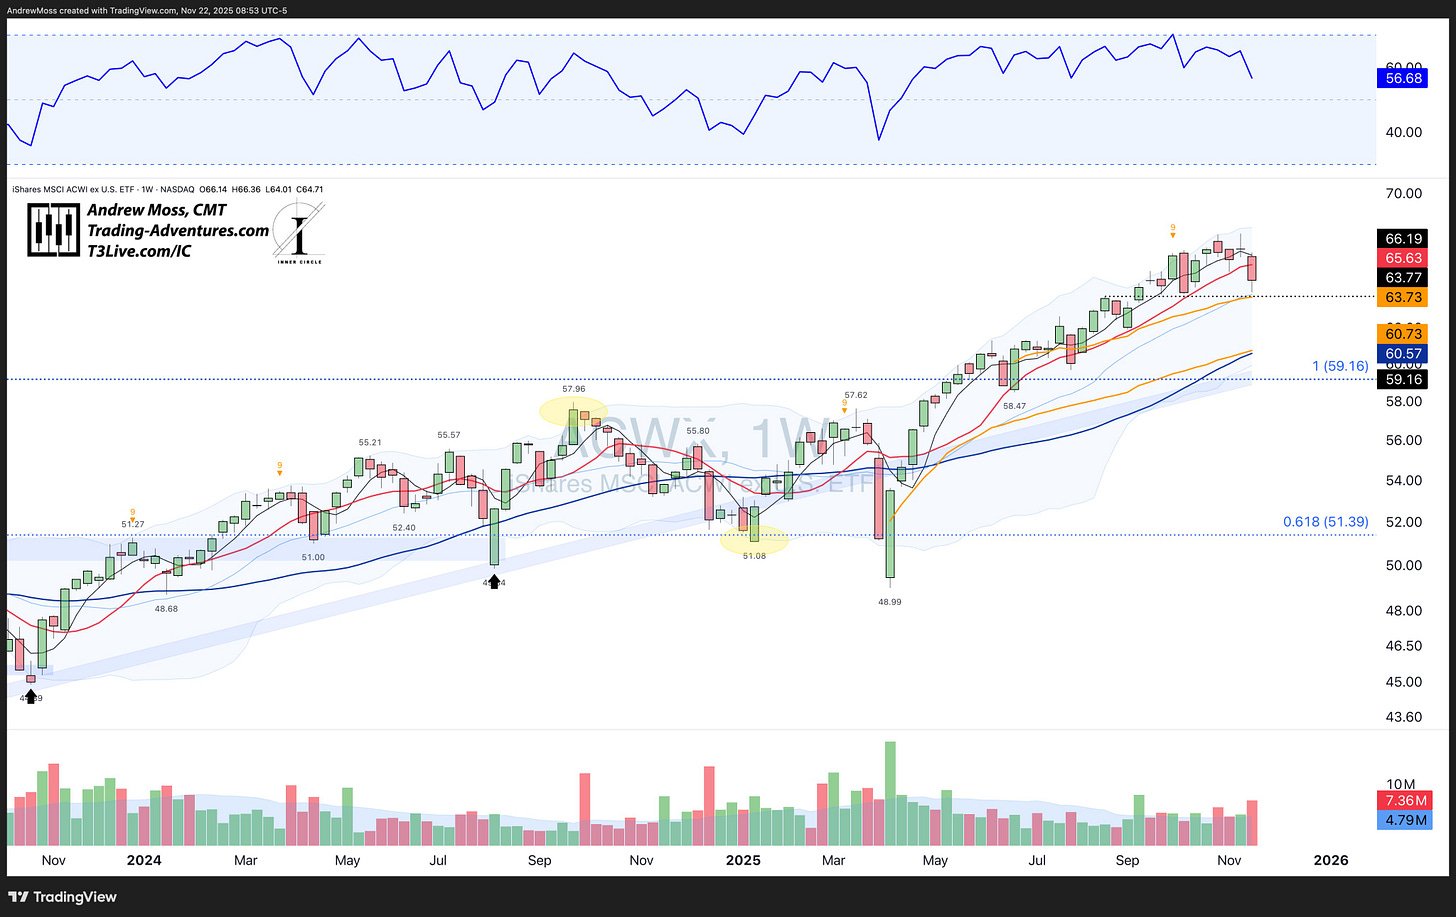
Rest of World — ACWX
ACWX has returned to the same structure seen across major indices: a retest of the Bollinger Band center and the June breakout AVWAP. RSI sits in the mid-50s and volume is rising — a clean retest of trend support.
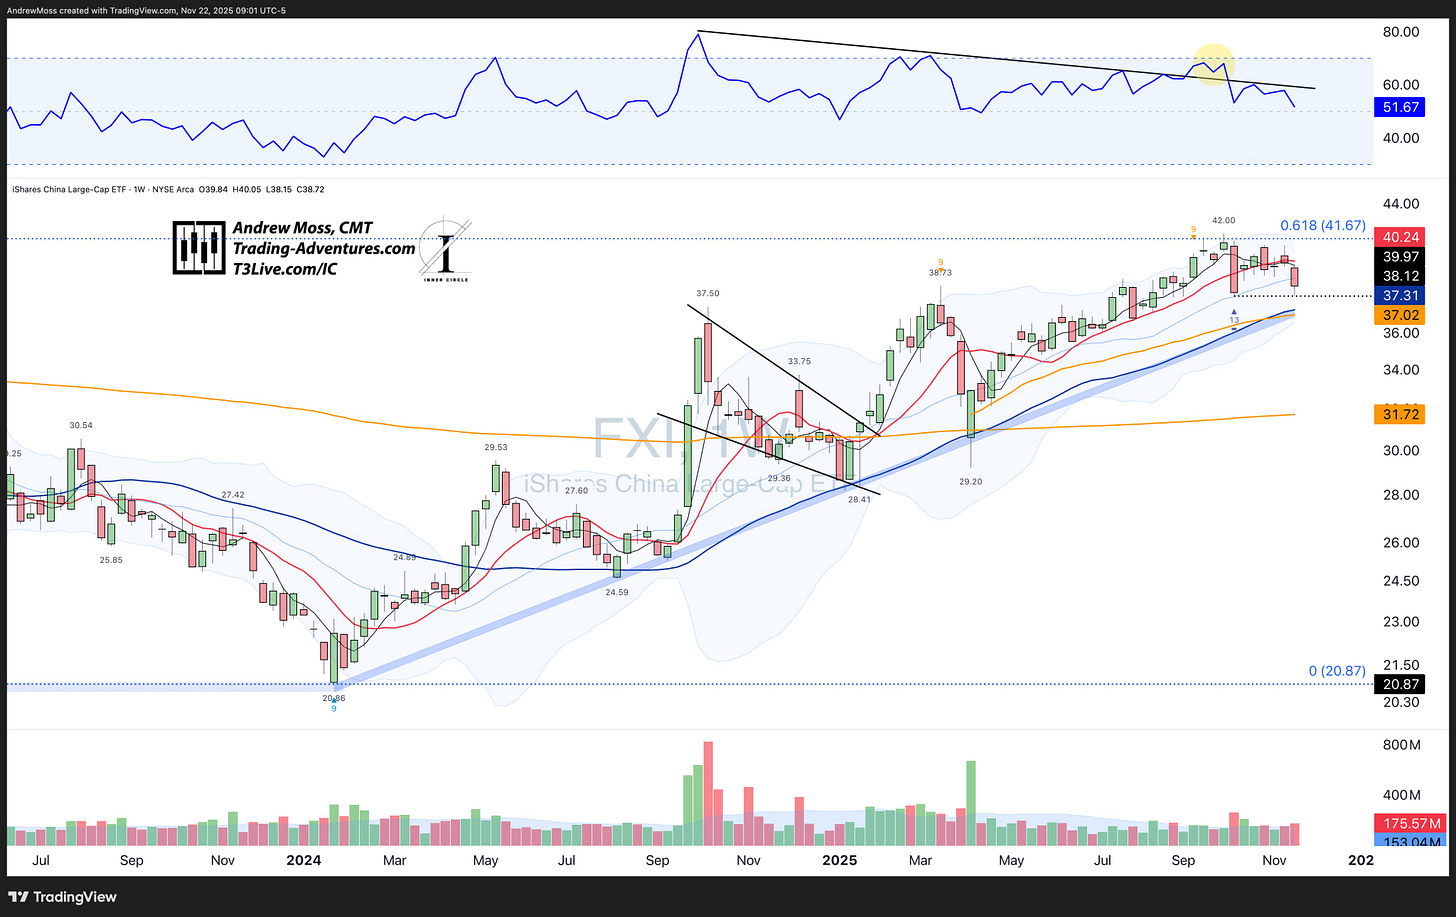
China — FXI
FXI is the first chart this week to close in the lower half of the Bands. RSI continues to fade, and volume sits near its rolling average. The early-October pivot low provided enough support for a small bounce. If that level gives way, the next major zone sits near $37, where an AVWAP, a trendline, and the 40-week MA converge.
🏦 Bonds
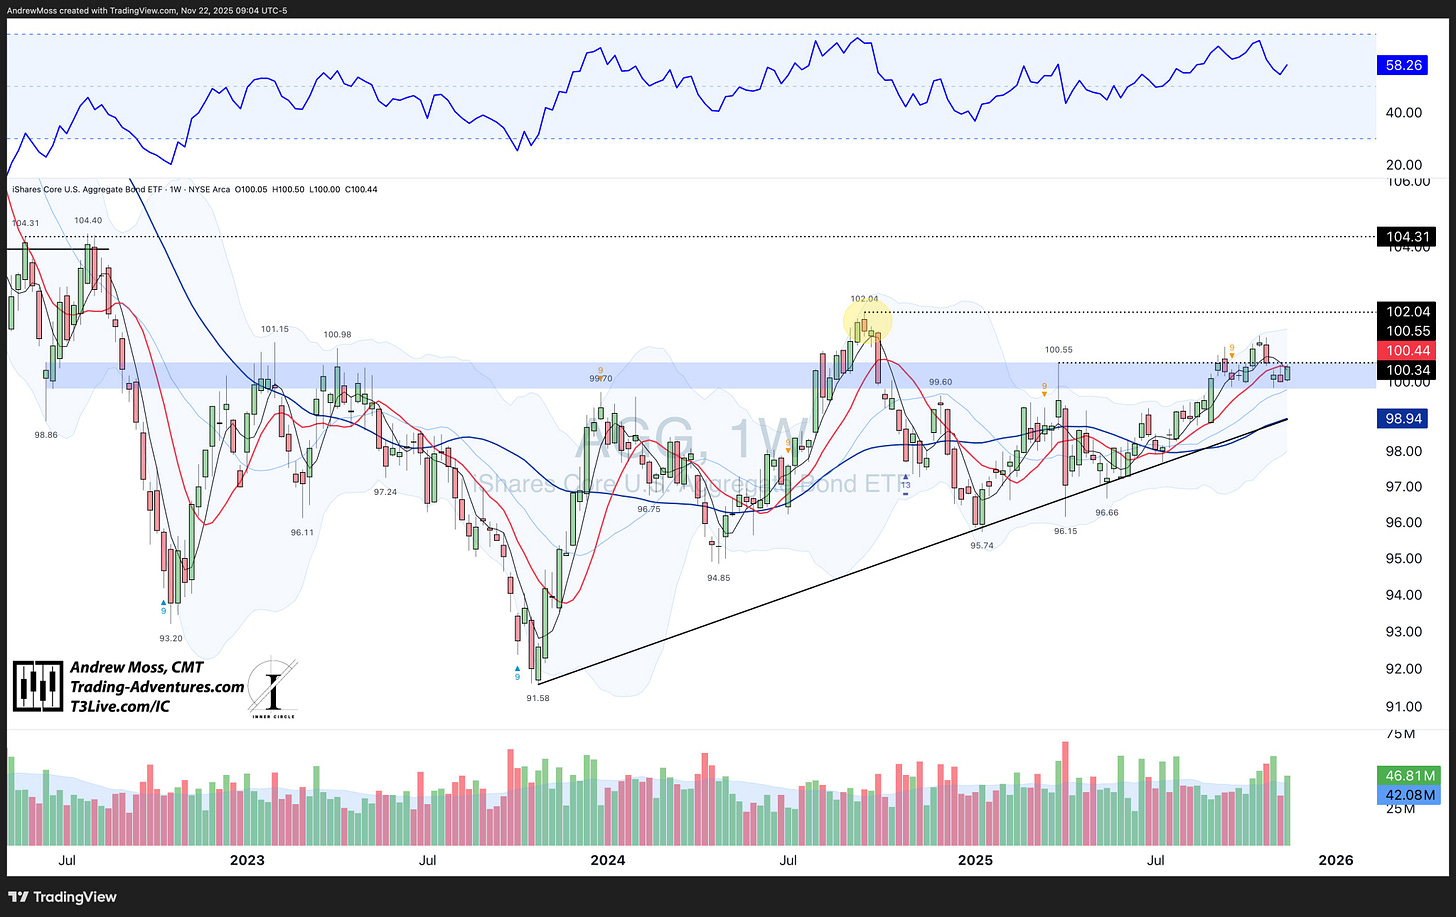
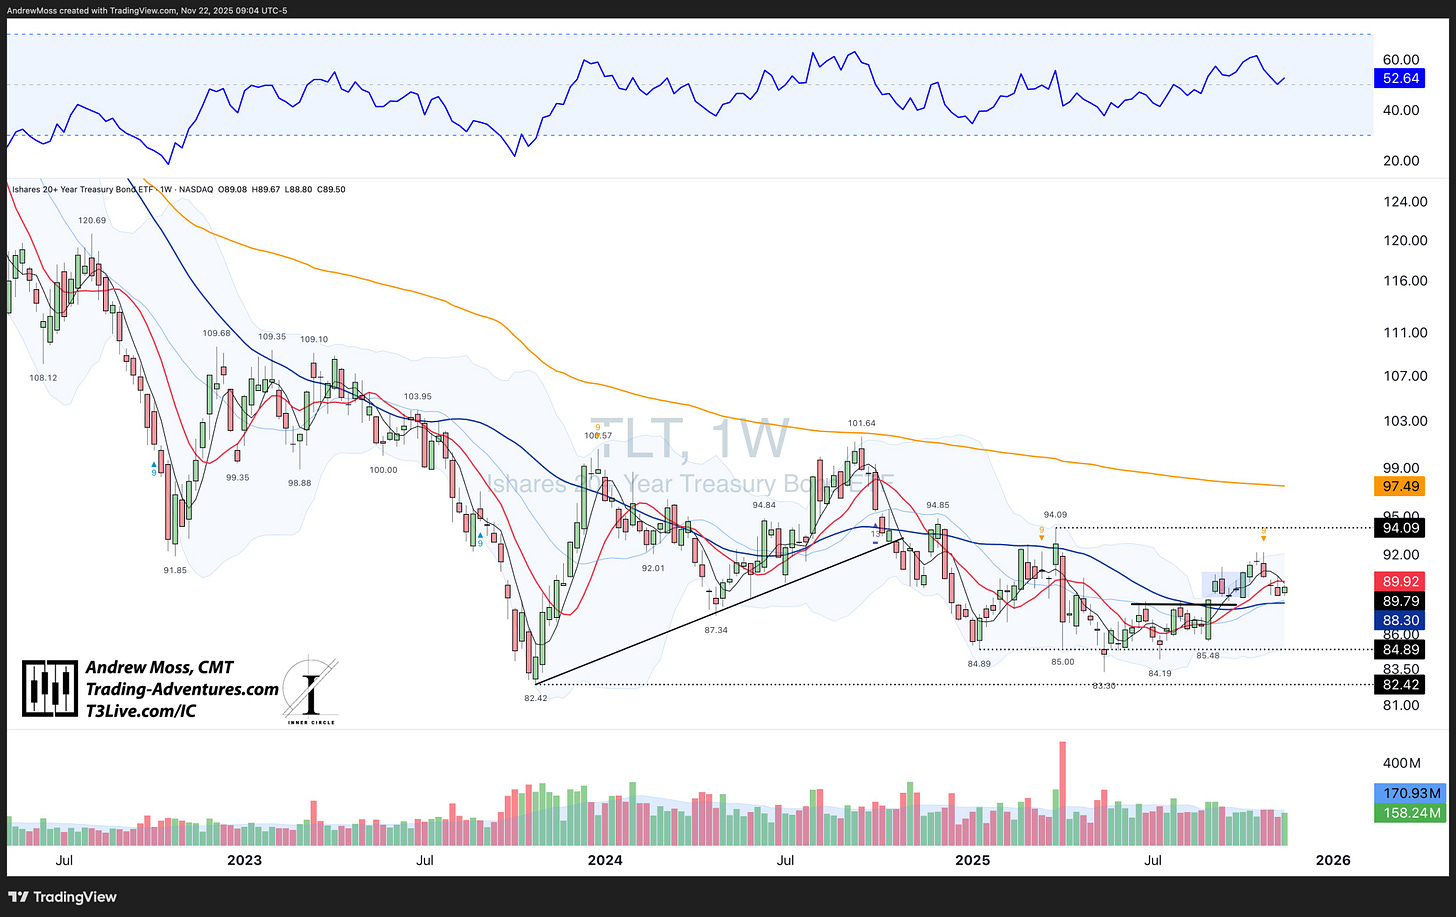
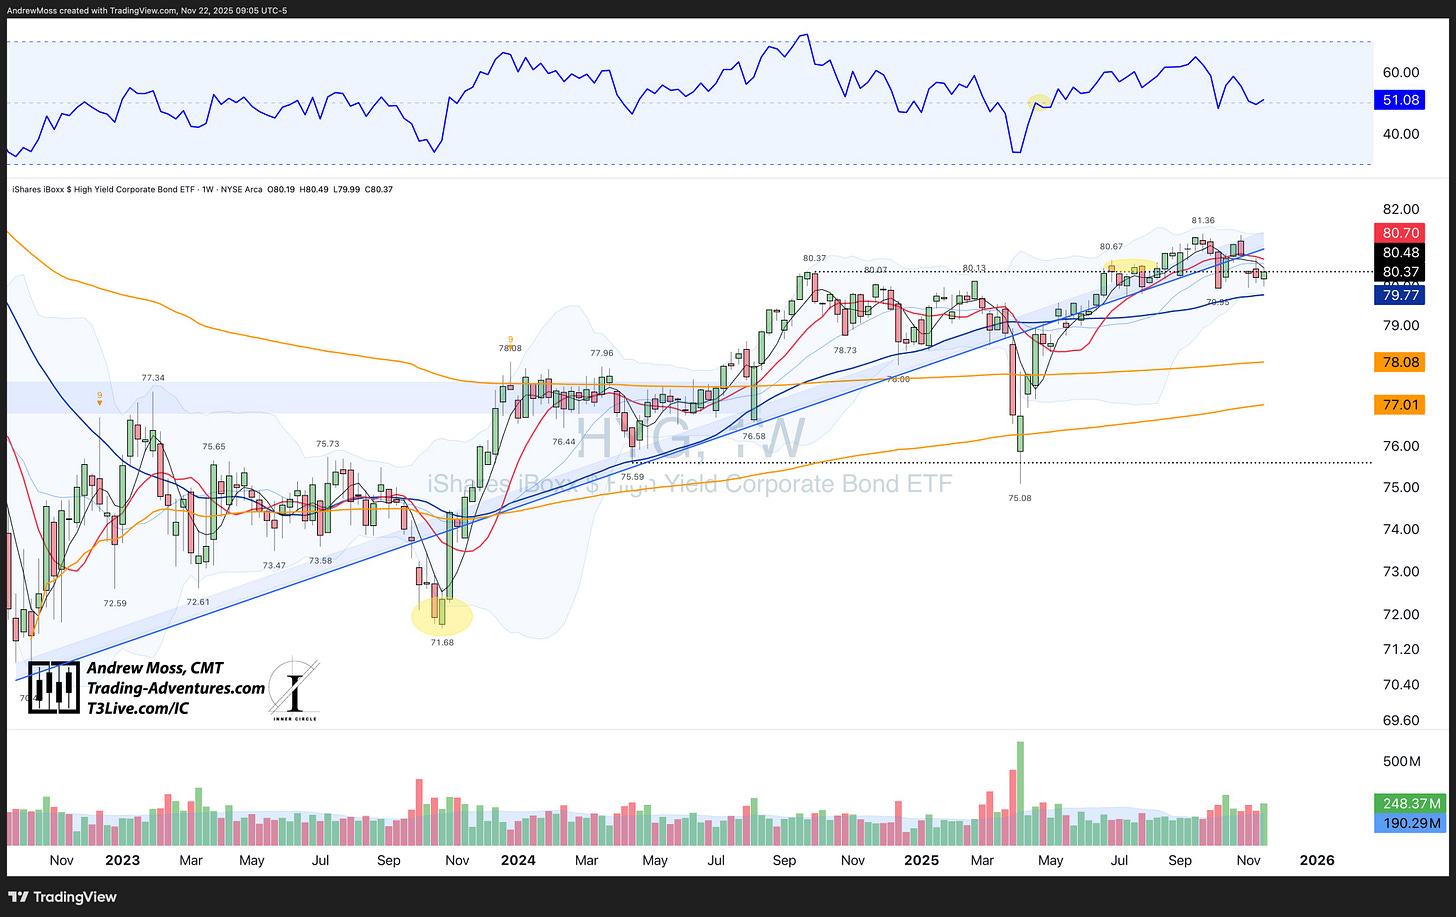
Bonds were quiet, with all three majors holding a tight three-week range.
AGG is pressing into its 10-week MA.
TLT printed an inside week.
HYG continues to stall at the $80.37 pivot while remaining beneath the broader trendline.
Compression remains the dominant feature.
⚖️ Commodities:
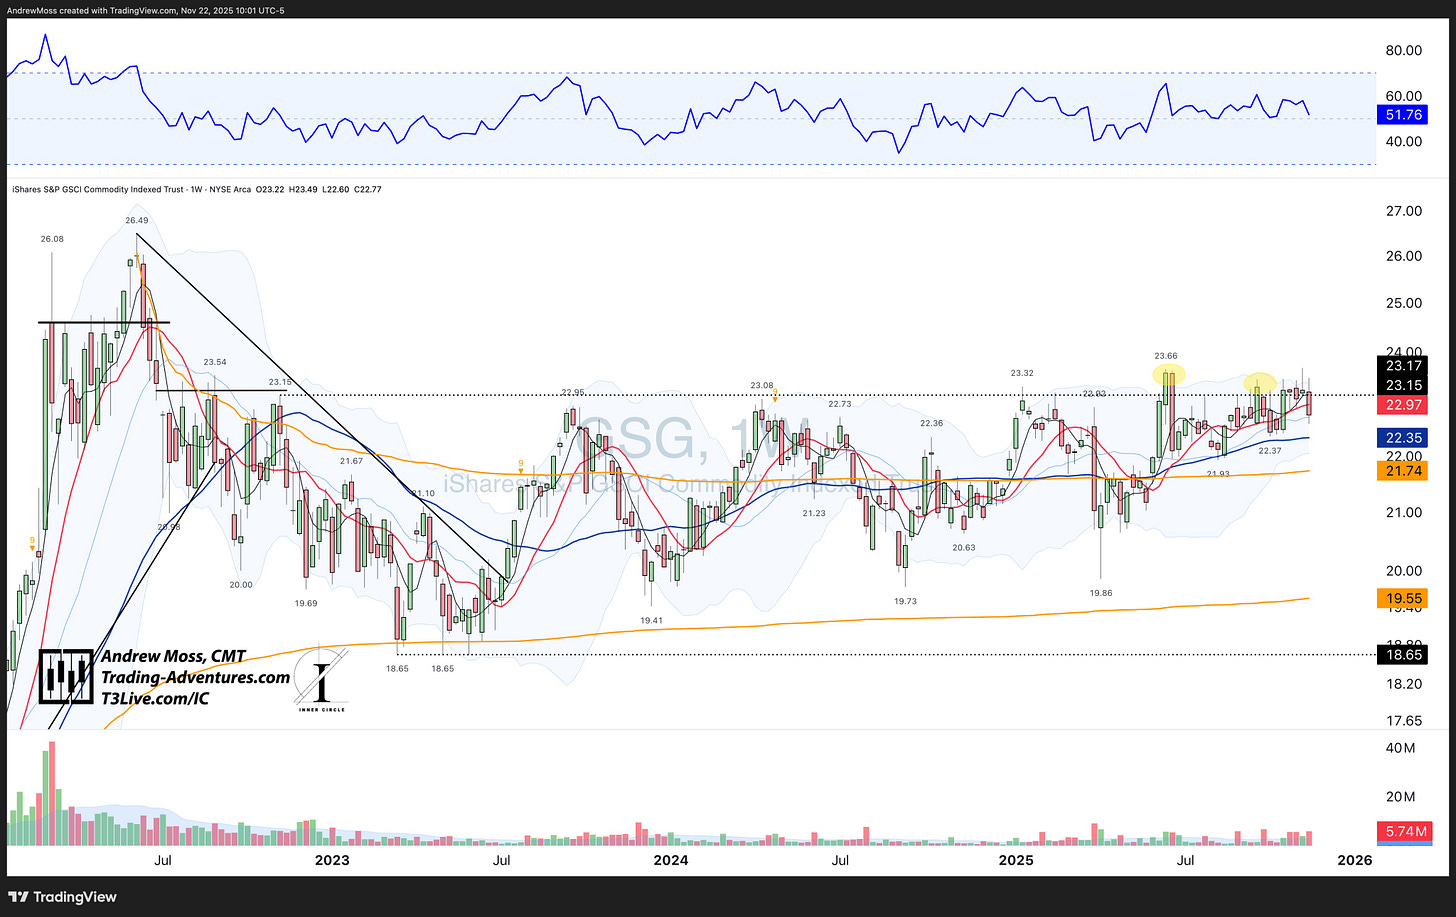
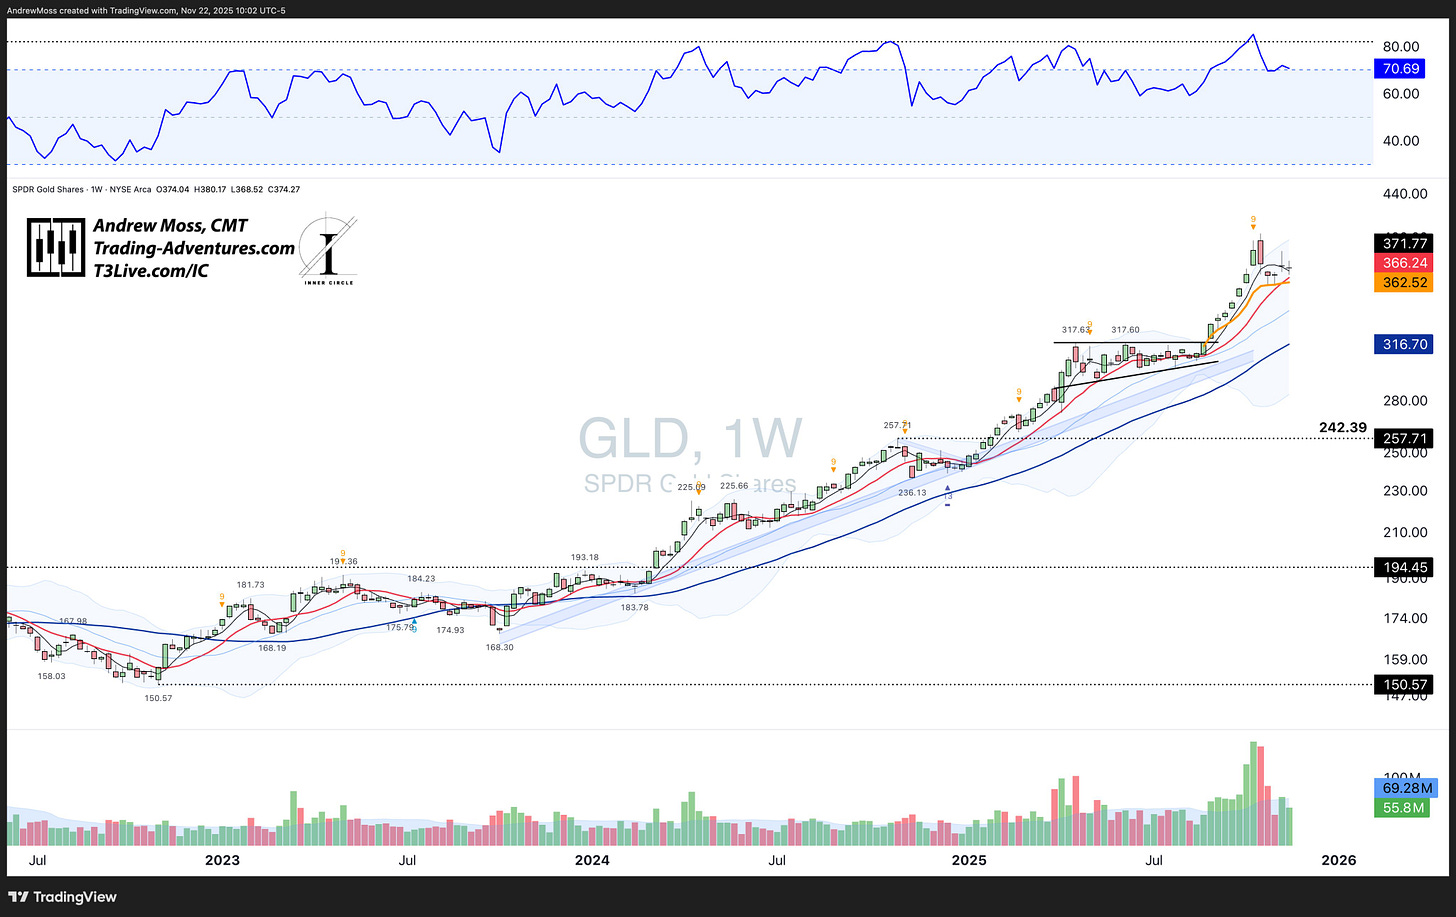
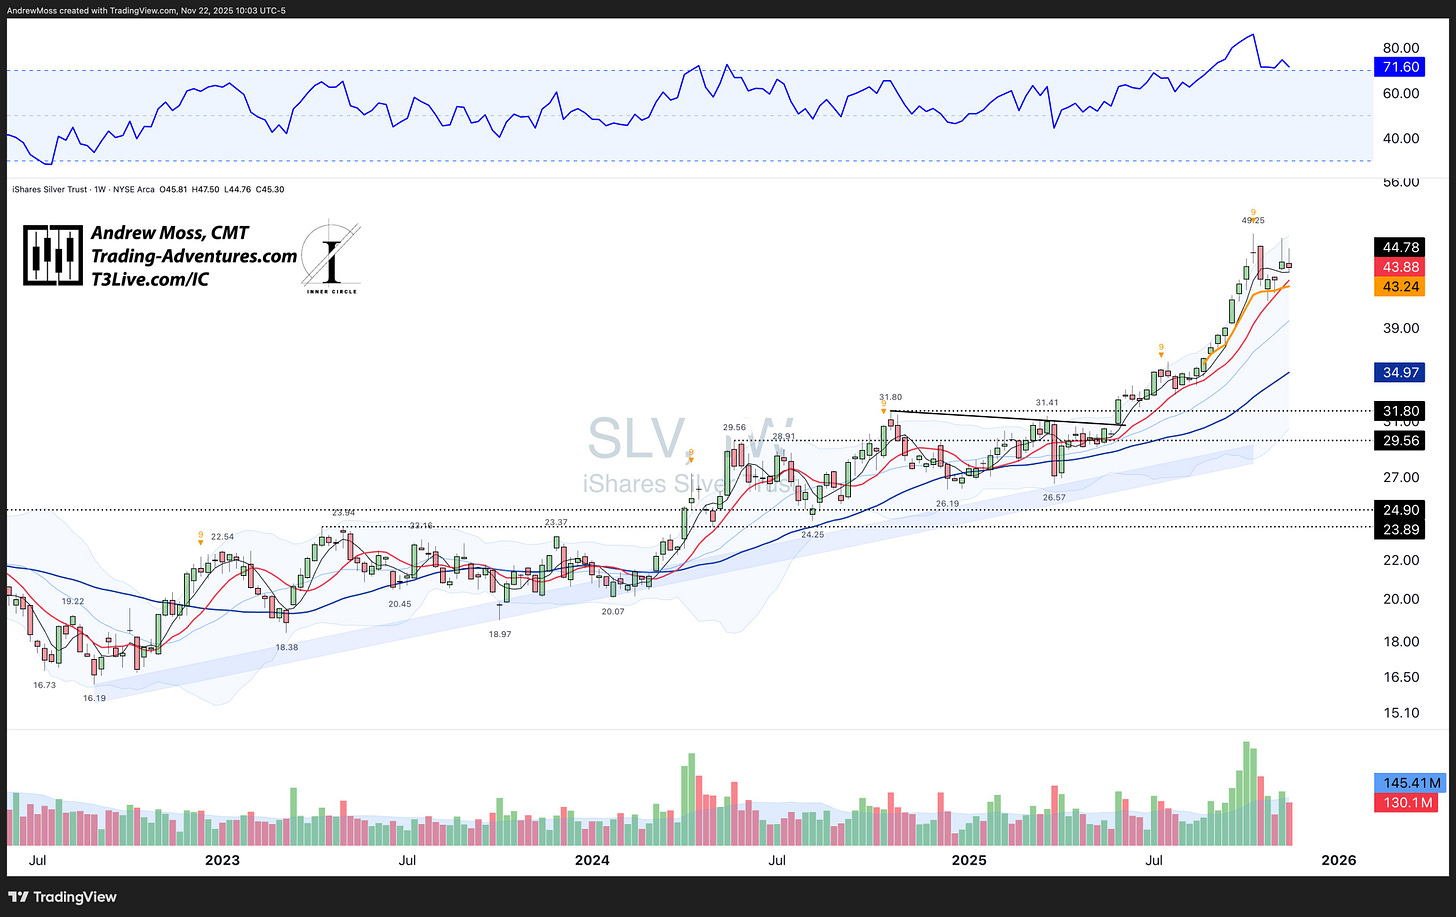
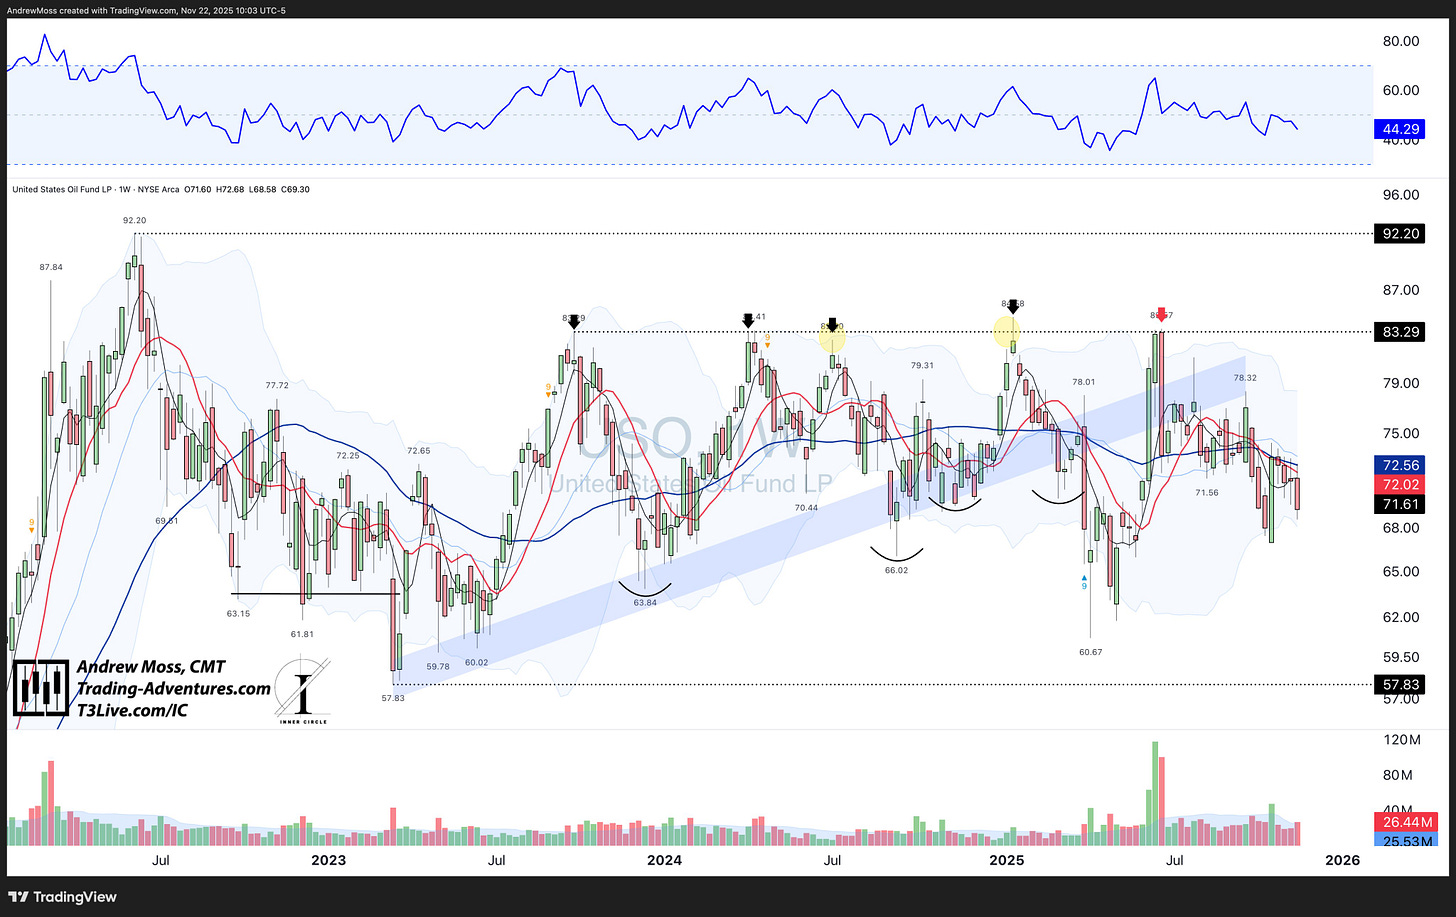
Commodities remain stalled at long-standing resistance.
GSG is pinned at the ceiling while GLD and SLV consolidate and USO struggles to regain momentum. A sideways, heavy structure across the asset class.
💰Currencies
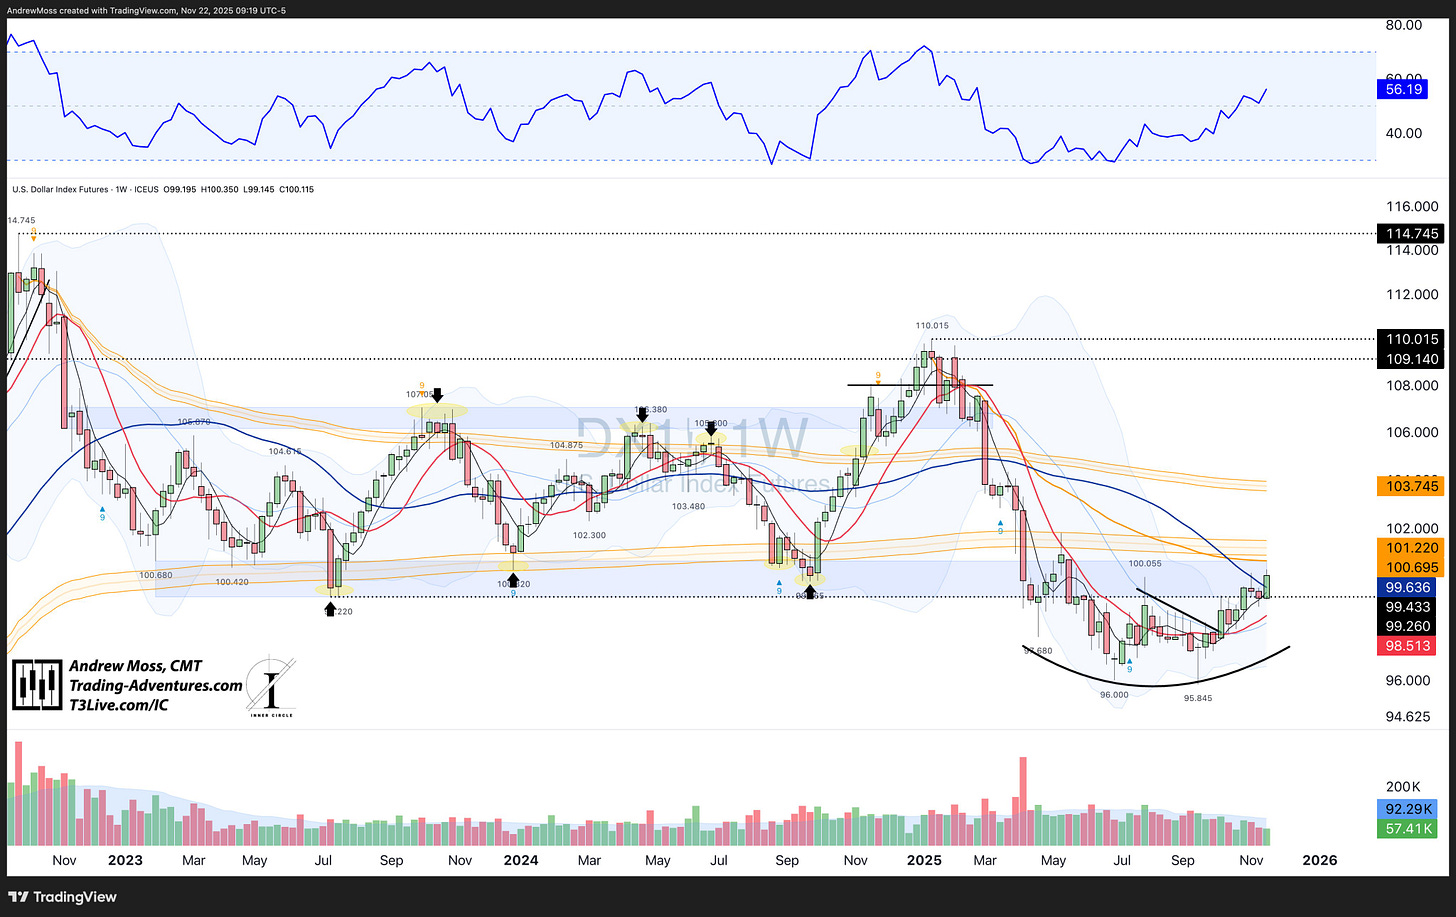
U.S. Dollar
DXY continues to form a potential bottoming pattern and posted its first close above the 40-week MA since February. A further push runs directly into the AVWAP from the January YTD high — the next important level.
₿ Crypto
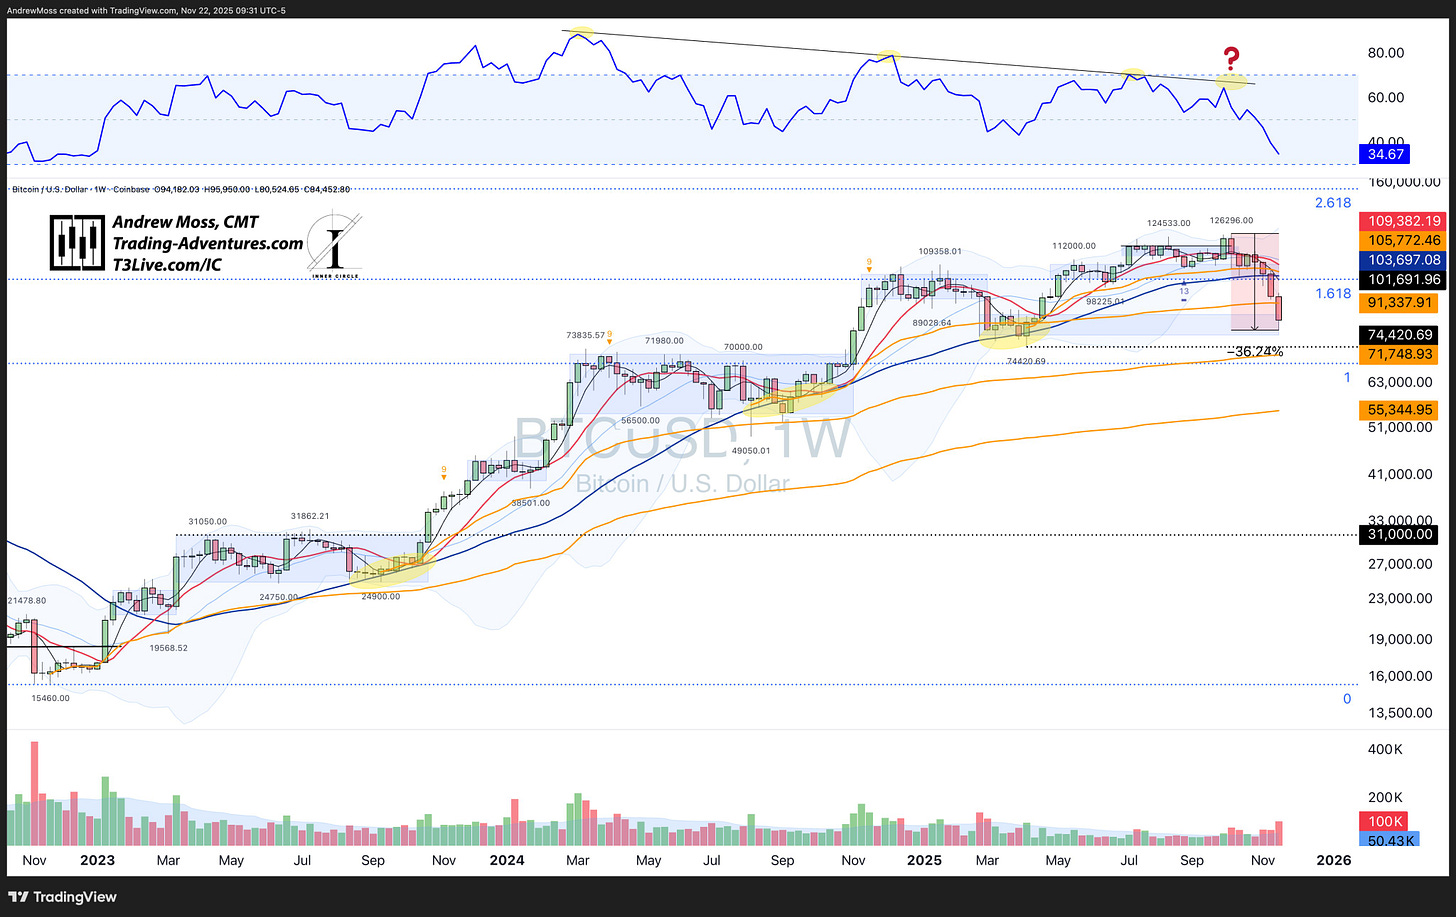
Bitcoin — BTC
Crypto continued sliding.
BTC hit a 36% drawdown from the early-October peak, after RSI failed to break its rate of decline. There’s limited price history in the current range that may act as initial support. Below that sits the prior all-time high near $69K and a key AVWAP from September ’23.
Weekly RSI ~34 — weak, but not oversold.
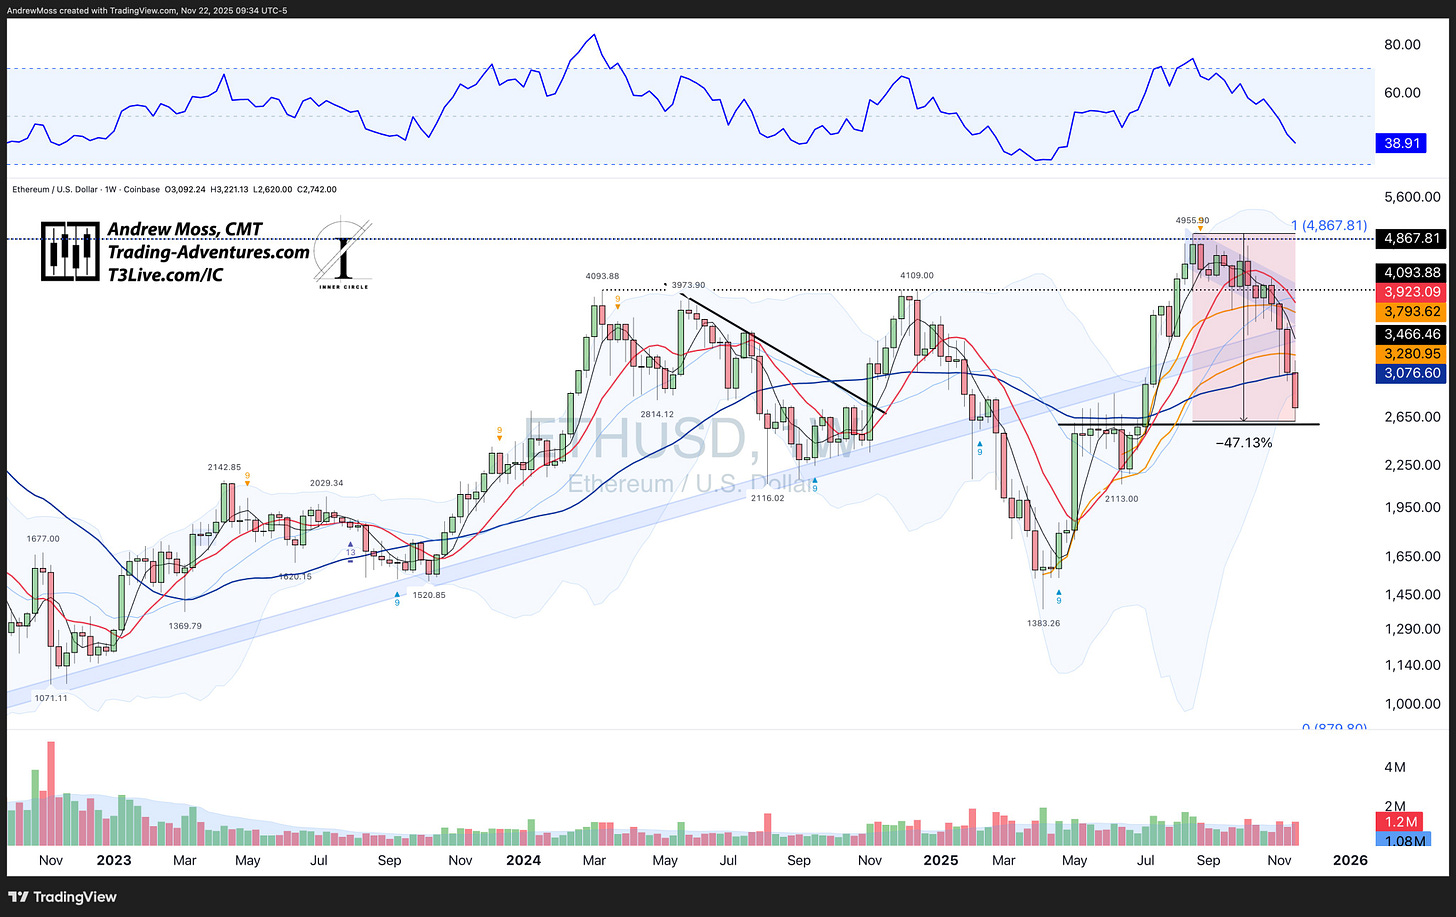
Ethereum — ETH
ETH hit a 47% drawdown this week and is approaching a pivot near $2,600. Price is well below its moving averages and outside the lower Bollinger Band, but RSI near 39 isn’t oversold. Heavy unwind, with the next reaction defined by this support zone.
Solana — SOL
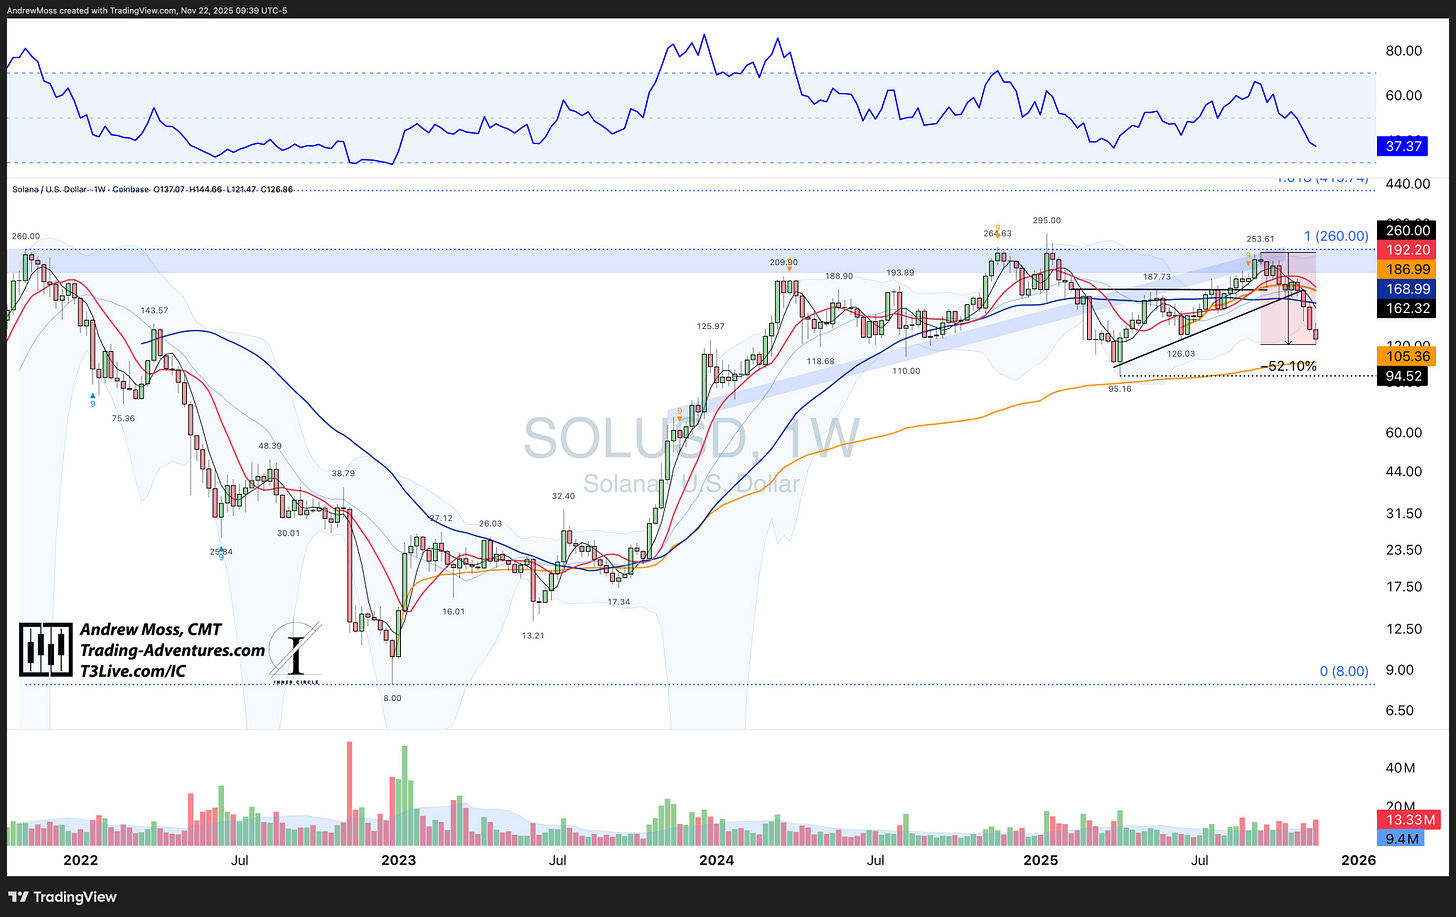
SOL has taken the deepest hit — a 52% drawdown from the mid-September high. The AVWAP from the all-time low sits near $105, with a pivot at $94.52. RSI at 37 highlights continued pressure as price approaches support.
🔁 Relative Strength
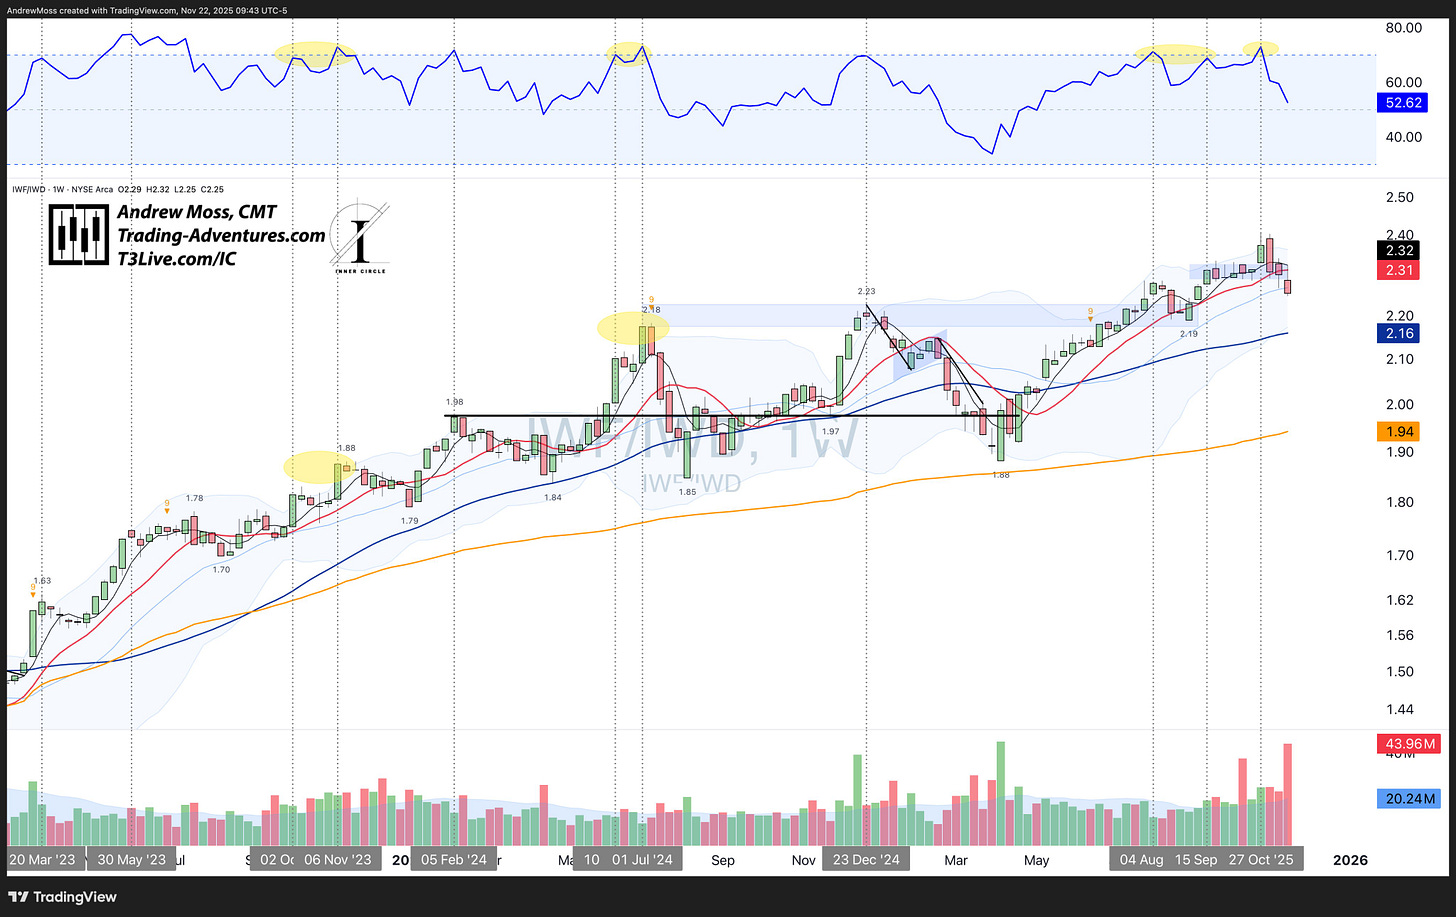
Growth vs. Value — IWF vs. IWD
Relative Strength continues to tilt toward perceived safety. Buyers favored Value over Growth again this week, with the overbought RSI signal from earlier still proving meaningful.
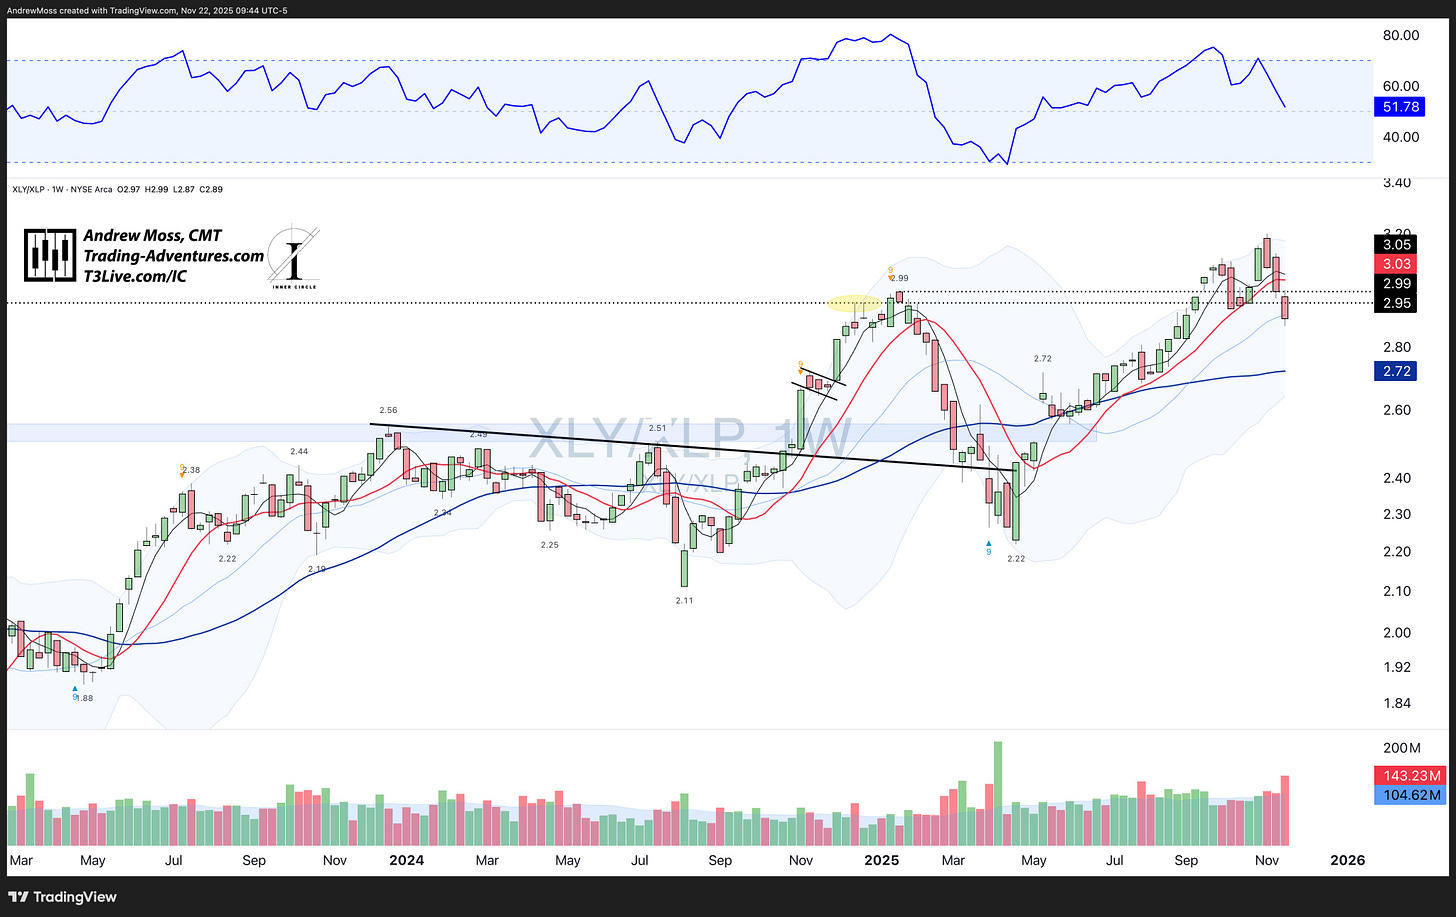
Discretionary vs. Staples — XLY vs. XLP
This ratio extended the defensive tone, breaking below multiple pivots and sliding into the lower half of the Bands.
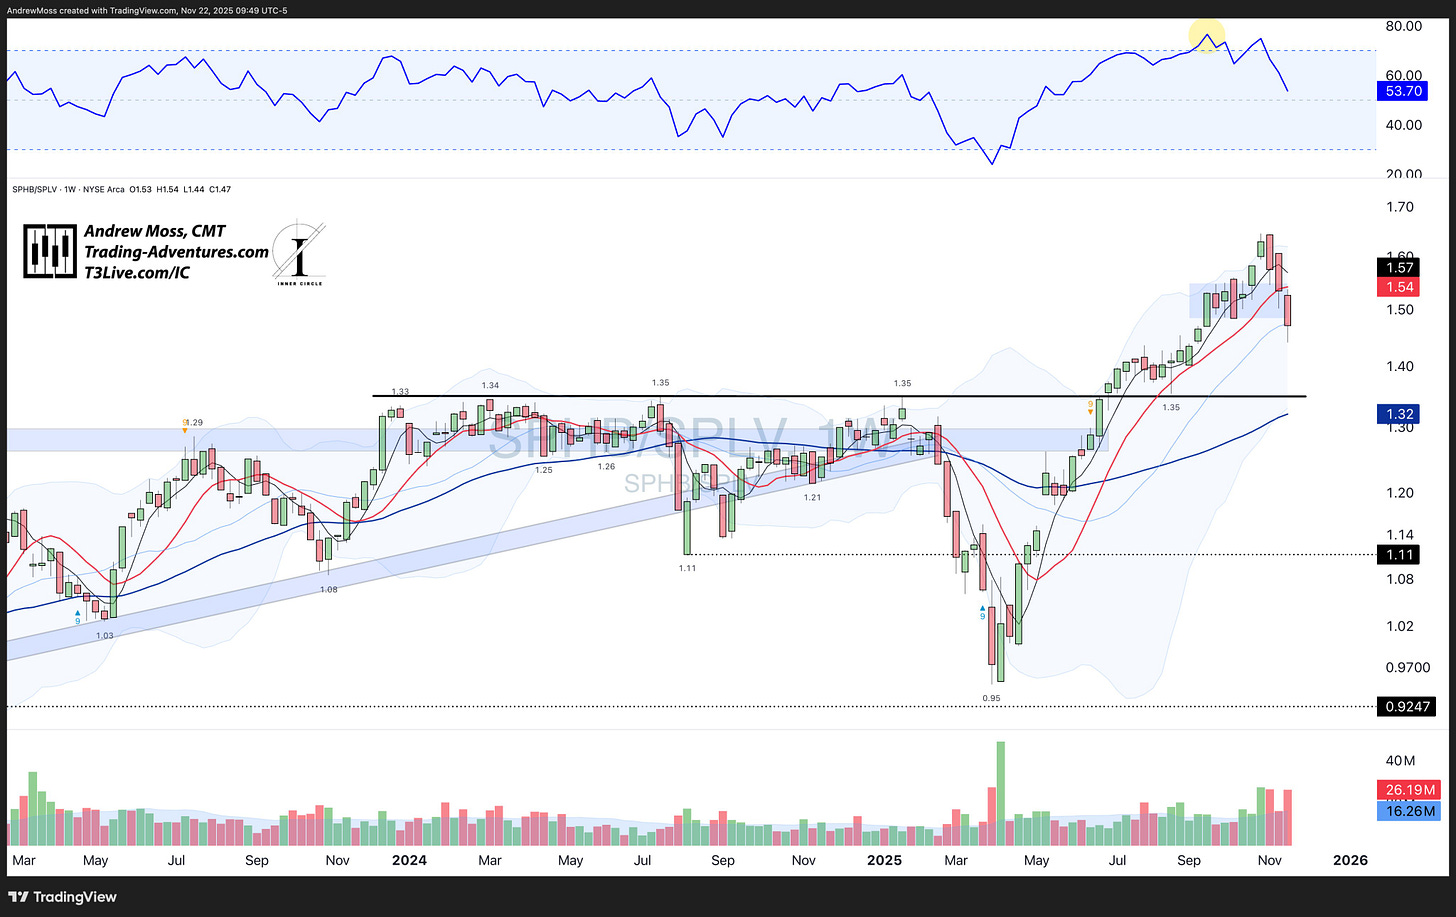
High Beta vs. Low Vol — SPHB vs. SPLV
Buying power continued shifting out of high beta and into low volatility. Low-vol is holding the bid as markets unwind.
Relative Strength — What Is It? (Really) in the new Chart School section.
⚖️ Breadth & Internal Measures
Breadth weakened again. Only 39% of SPX constituents remain above their 50-day MA, and 53% above their 200-day. A clear contraction beneath the surface.
% Bullish Percent Indices:
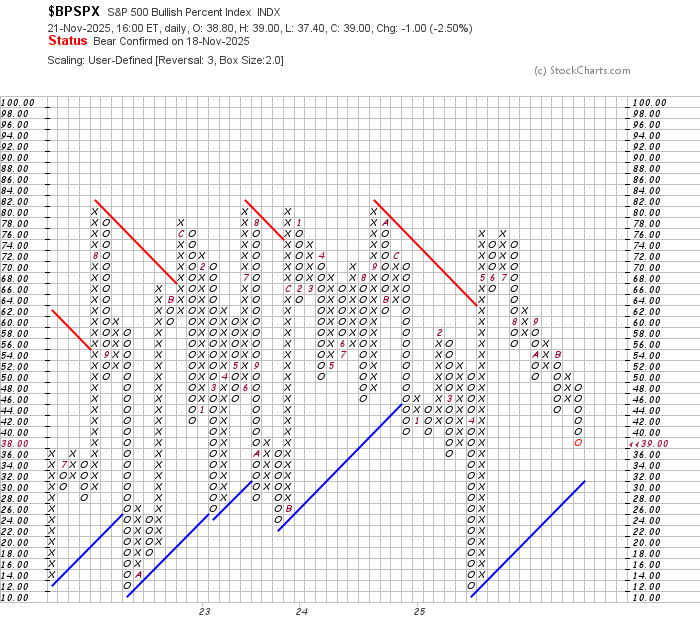
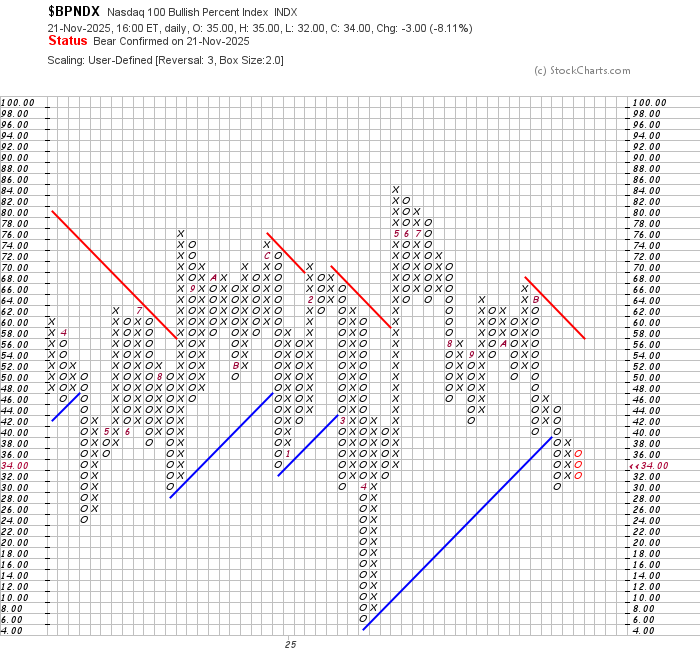
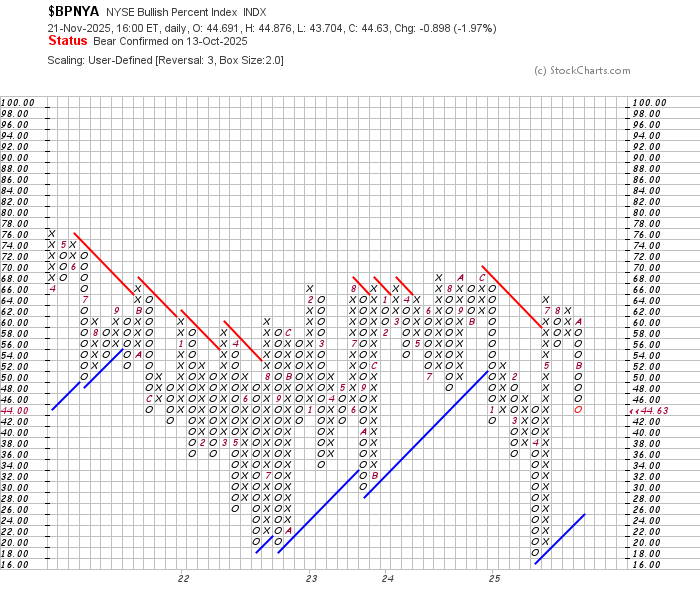
Bullish Percent Indices remain in Bear Confirmed posture:
$BPSPX: Added to its column of Os, nearing the Bullish Support Line.
$BPNDX: Beneath its BSL and shaping a potential bear flag.
$BPNYA: Continuing straight down with no stabilization yet.
Read this for a refresher:
🧭 Now What?
Short-Term
The short-term picture reflects a broad pullback that has now touched major reference points across indices — Bollinger Band centers, June AVWAPs, and key pivots. Volume expanded into the decline, but RSI readings remain above oversold. The next move turns on how price behaves at these support levels.
Medium-Term
The medium-term trend structure remains intact across major indices despite sector-level damage. Defensive Relative Strength, weakening breadth, and contracting participation frame this as a corrective phase until proven otherwise.
Long-Term
Long-term structures remain constructive. Rising moving averages, rising AVWAP anchors, and RSIs in bullish ranges support the broader trend. Some areas are stretched, others are deeply corrective — suggesting rotation, not broad trend failure.
🗓 The Week Ahead
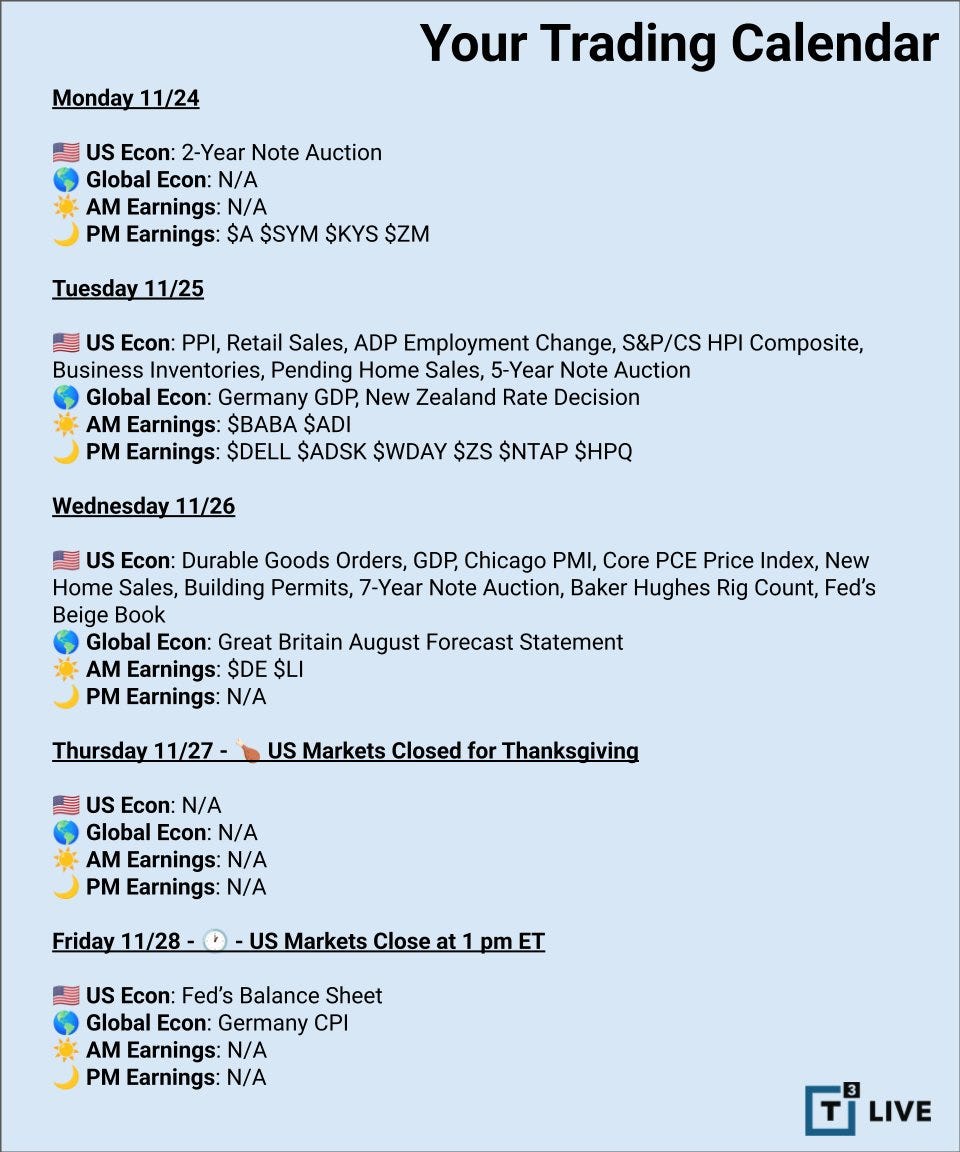
It’s a lighter schedule with the holiday, but Tuesday and Wednesday pack meaningful catalysts.
Tuesday brings the bulk of the data: PPI, Retail Sales, ADP Employment Change, the S&P/Case-Shiller Home Price Index, Business Inventories, Pending Home Sales, and the 5-year note auction. Plenty there to move rates and shape the macro tone into month-end.
Wednesday adds more weight: Durable Goods, GDP, Chicago PMI, Core PCE, New Home Sales, Building Permits, the 7-year auction, and the Fed’s Beige Book. A dense lineup for the final full session of the week.
Thursday: Markets closed for Thanksgiving.
Friday: Half-day session, with Germany CPI and the Fed’s balance sheet.
Even with the shortened week, Tuesday–Wednesday provide enough information to influence positioning into December — particularly with key support zones being tested across major indices.
🧠 Final Thought
Across markets, the story this week wasn’t about trend failure — it was about testing. Major indices pressed into familiar support zones, leadership shifted defensive, and breadth narrowed. That combination doesn’t resolve a trend, but it does tighten the focus. With a holiday-shortened week ahead, the key is staying patient and letting these levels prove their importance. The next decisive move will come from how price responds — not from anticipating it.
👋 If You’re New to Weekly Charts…
Weekly Charts isn’t just a snapshot — it’s a record of the signals that tend to show up before the big moves. A few examples from earlier this month:
Breadth deterioration was already underway on Nov. 1 — now it’s fully visible in the index-level pullback.
Bullish Percent weakness was developing beneath the surface — now all major indices sit in Bear Confirmed.
Gold’s extended RSI and monthly topping risk highlighted in early November — now reflected in its multi-week consolidation.
Crypto’s tight coils in late October and early November — now released into decisive breakdowns.
Market structure usually speaks early.
This is where I track it.
The complete article is at this link:
🙌 Thanks for Reading
Thank you all for reading and spending some time with me on a Saturday morning!
For a deeper dive, check out the new Chart School section — lessons on breadth, relative strength, AVWAP, and more.
If you found this week’s charts helpful, consider sharing or leaving a comment — it helps more traders find the work.
📤 Share
💬 Comment
♻️ and Repost
Also, consider supporting with a paid subscription to keep them coming.
All posts remain public — no locked content. Just charts, signals, and steady updates to help you trade with confidence.
—Andy
Looking For More?
Elevate Your Trading Adventure Even Further With These Offerings.
The Disclosures
***This is NOT financial advice. This is NOT a recommendation to buy, sell, or trade any security. The content presented here is intended for educational purposes only.


