📈Weekly Charts📉 January 10, 2026

Good morning ☕️
The first week of 2026 is in the books and stocks are green 🟢 across the board.
Did they just set the tone for the whole year?
Let’s take a look, with the Weekly Charts.
Subscriber Note
A subscriber-only update is coming soon, shared exclusively with Trading Adventures readers.
🔹 Small Caps Lead
IWM delivered a powerful start to the year, jumping +4.6% from last week’s close — a textbook January Effect in action.
New higher highs
Built on higher lows
Price above the upper Bollinger Band
Above all key moving averages
Healthy volume
✅ Uptrend confirmed

🔹 Large Caps Follow
SPX printed a new high, finally closing above the 1.618 extension.
Riding upper Bollinger Band
10-week MA just below
Volume is strong
RSI is firm, not extended
Trend remains intact

QQQ broke out of a multi-week consolidation:
Confirming volume
Supportive RSI
Strong positioning above all MAs
Constructive and building

DIA pushed to new highs
Clean structure, strong volume, aligned MAs
Supports continuation

🔹 International & Bonds
ACWX: 3-week rally with classic gap-and-go
Volume doubled again
Above all key MAs
Trend advancing

FXI didn’t participate this week. It’s not broken — but price stalled below recent highs, with congestion near key moving averages and tightening Bollinger Bands.
The question now:
Is this relative weakness a signal?
Or is is just coiling for a catch-up move?

AGG and TLT: Quiet


HYG: Strength on uptick volume

Nothing urgent, just worth a glance.
🔹 Macro Views
DXY: Trying for a reversal
Touched 99.26
Back above 40-week MA
Closing on 10-week MA
Still below key supply

BTC: Still rangebound, no confirmation
Below AVWAP and 10-week MA
There were tradeable moves on lower time frames, but no follow-through.
Price remains inside the weekly range, below the relevant AVWAP, and under a declining 10-week MA.
No signs of meaningful progress — yet.

GSG: Commodities compressing in multi-year range
Higher lows
Tightening structure
Repeated tests of resistance suggest energy is building

Digging into the group, and skipping precious metals (you've already seen 4000 silver charts, right?) Base Metals are making moves.
DBB: Base metals breakout
Cleared key retracement with conviction
The trend is strong
RSI is getting stretched
Volume enormous

USO: Despite recent news, oil remains stuck in its range.
Price is below key resistance and the trend remains unresolved.
No technical shift here — just noise for now.

🔁 Relative Strength Highlights
IWF / IWD: Still tilting toward value

XLY / XLP: Discretionary takes the handoff

SPHB / SPLV: Still risk-on

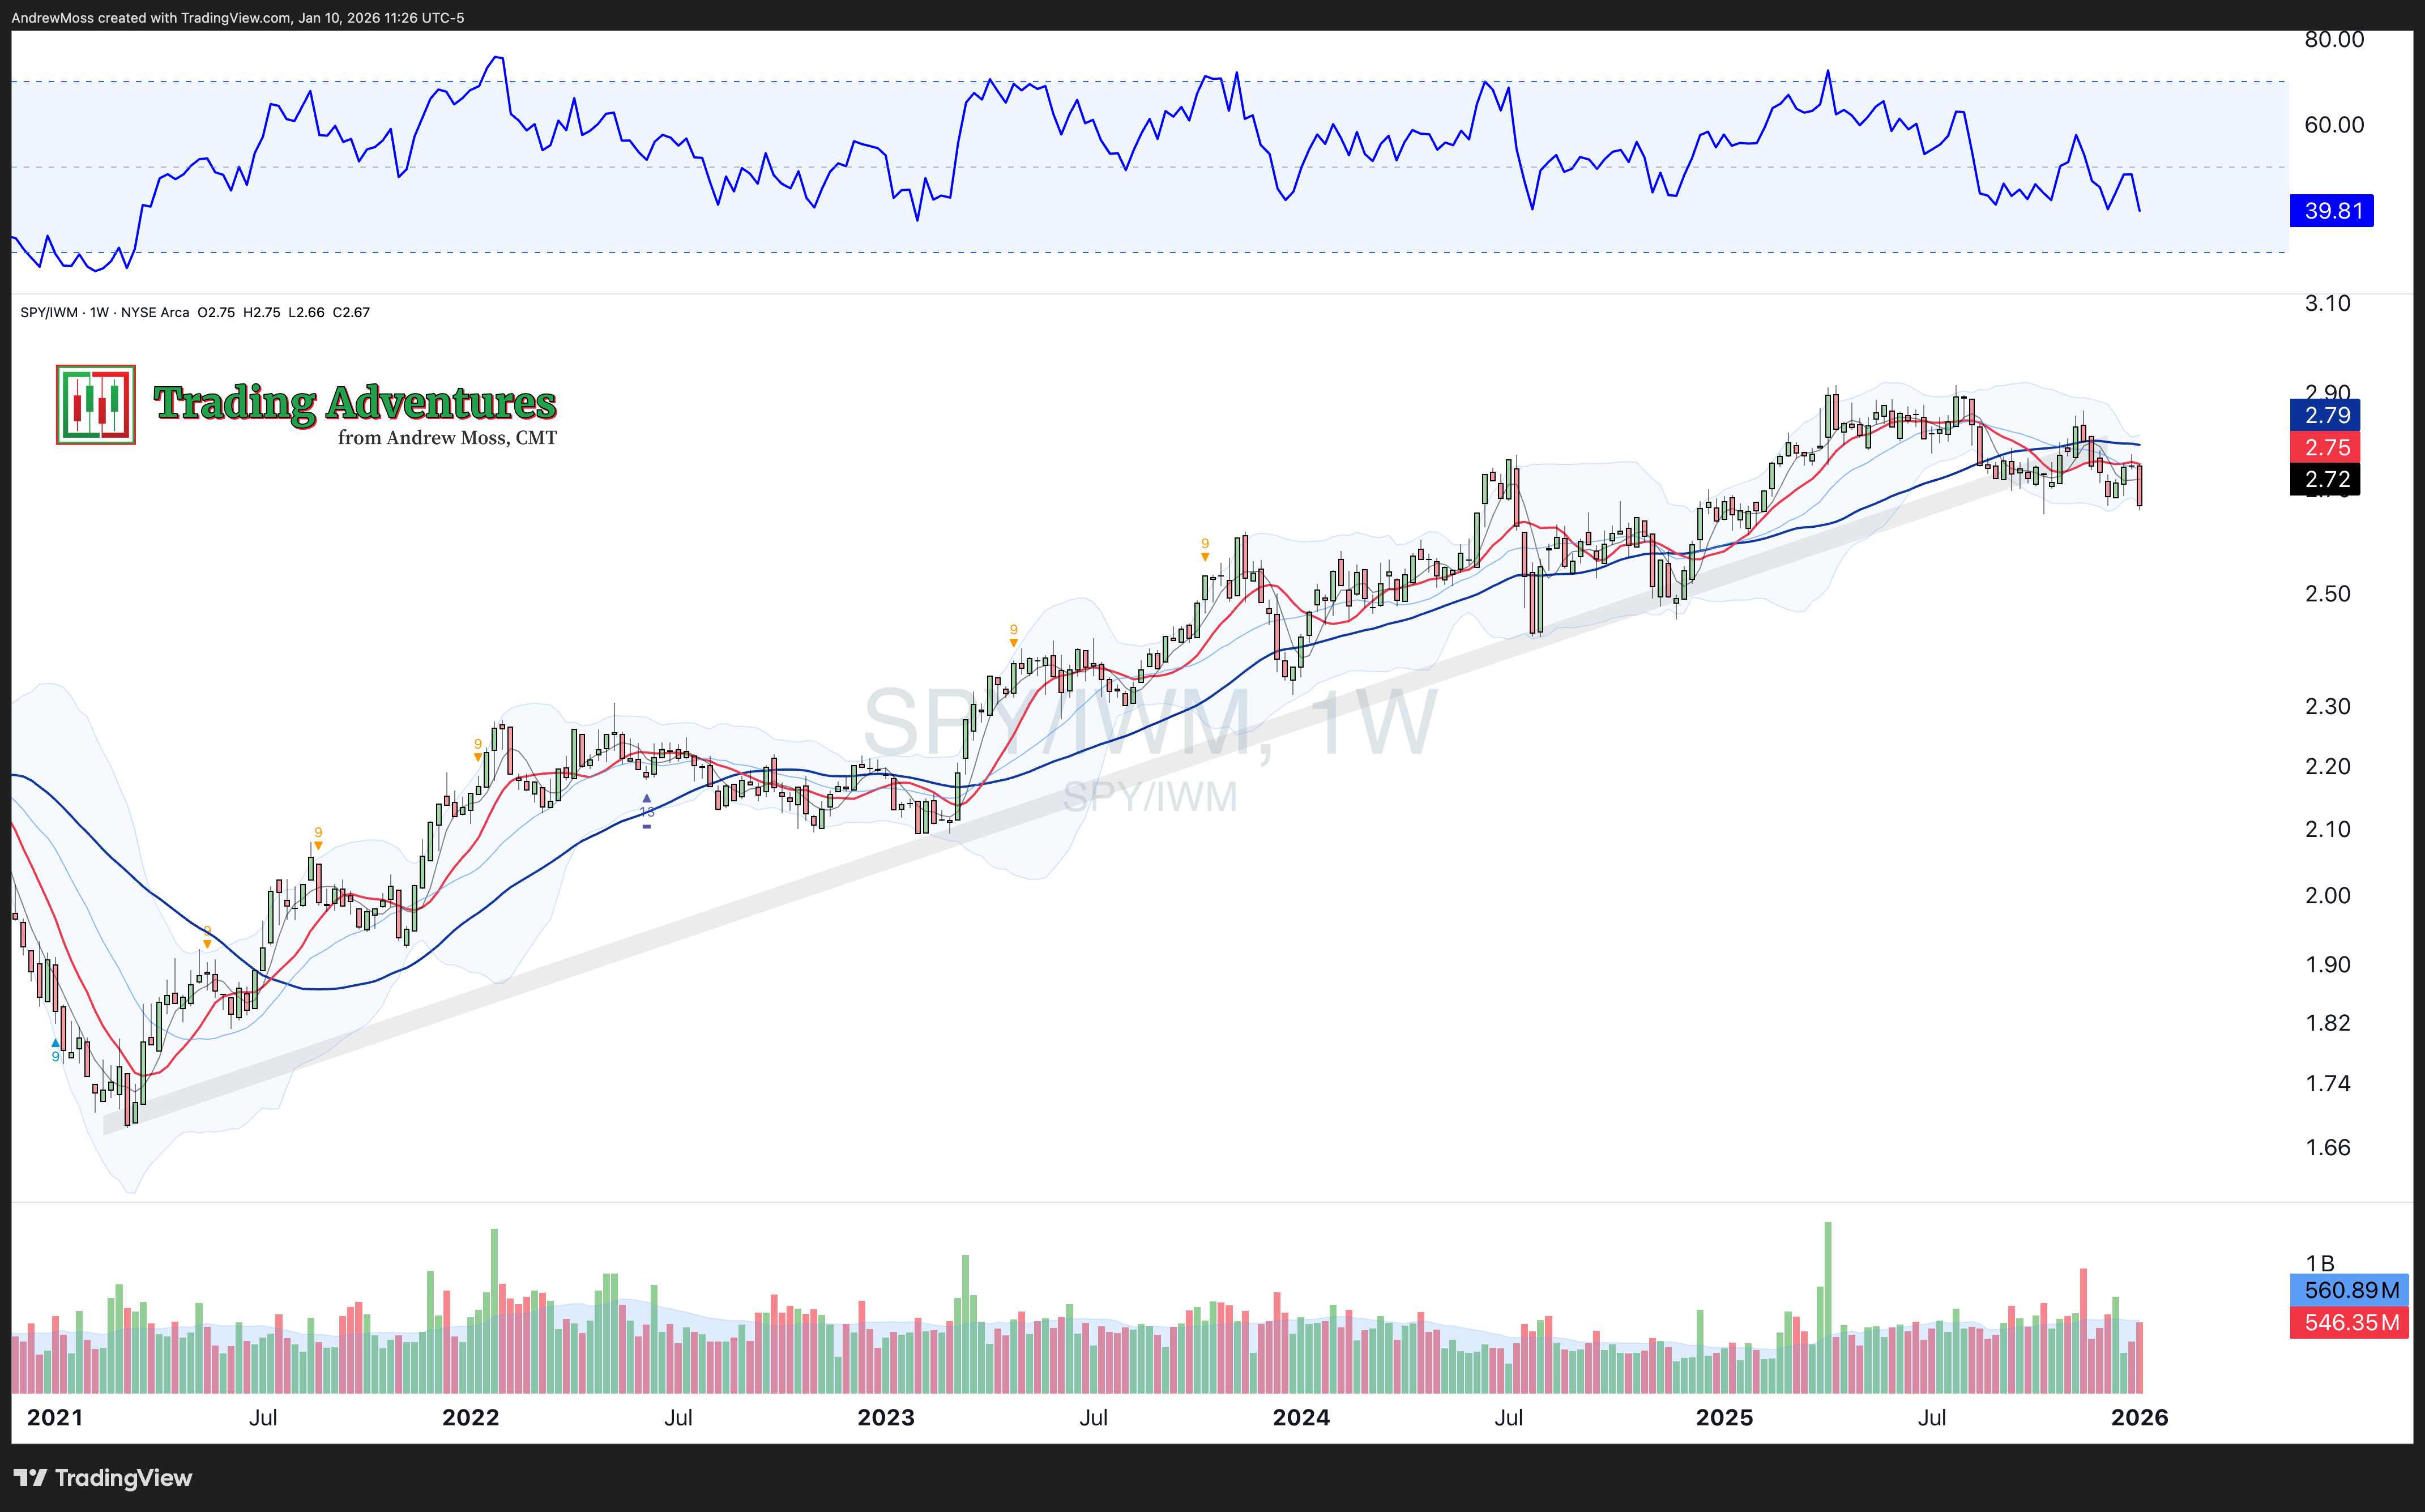
SPY / IWM: Possible trend change — large caps may be passing the baton
SPY / ACWX: Starting to look like a mirror image, possibly forming a head & shoulders

SPY / AIA: Lower highs & lows beneath AVWAPs — “descending the stairs”

SPY / MAGS:
Remember when “Mag7 is the only thing holding this up”?
Note the potential turn. Then consider what you see in AAPL, META, MSFT, NFLX.

Relative Strength — What Is It? (Really) in the new Chart School section.

⚖️ Breadth
Breadth surged — % of $SPX stocks above the 50- and 200-day MAs rose sharply

Bullish Percent Indices ($BPSPX, $BPNDX, $BPNYA) all jumped
More stocks now flashing Point & Figure buy signals


Read this for a refresher:

🧭 Now What?
Short-term 🕒
Momentum remains strong — but many names are extended.
Avoid chasing
Look for consolidation or pullbacks
Earnings season begins this week and could bring volatility
Be selective and stay alert. This is where patience pays.
Medium-term 📆
Breadth expansion and sector rotation support the trend
Risk-on ratios lean bullish
Leadership groups are emerging
Relative strength themes are gaining traction
If this holds, Q1 should stay constructive.
Long-term 🧭
The primary trend remains up — but it won’t be a straight line
Macro risks persist
Manage your risk
Respect price
Stay flexible and data-driven
Let price lead — not your bias.
🗓 The Week Ahead
Bank earnings: JPM BK BAC WFC C MS GS BLK RF
Econ data: CPI, PPI, Home Sales, Jobless Claims
Be ready and aware.

🧠 Final Thought
It’s been a wonderful start to 2026.
But don’t get giddy — or complacent.
The weeks aren’t always this easy.
Setups continue to emerge.
Stick to your rules.
Trust your process.
And always manage your risk.
🙌 Thanks for Reading
Thank you all for reading and spending some time with me on a Saturday morning!
If you found this week’s charts helpful, please -
📤 Share
💬 Comment
♻️ and Repost
It helps more traders see the work and join the discussion.
The Disclosures
***This is NOT financial advice. This is NOT a recommendation to buy, sell, or trade any security. The content presented here is intended for educational purposes only.