Welcome To 2024
Market Update January 2, 2024
Special Announcement!
More new features are coming to Trading-Adventures.com!
You’ve seen the newest educational article - Chart School.
You’ve seen (and subscribed to?) the YouTube channel.
Now, get ready for another exciting addition coming later this month.
If you’re visiting or reading on the website, make sure you get the news by subscribing now.
And if you’re one of the many new subscribers, thanks for signing on!
Keep an eye out for updates to the ‘Start Here’ and ‘About Me’ pages - coming soon.
The Markets
Welcome to 2024.
All M7 stocks are red, with AAPL leading lower, down -3.58%.
NFLX is down -3.78%. AMD -5.99%. INTC -4.88%. And so on.
Why?
Maybe it's because AAPL got a downgrade. Or perhaps it’s because semiconductors had some negative news. Or maybe traders didn’t want to book profits and incur taxes in 2023.
The important thing is the reminder that even solid stocks and markets are not immune to selling. It can come at any time for any reason. Don’t be surprised; don’t let it trigger a knee-jerk response.
The potential for this occurrence should be accounted for in every trading plan. (more on that coming soon)
If you’re tactical and on a shorter timeframe, it’s a great reason to take some profit and move stops up along the way. If you’re a long-term holder or position trader, this is just part of the deal. You expect this and either ignore it or figure out how to use it to your advantage.
And if you’re interested in charts, technicals, and Intermarket analysis, you consider the implications of previous instances, seasonality, and various indicators that may give clues about the rest of the year.
Right now, that means:
The Santa Claus Rally
The January Effect
The January Barometer
We looked at this first in “Melting Up” on December 18.
There is one day left in the SCR period. So far, SPY is down -0.27%.
A ‘rally’ or positive move is expected. This indicator gives the best signal when that doesn’t happen.
If Santa Claus should fail to call, bears may come to Broad and Wall.
We’ll tally the official results tomorrow and review them in Thursday’s update.
In the meantime, if you didn’t see the 2023 Year End Monthly Chart Review, you will want to catch up.
Here are a few charts from that thread with a 2023 review and a look into 2024.
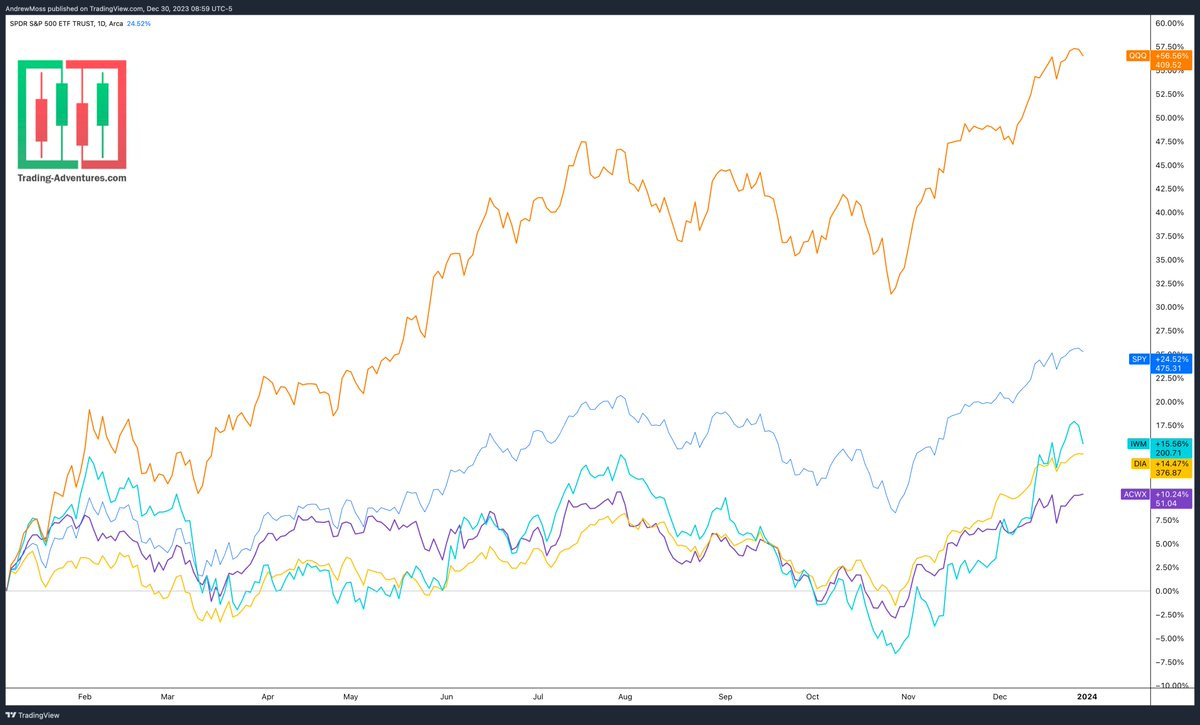
Stocks rose consistently for the last two months / 9 weeks, logging impressive annual performance numbers.
QQQ +56.56%
SPY +24.52%
IWM +15.56%
DIA +14.47%
ACWX +10.24%
SPX The monthly chart shows a long, steady uptrend, back at highs. For 2024 and beyond... A continuation higher could aim at a couple of different Fibonacci extension levels.
is from the '09 low to the '21 high -> $7384
is from the '20 low to the '21 high -> $6252
If trouble shows in the form of a 'double top,” ~$3930 is a sensible level for risk management. There are two Fibonacci retracements, and the longstanding uptrend line would also be threatened.
QQQ Monthly closed at a new all-time high.
While it is at the upper Bollinger Band, it is still at the center of the long-running channel and has more room above in the RSI. Fibonacci extensions give potential targets of $549 and $645.
$320 is a risk management level to watch, as again, there is an overlap of two Fibonacci retracement levels and the longstanding uptrend line.
And here’s one that did not get posted. It is the same 2023 one-year performance chart posted above but with the addition of equal weight indexes.
RSP +11.26%
QQEW +32.12%
Gains were not limited to just seven stocks.
Now, on to today’s charts.
The Charts
SPY prints a spinning top (signaling indecision) between the 8 and 21-day MAs. Things could go either way from here. Below is a pivot, and the 21-day MA is near $468 for potential support. Above, recent highs and then the pivot near $480 would be tests.
QQQ touched the 21-day MA and rallied slightly.
IWM was a leader, trading in positive territory for much of the day before closing on the $199 pivot level.
DIA Is the only key index that managed to close with a green day, helped mainly by the banks and financial stocks.
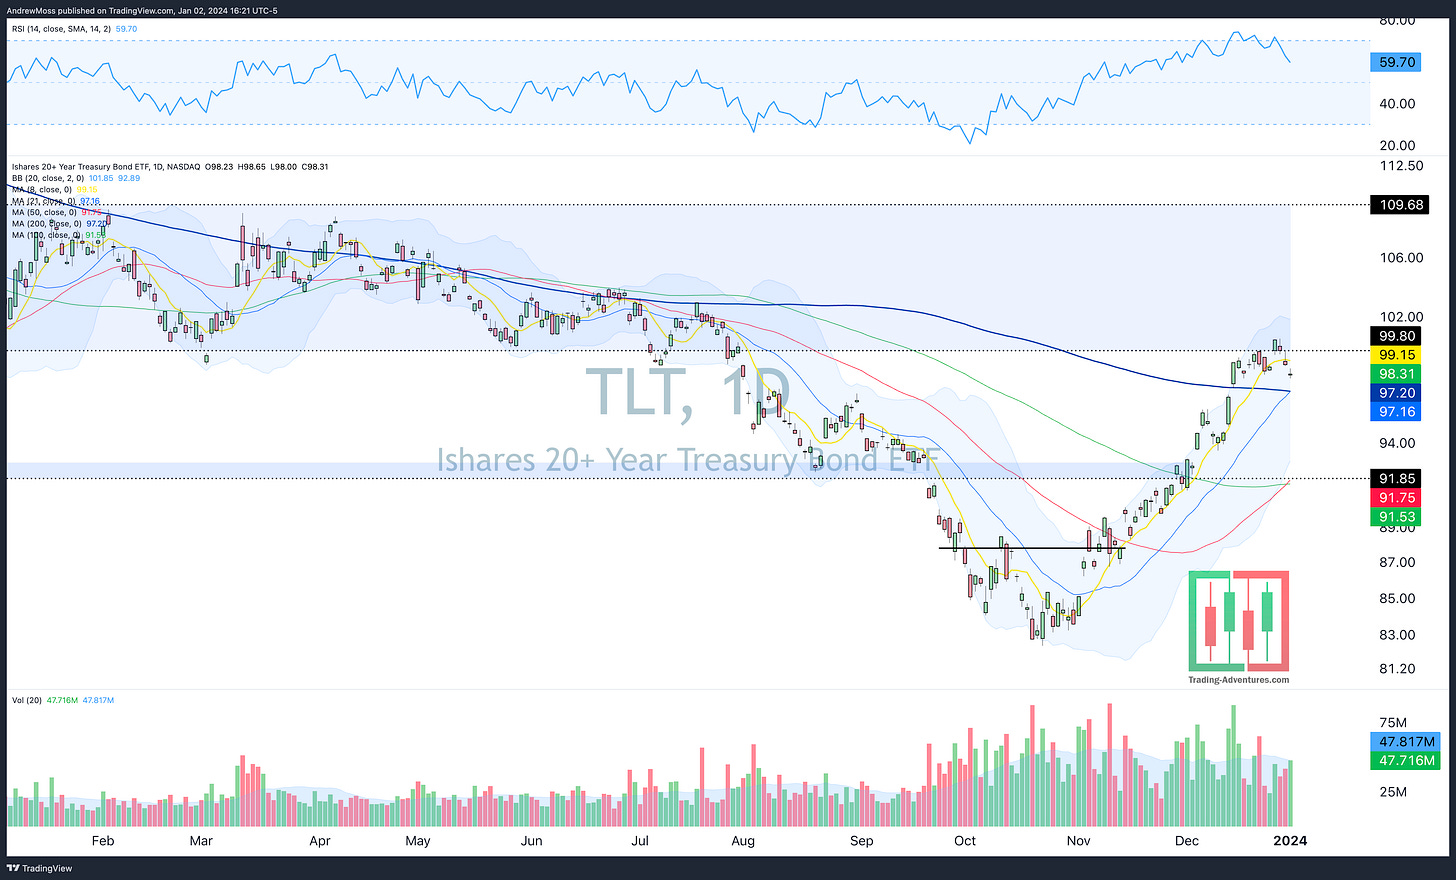
TLT was lower but remained above the 200-day MA.
DXY A sharp rally in the Dollar was a huge factor in stock weakness. Sub $102 is where this should be if stocks are to regain strength.
The Closing Bell
Last week's calm and quiet action quickly gave way to more exciting times.
Some names are testing their 21-day MAs. Some are testing the 50-day MAs. Some are making highs ($AMGN, $DIA, $IBB, $JPM, $XLV)
The indexes (except $DIA) have resolved their extension.
These are the times that can refresh the opportunity set. We’ll take it one step at a time, see where the strength lives, and what dips (if any) can be bought.
The Disclosures
***This is NOT financial advice. This is NOT a recommendation to buy, sell, or trade any security. The content presented here is intended for educational purposes only.
Andrew Moss is an associated member of T3 Trading Group, LLC (“T3TG”), an SEC-registered broker/dealer and member of FINRA/SIPC. All trades placed by Mr. Moss are done through T3TG.
Statements in this article represent that person’s opinions only and do not necessarily reflect those of T3TG or any other person associated with T3TG.
Mr. Moss may hold an investment position (or may be contemplating holding an investment position) that is inconsistent with the information provided or the opinion being expressed. This may reflect the financial or other circumstances of the individual, or it may reflect some other consideration. Readers of this article should consider this when evaluating the information provided or the opinions being expressed.
All investments are subject to the risk of loss, which you should consider in making any investment decisions. Readers of this article should consult with their financial advisors, attorneys, accountants, or other qualified investors before making any investment decision.
POSITION DISCLOSURE
January 2, 2024, 4:00 PM
Long: AMD, AMZN0119C145, AMZN0119C155, IWM, TNA0105C40
Short:
Options symbols are denoted as follows:
Ticker, Date, Call/Put, Strike Price
Example: VXX1218C30 = VXX 12/18 Call with a $30 strike


